Farmland Preservation and Urban Expansion: Case Study of Southern Ontario, Canada
 Wayne Caldwell
 Sara Epp
 Xiaoyuan Wan
 Rachel Singer
  Emily C. Sousa
- School of Environmental Design and Rural Development, University of Guelph, Guelph, ON, Canada
Farmland is an essential resource for the sustainability and security of human food systems. Preserving an agricultural land base is critical, as it is significantly affected by local, national, and global urbanization. This research introduces a case of farmland preservation in southern Ontario. This area contains some of Canada's most finite and productive soils but has an agricultural system facing enormous pressure from urban expansion. This paper reviews the farmland preservation policy framework within Ontario and provides insight into the role of different levels of government in protecting this critical resource. It also provides data at a regional level that provides the basis to evaluate the success of provincial and local policies. By tracking agricultural land conversion through local Official Plan Amendments (OPAs), this study documents farmland loss across southern Ontario between 2000 and 2017. Implemented and approved by local government and designed with public input, municipal Official Plans outline and describe land-use planning policies on how municipalities should use lands to meet community needs and desires. OPAs are formal and legally binding administrative changes to a municipal Official Plan decided through an open public process, which are required to change local land-use designations that conform with the long-term vision for growth and physical development. These OPAs may include the conversion of farmlands for non-farm uses (or, in contrast, the protection of agricultural lands). Over time, they will reveal the loss of farmlands in each community for different uses (and reflect changing priorities). Using OPAs to track the conversion of prime agricultural land is an innovative and rigorous methodological contribution, given the lack of data documenting long-term changes to the availability of agricultural lands and the impacts of urbanization on farmland conversion. Measuring farmland loss with this approach can be transferred and applied to contexts where municipalities are the entities responsible for agricultural land-use planning, outside of Ontario and beyond. Data from 36 counties/regions shows that the provincial policies and local planning framework have worked in tandem to affect the agricultural land base in southern Ontario significantly. In Central Ontario, the most urbanized area of Canada, the Province's Greenbelt Plan has significantly reduced the rates of farmland loss since 2005, while the Growth Plan and other policies contributed to enhanced municipal control over agricultural land conversion. Specifically, the Inner Ring municipalities have played increasingly active roles in agricultural land protection with both planning approaches and local initiatives. Outer Ring municipalities have seen increasing urbanization pressure. Data on farmland loss for non-agricultural use showed large-scale municipal-led urban boundary expansions and small-scale individual applications on policy changes. In Western Ontario, over the past two decades, there has been no obvious upward or downward trend of farmland loss. Most of the farmland conversion cases in this region were small-scale applications to create small lots on existing agricultural land to allow non-agricultural uses such as commercial, recreational, residential, and agricultural-related facilities. Since 2000, Southeastern Ontario, which has the smallest provincial share of prime agricultural land, has experienced limited farmland loss, consisting primarily of small-scale, individual applications on land-use re-designations (partially reflecting reduced acreages of prime agricultural land). The provincial policy impact on farmland preservation is not as evident in this region. The findings and methodology of this study contribute to the groundwork on farmland availability and land-use planning policy development and research by providing a baseline enumeration of farmland availability and the effect of farmland protection policies at provincial and municipal levels within Ontario's land use planning regime.
Introduction
Farmland is an essential resource for the sustainability and security of human food systems, environments, agricultural industries, and livelihoods. Beyond the provisioning value and services of farmland, such as with food and fiber, sustainably managed farmland provides several other invaluable ecosystem services, such as pollinator and wildlife habitat, carbon sequestration, nutrient cycling, water regulation, as well as amenity value (Power, 2010). However, the capacity of farmland and agricultural industries to provide these services beneficial to collective wellbeing depends on the availability and quality of farmland available (Barral et al., 2015; Hu et al., 2018; Benton et al., 2021).
Due to global urbanization, farmland availability has been increasingly under threat from social, physical, and climate factors (Hertel, 2011; Vinge, 2018). Preserving agricultural land for current and future generations is a worldwide topic that must be addressed urgently (Hertel, 2011; Caldwell et al., 2017; FAO, 2021). Research on the threats of urbanization on farmland resources specifically is of global priority and is evident in Canada (Qiu et al., 2015; Epp and Caldwell, 2018; Connell, 2020; Cameron and Connell, 2021), the United States (Moroney and Castellano, 2018; Narducci et al., 2019), Europe (Tan et al., 2009; Perrin, 2013; Skog and Steinnes, 2016), and China (Chien, 2015; Zhang et al., 2016; Hu et al., 2018; Duan et al., 2021; Miao et al., 2021). There is a need to address complex drivers contributing to farmland loss as well as diminishing physical capacity of lands to support climate change mitigation and adaptation measures (Masson-Delmotte et al., 2021). Agricultural and urban anthropogenic land uses have already partially converted an estimated 43% of global land area (Barnosky et al., 2011), having significant implications for the land base fragmentation, biodiversity loss, ecological health, and climate resilience (Laurance et al., 2014; Capmourteres et al., 2018). Additionally, once farmland is lost to urban development, its productive capability is lost forever (Moroney and Castellano, 2018). Thus, preserving and protecting existing agricultural land resources is critical for the future resilience and sustainability of food systems, communities, and agricultural economies.
Canada has a robust agricultural sector with over $100 billion annual GDP and 2.3 million jobs in agriculture and agri-food (Agriculture and Agri-Food Canada, 2019). Nevertheless, farmland is a limited resource in Canada, and only occupies 7.3% of the land area due to soil quality, climate, and terrain restrictions (Statistics Canada, 2014). Much of the most productive agricultural soils are located within Ontario, both the most populated part of Canada and where most farmland loss occurs nationally (Statistics Canada, 2016). Census data shows that total farmland in Ontario has fallen by 50% since 1941. Additionally, over 1.5 million acres of farmland were lost between 1996 and 2016 (Ontario Ministry of Agriculture, 2017). Like many fast-developing regions worldwide, urban sprawl has consumed large tracts of agricultural soils in Ontario during the past few decades. Urbanization is unlikely to slow down: the population in Ontario is projected to grow to over 20 million by 2046, representing a 35.8% increase from 2020 (Government of Ontario, 2022). Moreover, the fragmentation of the agricultural land base and the imposition of low-density urban sprawl into agricultural communities often poses challenges for agricultural viability and compatibility for farmers and non-farmers alike (Qiu et al., 2015; Epp and Caldwell, 2018).
Relative to the rest of the province, southern Ontario contains some of Canada's most finite and productive soils (Agriculture and Agri-Food Canada, 2019). The Canada Land Inventory (CLI) is used to designate land based on soil type, giving the land a numerical designation based on agricultural suitability (in terms of crop production). The CLI consists of seven distinct classes of agricultural land based on its productive potential, with classes 1, 2, and 3 soils considered to be “prime agricultural land.” By contrast, categories above soil classification 3 are deemed limited in their productive capability. Only 0.5% of Canada's total land base comprises Class 1 land (which is the highest quality in soil classification), and most of this soil is in southern Ontario (Walton, 2003; Caldwell et al., 2017). Since most of the future urban development is expected to occur in this region, farmland protection is vital for southern Ontario (Office of the Auditor General of Ontario, 2021).
While movements, programs, and policies to protect farmland from urbanization across North America have been implemented since the 1950s (Bunce, 1998), there is much to learn about the effectiveness of farmland protection policies (Liu and Lynch, 2011; Connell, 2020). For example, since 2005, the Ontario provincial government has established a series of policies to regulate urban sprawl and strengthen farmland protection, including the Provincial Policy Statement (MMAH, 2005c, 2014), the Greenbelt Plan (MMAH, 2005b), and the Growth Plan (MMAH, 2005a). Collectively, these plans establish a provincial land-use planning framework to identify policies for where urbanization should not occur to protect ecological features such as farmland, and guide transit-oriented development, intensification, and densification to already urbanized communities. These provincial plans are then interpreted and implemented at the municipal level, leaving room for variability in their interpretation and application of policies amongst local communities. Since establishing these policies, little research has evaluated farmland loss in southern Ontario to test their effectiveness in preserving farmland. This absence of evaluation is despite Ontario's farmland protection policies being internationally recognized for its success (see Government of Ontario, 2007) and establishing one of the most extensive greenbelts in the world (Carter-Whitney, 2008). This article attempts to provide a comprehensive provincial-wide assessment of one of the world's largest geographically protected farmland areas (Carter-Whitney, 2008), building off a study exploring farmland loss in two Ontario municipalities from Epp and Caldwell (2018). This study also contributes to the larger body of literature evaluating the effectiveness of farmland protection policies around the globe (Connell, 2020).
While the Canadian Census of Agriculture quantifies the amount of agricultural land in production, it lacks documentation of land-use planning decisions (i.e., non-farm and urban development), compromising the preservation of prime agricultural lands. This research fills this gap from a land-use planning perspective, for which the methodological framework can be applied in other municipal jurisdictions responsible for agricultural planning but have yet to officially account for the preventative loss of this vital resource (Robert and Mullinix, 2018; Connell, 2020; Cameron and Connell, 2021). An innovative approach to measuring farmland loss is introduced by tracking agricultural land conversion in municipal Official Plan Amendments across southern Ontario municipalities. OPAs are legally binding municipally-led administrative decisions to change a municipal Official Plan, which are required to redesignate lands to different uses so that new proposed uses may conform with the municipality's long-term vision for growth and physical development. In turn, OPAs reflect the potential loss of farmland and change in community development priorities over time. This approach provides a more comprehensive, accurate, and reliable picture of the state of farmland loss in Ontario by measuring the amount of converted farmland to non-agricultural uses when the land-use planning decision was made (Epp and Caldwell, 2018). The reliability of this method is relative to what could be inferred from the Canadian Census of Agriculture, or other methods of measuring farmland loss, such as land cover map comparisons (Chen et al., 2016; Song and Liu, 2017), plan quality evaluation (Connell, 2020; Cameron and Connell, 2021), GIS analysis and remote sensing (Qiu et al., 2015; Skog and Steinnes, 2016; Hu et al., 2018; Duan et al., 2021), propensity score matching (Liu and Lynch, 2011), econometric modeling (Qiu et al., 2015; Xu et al., 2019; Miao et al., 2021), statistical analysis of census data (Epp and Caldwell, 2018; Moroney and Castellano, 2018), and qualitative analysis of archival records and anecdotal accounts (Perrin, 2013; Cameron and Connell, 2021). The analysis of OPAs thus reveals how provincial policies shaped farmland loss at a regional scale between 2000 and 2017. Tracking the decisions made during this time frame reflects how municipalities may vary in their interpretation and implementation of the provincial land-use planning framework, inclusive of plans such as the Provincial Policy Statement, Growth Plan for the Greater Golden Horseshoe, and the Greenbelt Plan.
Background and Context
This next section will review the context for the research, providing some background into the legislative and policy-setting justifying land-use planning and farmland preservation in Ontario. This section will then provide an overview of the study area, including geography, development characteristics of various regions, and land area.
Agricultural Land-Use Planning and Legislative Basis for Farmland Protection in Ontario
A hierarchical planning system regulates agricultural land in Ontario. This means that the provincial government sets up the overall policy framework, which applies to various regions across the province. Municipal policies must meet the requirements of consistency and abide by provincial and regional regulations, plans, and policies in their local planning decisions. However, local-level interpretation and implementation of provincial planning policies will vary by municipality. This system promotes a coordinated planning system that achieves “good planning” that recognizes specific provincial interests (e.g., growth management and farmland protection) while allowing local governments to translate policies and make decisions to fit their local needs, desires, and contexts. As a result, decisions around agricultural land uses will vary at municipal levels despite provincially implemented farmland protection policies.
The Provincial Policy Statement (PPS) establishes the provincial interest in planning across the province, and municipal planning decisions must be consistent with this document. It lays out the vision for Ontario's long-term agricultural land protection and specifies conditions under which agricultural land can be converted to non-agricultural uses. Municipalities have the authority to create their own Official Plans. In doing so, municipalities can establish their local agricultural land designation system, specify local agricultural land-use policies, and map out the designated agricultural land under the authority of the provincial Planning Act (1990). Official Plans serve as a guiding document that outlines the community's vision and designates land for a variety of uses. Any change in agricultural land designations must go through the municipal government's approval and be finalized via Official Plan Amendments (OPAs).
The Greater Golden Horseshoe (GGH) is Canada's and Ontario's most urbanized region. The GGH is currently home to an estimated 10.2 million residents in just 3% of Ontario's land area (Office of the Auditor General of Ontario, 2021). Regarding economic significance to Ontario, the GGH alone contributes two-thirds of provincial gross domestic product (GDP) and one-quarter of Canada's annual GDP (Allen et al., 2015). Concurrently, some of Canada's finite, most productive agricultural lands and ecologically sensitive features, such as the Greenbelt, Oak Ridges Moraine, and Niagara Escarpment, are found in this part of southern Ontario. As a result, the GGH is an economic powerhouse and asset for agriculture and agri-food industries in Ontario. For example, 40% of GGH land area is quality productive farmland, and the regional agriculture industry contributes supports 38,000 jobs and one-third of Ontario's agri-food industry area (Office of the Auditor General of Ontario, 2021). Despite the value of these finite agricultural resources and agri-food networks, this provincial resource base has historically been threatened by “scattered” low-density development and urbanization. This growth pattern has led to farmland loss and the subsequent loss of ecosystem services that the agricultural resources and ecological features provide (MMAH, 2005a). For instance, from 1996 to 2021, the GGH's population increased by 57%, with the provincial government forecasting an additional 45% increase (to 14.8 million residents) by 2051 (Office of the Auditor General of Ontario, 2021). This unprecedented rapid growth and urbanization in southern Ontario have emphasized the need for effective land-use planning policies and measures to prevent adverse outcomes from unchecked growth in the region and prevent sprawling development from spilling outwards of the highly-desirable GGH to the rest of southern Ontario's prime agricultural areas.
In 2005, the provincial government undertook several initiatives to strengthen their response to urban sprawl across Ontario (Macdonald and Keil, 2012). Legislation and policies were issued in tandem to guide urban intensification and agricultural resource protection in southern Ontario. Agricultural lands were given a greater level of protection with a more comprehensive regional governance approach. The 2005 version of the PPS directed those prime agricultural areas be protected for long-term agriculture with certain exceptions for settlement boundary expansions, mineral and petroleum resource extraction, and limited non-residential uses given there are no suitable alternative locations. The 2005 version of the PPS also included the concept of specialty crop areas, mandating planning authorities to designate these areas and giving them the highest priority for protection. In 2014, the Government of Ontario updated the PPS to provide further guidelines for identifying, designating, and protecting prime agricultural land within Official Plans. The province also introduced stricter policies for settlement area expansions into prime agricultural areas. These updates mandated that in addition to the policies outlined in earlier PPS documents, identification and expansion of settlement areas may only occur at the time of a Municipal Comprehensive Review (MCR).
In addition to the changes to the PPS, the Greenbelt Act, established in 2005, provided a legislative foundation to create a 7,200 km2 permanently protected “greenbelt area” in the Greater Golden Horseshoe and gave agricultural land further protection. The Greenbelt Act established a Greenbelt Plan in June 2005, which the provincial government subsequently updated in 2017. This continuous and permanent land base secured by the Greenbelt intends to support long-term agricultural production in the Greater Golden Horseshoe area. According to the Greenbelt Act, the Greenbelt Plan prevails, and local Official Plans and zoning by-laws within the protected countryside must be amended to conform with the Greenbelt Plan. Prime agricultural lands were given the following protection by the Greenbelt Plan (MMAH, 2017b):
“Prime agricultural land in the ‘protected countryside' will be protected ‘by preventing further fragmentation and loss of the agricultural land base caused by lot creation and the re-designation of prime agricultural areas; (section 1 (c)).”
Any municipality with land designated “protected countryside” by the Greenbelt Plan was required to identify such areas within their Official Plan. Agricultural land outside of the jurisdiction of the Greenbelt Plan would be designated as agricultural, but land-use protections would vary (reflecting the PPS or other provincial plans). An exception was provided through Policy 3.4.4. for settlement area expansion proposals that had been initiated prior to the implementation of the Greenbelt Plan. In these cases, settlement area expansions may be permitted into prime agricultural areas (MMAH, 2005a).
Two other provincial plans should be noted as they may have overlapping boundaries within the Greenbelt Plan area: the Oak Ridges Moraine Conservation Plan (ORMCP) (MMAH, 2017a) and the Niagara Escarpment Plan (NEP) (Ontario Ministry of Northern Development, Mines and Natural Resources and Forestry, 2017). The ORMCP and NEP tend to be focused on significant ecological and environmental features. In this context, the differing plans need to be interpreted for consistency where they overlap, as natural heritage protection can potentially conflict with agricultural viability.
Apart from the conservation plans noted above, the Places to Grow Act (2005a) and the Growth Plan for the Greater Golden Horseshoe (established in 2006 and updated in 2017; hereby referred to as the “Growth Plan”) also indirectly support agricultural land protection by regulating urban boundary expansion, setting urban intensification targets, and encouraging more compact and mixed-use development (Table 1).
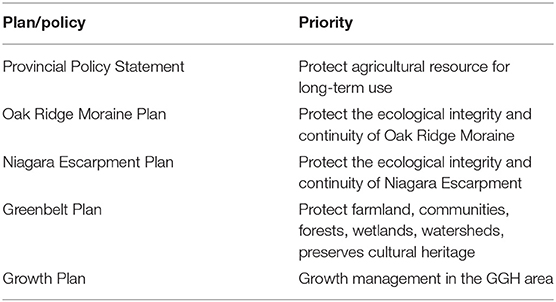
Table 1. Policies relevant to agricultural land protection in Ontario.
Study Area
This research covers 36 municipalities across southern Ontario (Figure 1) and the following analysis divides them into three geographic regions, including Central Ontario, Southwestern Ontario, and Southeastern Ontario.
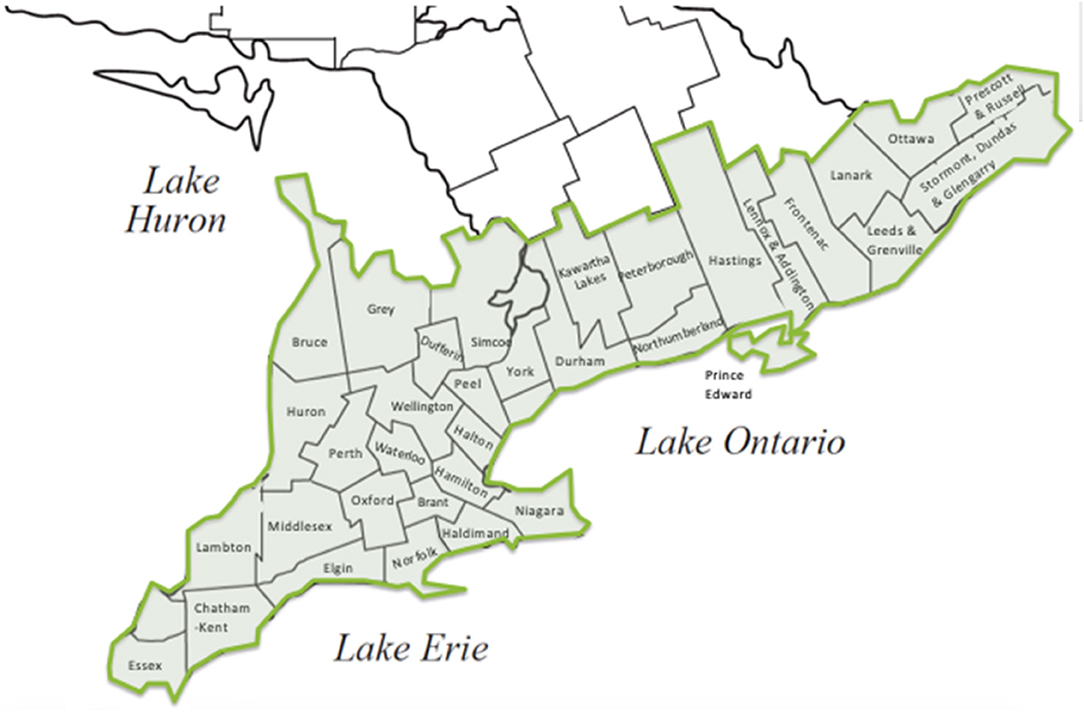
Figure 1. Map of the Southern Ontario.
The Central Ontario boundaries were selected in accordance with the Greater Golden Horseshoe. There were 15 municipalities in this area, including Dufferin, Durham, Niagara, Haldimand, Brant, Hamilton, Halton, Waterloo, Wellington, Peel, York, Simcoe, Kawartha Lakes, Peterborough, and Northumberland.1. This Central region reported 1,472,687 hectares of census farmland in 2016, 29.5% of the provincial total. Municipalities in this region are further divided into two groups, an “Inner Ring” and “Outer Ring,” according to where they are located around the Greenbelt; a provincially protected area comprised of prime agricultural land and environmentally sensitive landscapes.
The “Inner Ring” area covers the municipalities closest to the City of Toronto, including the Regions of Durham, York, Peel, Halton, Niagara, and the City of Hamilton. This area is the most populated metropolitan area in southern Ontario and is under the greatest pressure from urban expansion. It contains 28.8% of the total census farmland in Central Ontario. The “Outer Ring” area refers to municipalities further removed from Toronto, including the Counties/Cities of Dufferin, Haldimand, Brant, Waterloo, Wellington, Simcoe, Kawartha Lakes, Peterborough, and Northumberland. This area includes 72.2% of the census farmland area in Central Ontario.
Most of the municipalities in this region are rural areas with a varied landscape of small and mid-sized cities, towns, villages, and hamlets. Southwestern Ontario comprises 11 municipalities, including Grey, Bruce, Huron, Perth, Oxford, Norfolk, Middlesex, Elgin, Lambton, Chatham-Kent, and Essex. The 2016 Canadian Census of Agriculture reported 2,135,538 hectares of census farmland in this region, 42.7% of the province's total census farm area. The Southeastern Ontario area covers ten municipalities, including Hastings, Prince Edward, Lennox and Addington, Frontenac, Renfrew, Lanark, Leeds and Grenville, Ottawa, Stormont, Dundas and Glengarry, and Prescott and Russell. The total census farm area was 1,014,968 hectares in 2016, which is 20.3% of the provincial census area of farms.
Methodology
This next section will outline, in detail, the methodological framework undertaken inclusive of secondary data collection and analysis procedures, as well as the approach of the methodology adopted and its contributions to the fields of agricultural land-use planning (and preservation) and more specifically, plan evaluation.
The Canadian Census of Agriculture is the primary data source for measuring farmland availability in this research context. The Canadian Census of Agriculture, facilitated at the federal level by Statistics Canada, is conducted every 5 years to collect data related to physical, economic, social, and environmental characteristics of Canadian agricultural industries, farm operators, and farm operations (Statistics Canada, 2021). While the census provides an enumeration of agricultural land in production at different geographic levels, it does not reflect local land-use planning decisions compromising the long-term preservation of these lands, nor does it distinguish between other classes of agricultural land productivity (i.e., prime vs. non-prime). When farmland is redesignated to non-agricultural land uses, on-site farming activities may continue, but these lands are eventually destined for conversion to non-farm uses (Epp and Caldwell, 2018). The census only tracks changes to land production; farms that have been redesignated for urban development but continue agricultural production would be counted in the census regardless of the land-use designation. The census would not capture farmland availability and, potentially, farmland under threat of development. As a result, the use of OPAs would provide a more accurate and valid measure of farmland availability.
This article tracks land-use planning decisions that convert agricultural land to other uses. Municipal OPAs were used as the primary data source to track farmland conversions. These amendments reflect a marked decision to permit the land to be used for an alternative, often development-driven purpose. This methodology responds to the gaps in quality data (specifically the census), documenting the change in farmland availability and the current impacts of non-farm and urban development contributing to long-term trends of farmland conversion. The resulting data provides insight into land-use changes as they occur before development and ultimately assesses the effectiveness of existing policy planning tools in their ability to preserve agricultural lands for the long term in Ontario. Overall, the method is valuable for evaluating policy effectiveness in real-time, in contrast to waiting for census results accounting for the loss of farmland after it has already occurred.
OPAs provide a consistent, valid, reliable, and publicly available source of data that can be used to track the conversion of prime agricultural land in Ontario reliably and at individual municipal levels, given as they are required by all municipalities when altering land-use designations [Drake, 2019; MMAH, 2021]. In adopting the following methodological process, this article quantifies the Greenbelt Plan's (MMAH, 2005b) effect and measures farmland loss in individual municipal plans in a given timeframe (2000–2017). This methodology has value applied to contexts in Canada and elsewhere, particularly municipal governments responsible for land-use planning, policy implementation, and decision-making. Measuring approvals at this level can help describe prominent regional trends, successes, and failures in managing growth.
The methodological process includes location analysis, boundary identification, and data collection. The first step was to determine where prime agricultural land existed in Ontario to determine the focus areas for the study. Information was drawn from various sources including the Ontario Ministry of Agriculture, Food and Rural Affairs' Agricultural Information Atlas soil capability for agricultural mapping layer.2 Thirty-six counties and regions with prime agricultural land were identified. The Official Plans of these selected municipalities were reviewed to determine what designations applied to prime agricultural land and any distinction between prime and non-prime agricultural land areas. Researchers collected the data in partnership with municipalities or independently through online databases. As a governance mechanism that mandates reporting, OPAs exist and are publicly available as prescribed by ministerial regulation under the Planning Act (1990), which outlines legislative requirements for the land-use planning process and decision-making in Ontario. As a result, OPAs are a mechanism and application required when a proposed use or development conflicts with a municipal Official Plan and requires an amendment to ensure plan conformity, which is subject to a public hearing process and is approved at the discretion of the municipal council. The primary data collected for this study is taken directly from OPAs approved at the upper-tier (i.e., region or county) level during the study's timeframe. Where available, secondary data including information from the accompanying planner's report, initial OPA application forms, archived municipal council minutes, and Ontario Municipal Board (OMB) case decisions were also used. Additional information collected included: application date, adoption date, OPA purpose, previous land-use designation, new land-use designation, special policy (if applicable), impacted area in hectares, lot and concession plan, other location identifiers and, if applicable, OMB appeals.
Applicable OPAs were categorized into three themes to illustrate and quantify the scales and community development patterns contributing to farmland loss. These categories represent the nature of the amendment. Redesignations to development tended to lead to direct urban expansion (often large-scale farmland conversion); redesignations to rural tended to occur on areas of lesser quality farmland, and the uses tended to be more “rural” (relating to villages and or hamlets). Lastly, site-specific policy amendments tended to be used where the land was still designated as “agriculture.” Still, the actual uses, while extensive, were not agricultural (e.g., an automotive speedway on an agricultural parcel). Applicable OPAs were organized into three categories:
1) Prime agricultural areas redesignated to a development designation;
2) Prime agricultural areas redesignated to a rural designation; and
3) Land designated as a prime agricultural area with a site-specific policy amendment to allow additional uses.3
These categories and examples of their respective development designations converted from prime agricultural areas are described in further detail in Table 2.
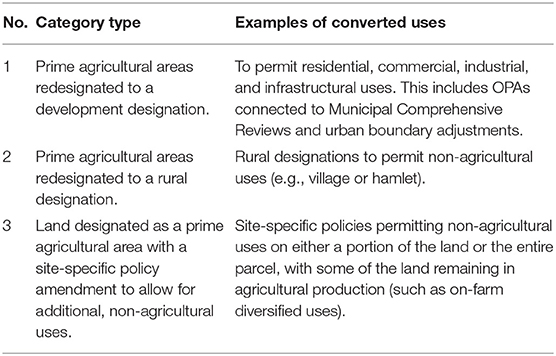
Table 2. Categorization of OPAs in the research study.
Farmland Loss Between 2000 and 2017
This next section will outline research results, including various trends relative to farmland loss from 2000 to 2017. First, it will outline trends of farmland loss at a provincial level, followed by region-specific trends related to Central Ontario, Southwestern Ontario, and Southeastern Ontario.
Trends of Farmland Loss at the Provincial Level
Between 2000 and 2017, 545 OPAs were approved to convert prime agricultural land to non-agricultural designations or to permit non-agricultural uses in southern Ontario. In total, these amendments affected 29,217 hectares of designated prime agricultural land. The most prime agricultural land loss occurred in Central Ontario, representing 83.5% of the provincial total (24,404 ha). Comparatively, Central Ontario also experienced the highest population growth4. during the past two decades. Southwestern Ontario, which has the greatest farmland area among the three regions, captured 12.1% of the total prime agricultural land loss (3,541 ha). Southeastern Ontario saw the smallest amount of farmland loss among the three areas, with 4.4% of the total captured amount (1,272 ha).
Most prime agricultural land loss identified in this research is captured in the category of “prime agricultural areas redesignated to a development designation,” (76%) resulting from large-scale urban boundary expansions, followed by redesignation to rural uses (14%), and site-specific policies allowing for non-agricultural uses (12%) (see Chart 1).
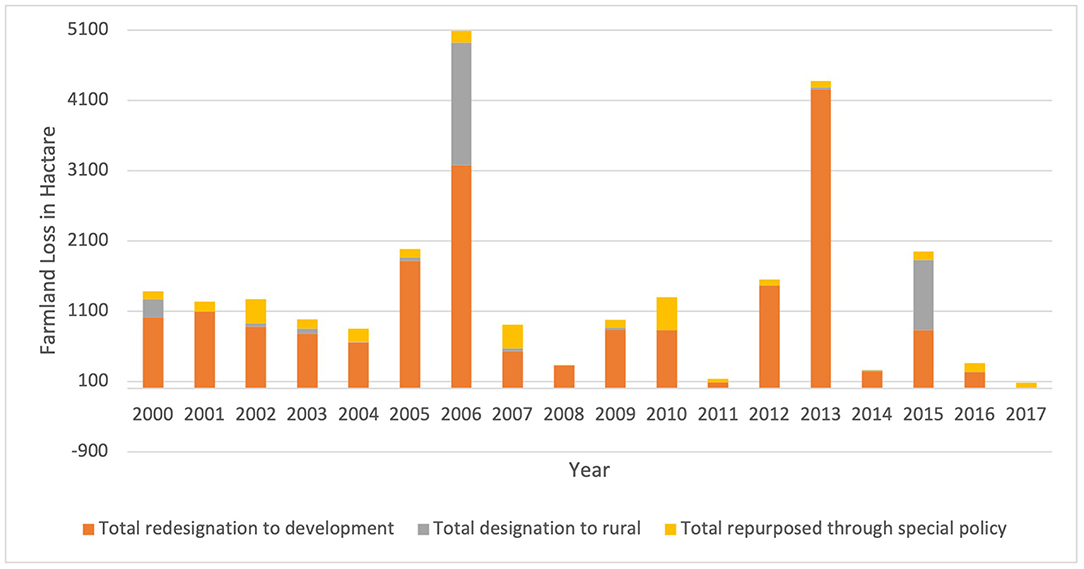
Chart 1. Yearly prime agricultural land loss divided by category in Southern Ontario, 2000–2017.
The years of 2006, 2013 and 2015 saw the highest amount of prime agricultural land loss due to urban boundary expansion OPAs in the GGH area (Chart 2). The most increased annual occurrence of prime agricultural land loss transpired in 2006, with 5,325 hectares of designated prime agricultural land converted. This loss was mainly accounted for by York Region (1,696 ha) and Peel Region (2,428 ha). Another peak of farmland loss was in 2013, which lost 4,388 hectares of prime agricultural land, mainly in Halton Region (2,656 ha) Durham Region (1,562 ha). Similarly, 2015 had the third-highest annual loss of prime agricultural lands, consisting of 1,966 hectares, mainly in York Region (1,000 ha) and Peterborough (688 ha). Most of these large-scale OPAs were part of local MCRs.
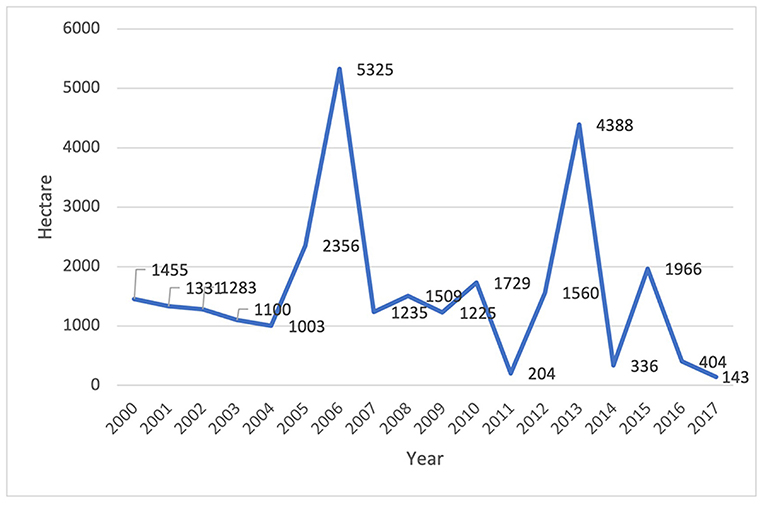
Chart 2. Agricultural land loss across Southern Ontario by year, 2000–2017.
In a 5-year incremental timeline (Figure 2), the period between 2000 and 2004 (before the establishment of provincial policies) saw a total of 6,172 hectares of prime agricultural land lost, including that in Central Ontario (5,573 ha), Southwestern Ontario (522 ha), and Southeastern Ontario (77 ha).
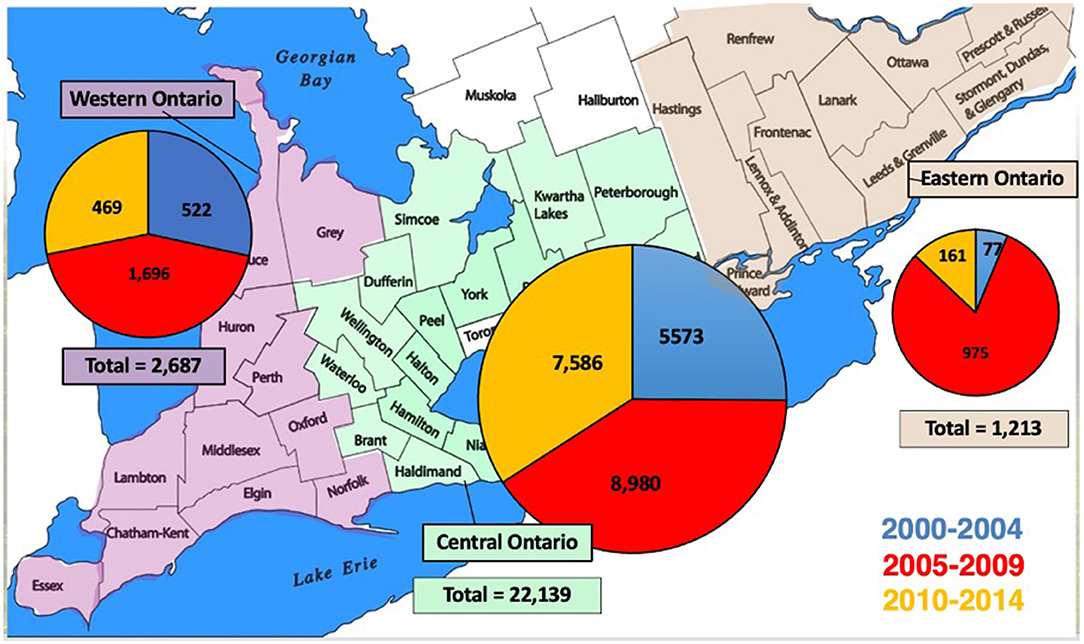
Figure 2. Regional total prime agricultural land loss in 5-year increments in Southern Ontario, 2000–2014.
The period between 2005 and 2009 experienced the greatest amount (11,651 ha) of prime agricultural land loss in all three regions: Central Ontario (8,980 ha), Southwestern Ontario (1,696 ha), and Southeastern Ontario (975 ha). It is important to note that this increase of farmland loss is not “caused” by the 2005 provincial policies, but rather that the extent of farmland loss in this phase is a consequence of applications approved before the Provincial Policy Statement and the Greenbelt Plan came into effect.
The period between 2010 and 2014 better reflects the effect of the 2005 provincial policies, as most of the OPAs approved in this phase were subjected to provincial policies' regulation after 2005. All three regions experienced an apparent decline in prime agricultural land loss from 2010 to 2014 (total of 8,216 ha) relative to the farmland lost from 2005 to 2009.
Central Ontario
The Central Ontario region, or the Greater Golden Horseshoe area, is the most urbanized and fastest-developing area. Currently, Central Ontario is under the directive regulation of the Growth Plan and the Greenbelt Plan, with over 90% of the Greenbelt Plan area and 25 urban growth centers identified in the Growth Plan located within its boundary.
Between 2000 and 2017, Central Ontario captured 83.5% of the total prime agricultural land loss identified in this article and 1.7% of the census farmland area. The three counties/regions which have experienced the highest percentage of prime agricultural land loss are all in the Greater Toronto Area (GTA), including York, Peel, and Halton (Table 3).
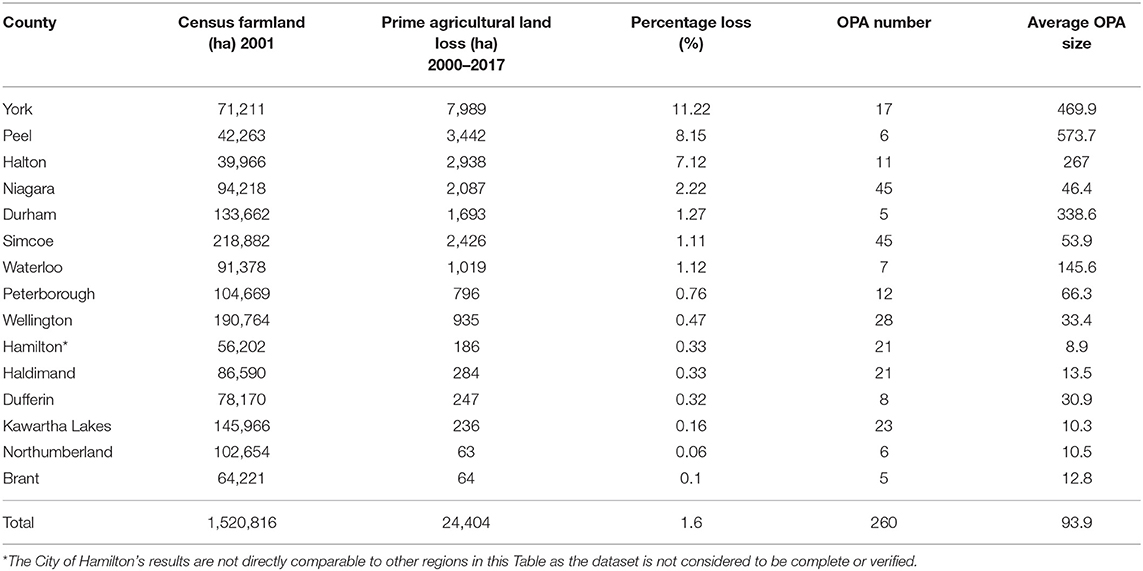
Table 3. Prime agricultural land loss in central Ontario.
This article found an overall downward trend in the number of approved OPAs relevant to prime agricultural land loss in Central Ontario from 2000 to 2017 (Chart 3). The number of OPAs and their average size demonstrate three different patterns of farmland loss in this region. First is that the most populated GTA municipalities have comparatively fewer OPA numbers and larger average sizes (>200 ha). The fast-developing Outer Ring population centers have comparatively medium OPA numbers and average OPA size (30–60 ha). The other rural Outer Ring counties have a relatively small average OPA size, and they vary in the total number of OPAs.
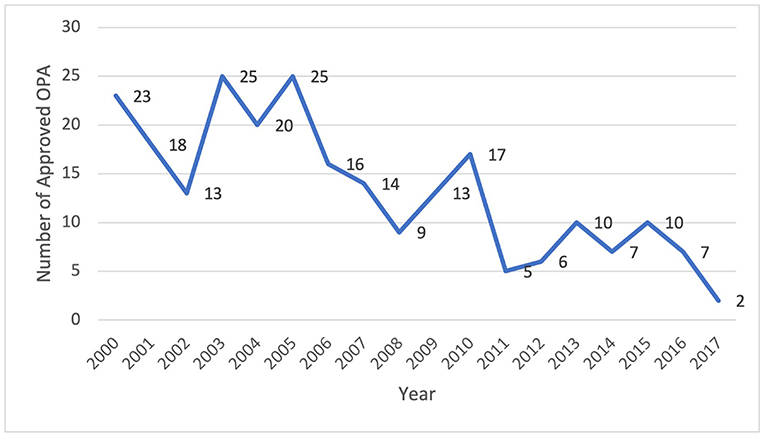
Chart 3. Number of yearly approved OPAs in Central Ontario.
Most OPAs redesignating prime agricultural land to non-agricultural land uses resulted from MCRs (72%), namely to expand urban boundaries or redesignate farmland for comprehensive urban uses (Table 4). Additional purposes for OPAs resulting in farmland loss (Table 4) include redesignations to employment lands (10%), recreational, residential, and municipal infrastructural (4%), and other uses, including industrial, commercial, and institutional (5–6%).
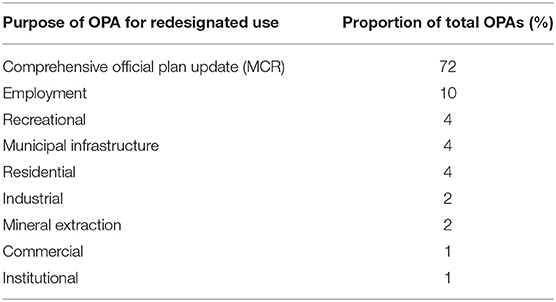
Table 4. Area of official plan amendments categorized by purpose and proportion of total OPAs (%).
Between 2000 and 2017, most of the farmland loss occurred in the Inner Ring area (337 ha lost), accounting for 75% of the total lost farmland in Central Ontario (Table 5). Land redesignated for development totaled 13,860 hectares within the Inner Ring (3,052 ha for rural purposes and 1,426 for site-specific non-agricultural uses). During this period, the Outer Ring lost 6,072 hectares. The number of OPAs in the Outer Ring is 50% higher than the Inner Ring; however, the average OPA size is distinctly less (38.9 ha) than the Inner Ring (176.3 ha). Table 5 illustrates these trends in further detail.
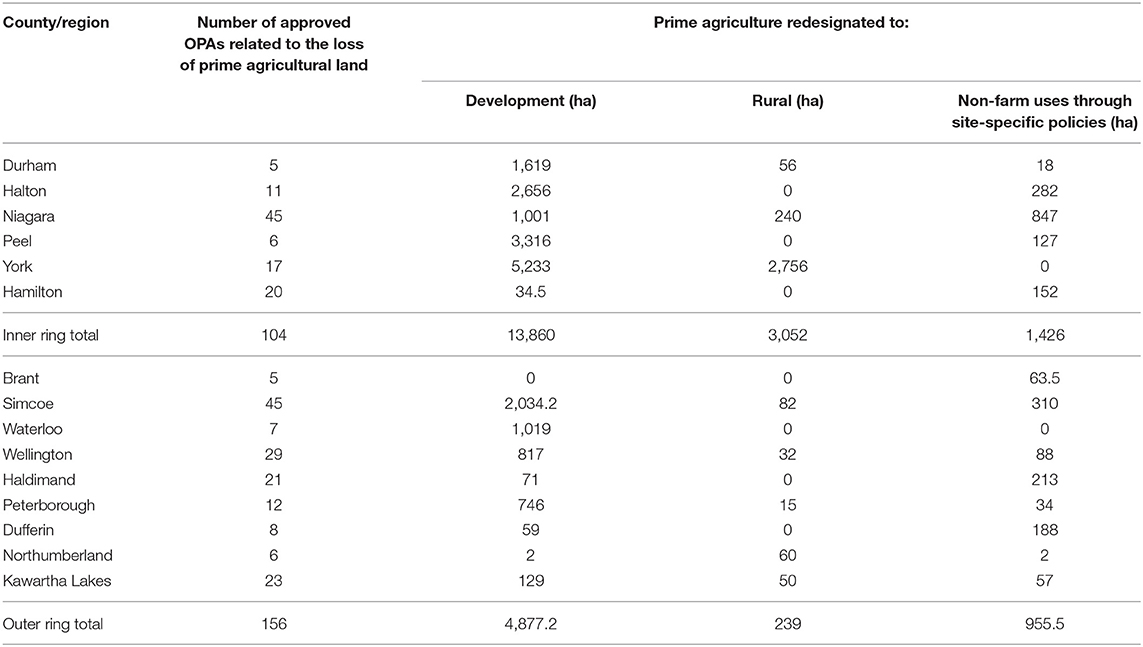
Table 5. Redesignations in the inner ring of the Greenbelt, 2000–2017.
Southwestern Ontario
Southwestern Ontario is a traditionally agricultural region with the greatest provincial share of farmland. The Growth Plan does not apply here, and only a small part of Grey and Bruce Counties falls under the protection of the Greenbelt Plan. There are three major population centers in this region (London, Windsor, and Sarnia); however, urban development in this region has been relatively limited over the past decade. Between 2000 and 2017, this region saw 3,541 hectares of prime agricultural land converted to non-farm uses, representing 12% of the total farmland loss in this research (Table 6). The total number of relevant OPAs captured in Southwestern Ontario is 246 and accounts for 45% of the total number of captured OPAs in this project. This makes the average OPA size 14.9 hectares, 27.8% of the provincial average—the smallest among the three regions.
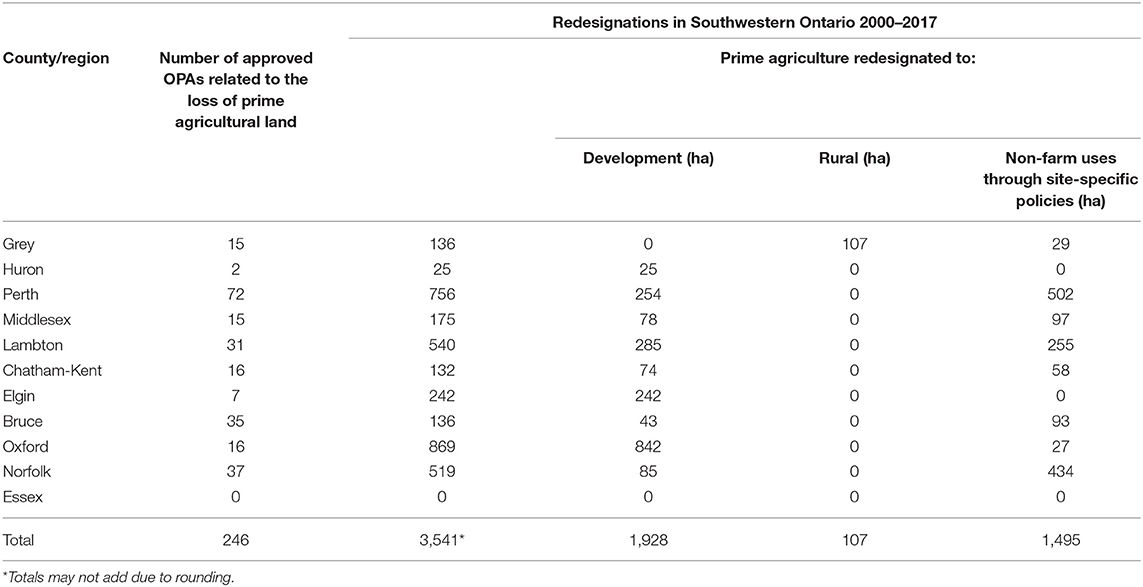
Table 6. Redesignations in Southwestern Ontario, 2000–2017.
Most cases for farmland conversion in Southwestern Ontario were small-scale applications intended to create small lots on existing agricultural land, allowing for non-agricultural uses, such as commercial, recreational, residential, and agricultural-related facilities. The “rural” designation does not exist in most local municipalities' Official Plans within Southwestern Ontario. As a result, most of the farmland losses were captured under the categories of “redesignation for development use” or “non-farm use through site-specific policies” (Table 6).
In Southwestern Ontario, there was no obvious upward or downward trend regarding the annual loss of prime agricultural lands and approved numbers of OPAs (Charts 4A,B). The years 2008 and 2017 saw the most approved OPAs with 20 each and most farmland loss occurring in 2008. Relative to the rest of the province, particularly Central Ontario, the rates of urban development have been more limited within Southwestern Ontario. This finding is unsurprising given that Southwestern Ontario has the highest provincial share of productive farmland and a competitive and prosperous regional agricultural industry. Given these regional characteristics, these trends may illustrate the lesser development pressures contributing to farmland loss relative to the more rapidly urbanizing and populated Central Ontario.
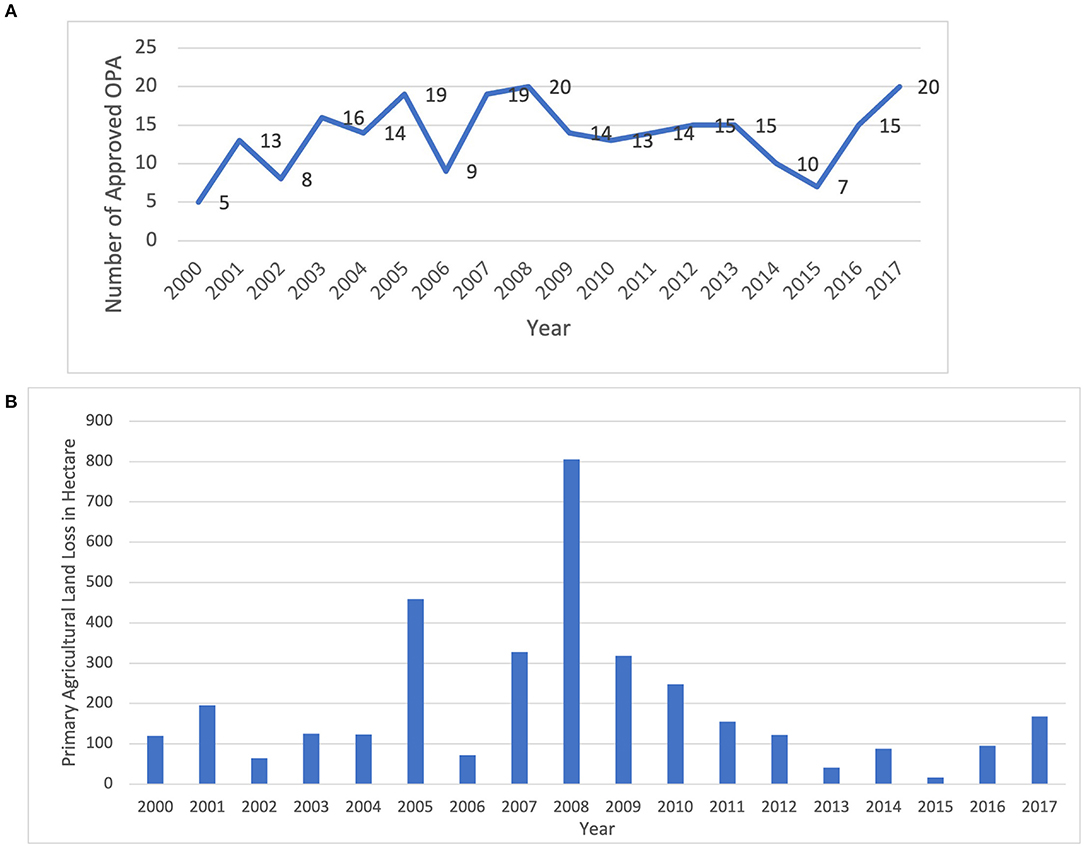
Chart 4. (A) Number of yearly approved OPA in Southwestern Ontario. (B) Yearly primary agricultural land loss in Southwestern Ontario.
Southeastern Ontario
The Southeastern region of Ontario has the lowest proportion of census farms and prime agricultural land (Table 7). Bedrock geology characterizes a large proportion of this area. Consequently, this area has the lowest capability of agricultural soils and, in turn, the lowest amount of prime agricultural land loss. Between 2000 and 2017, 1,272 hectares of prime agricultural land were redesignated to non-farm uses, representing ~5% of the total captured prime agricultural land loss in this project. The average OPA size in this region is 32.6 hectares, 60.8% of the provincial average.
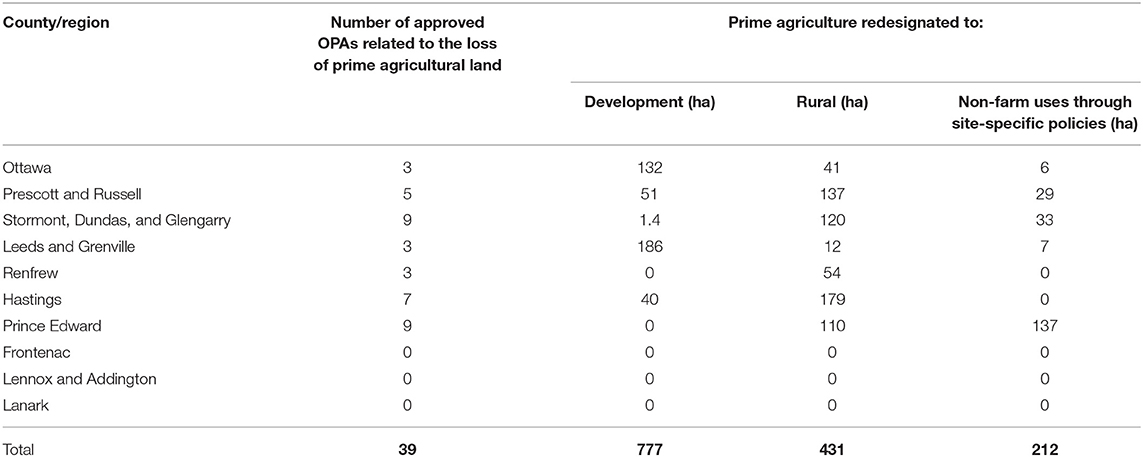
Table 7. Redesignations in Southeastern Ontario, 2000–2017.
The Southeastern region had the lowest number of relevant OPAs among the three areas within the study period, with each county reporting <10 relevant OPAs (Chart 5A). Like Southwestern Ontario, there is no obvious upward or downward trend regarding annual prime agricultural land loss. The most OPAs approved, and the highest amount of primary agricultural land loss were in 2008 when 8 OPAs converted 394 hectares of prime agricultural lands (Chart 5B). Proportions of OPAs contributing to this total land loss include development redesignations (54.7%), rural redesignations (30.4%) and site-specific policies (14.9%) primarily (see Table 7).
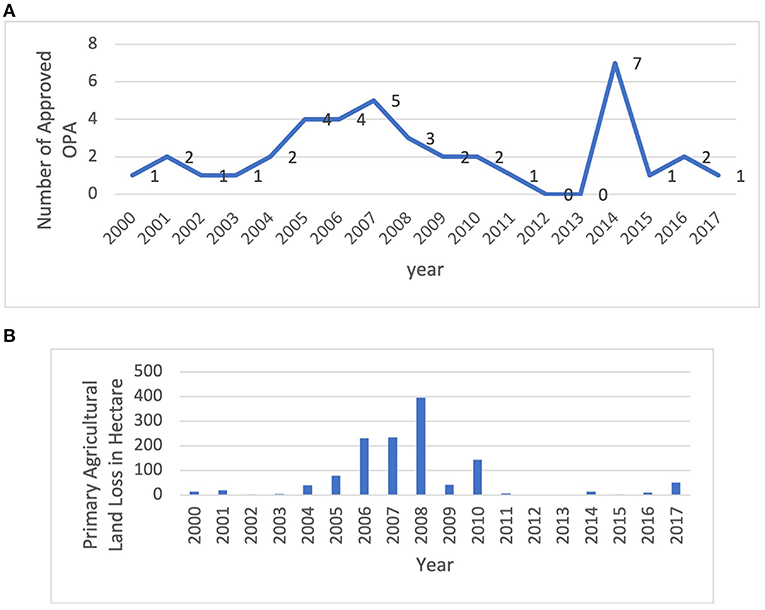
Chart 5. (A) Number of yearly approved OPA in Southeastern Ontario. (B) Yearly primary agricultural land loss in Southeastern Ontario.
Discussion: the Strength of Provincial Farmland Protection Policies
In tracking agricultural land conversion through regional and local OPA decisions, this article indicates patterns of future farmland loss in Ontario and the effectiveness of agricultural land preservation policies in real-time. Our analysis presents that 545 OPAs were approved, converting 29,217 hectares of prime agricultural land in southern Ontario from 2000 to 2017. While rates and nature of farmland loss vary regionally across the study area, large-scale farmland conversion caused by urban boundary expansion dominated Central Ontario, the region with the most significant population growth. Also, it accounted for the highest amount of farmland loss. In terms of the area lost, Southwestern and Southeastern Ontario accounted for the following highest levels of farmland loss during this period, respectively, due to an accumulation of permissions for site-specific uses. The highest peaks of farmland loss were accounted for in 2006, 2013, and 2015 as part of local MCRs and large-scale urban boundary expansions, reiterating the threats urban sprawl imposes on farmland loss. However, while most farmland loss results from large-scale urban boundary expansions, the cumulative effects of farmland loss resulting from rural designations and site-specific policy amendments on individual parcels should not be underestimated. Results in this study evidence a general decline in farmland loss in 2010–2014 relative to the 2000–2004 and 2005–2009 periods, before the establishment of provincial farmland preservation policies in 2005.
Overall, this article (Table 8) demonstrates that the establishment of several provincial policy initiatives in 2005, including the revised Provincial Policy Statement, the Growth Plan, and the Greenbelt Plan, has successfully minimized the rates of farmland loss and protected prime agricultural lands. For example, the Growth Plan establishes density and intensity requirements that several urban centers and regions outside of the Greenbelt (not subjected to Greenbelt Plan policies) need to adopt and implement into their Official Plans. While not prohibiting development in prime agricultural areas directly, these growth management policies facilitate the densification and intensification of urban areas and the mitigation of urban sprawl—highlighting the “other side of the coin” to farmland protection in land-use planning. Overall, these policies establish a framework that consistently contributes to enhanced municipal control over agricultural land conversion in southern Ontario.
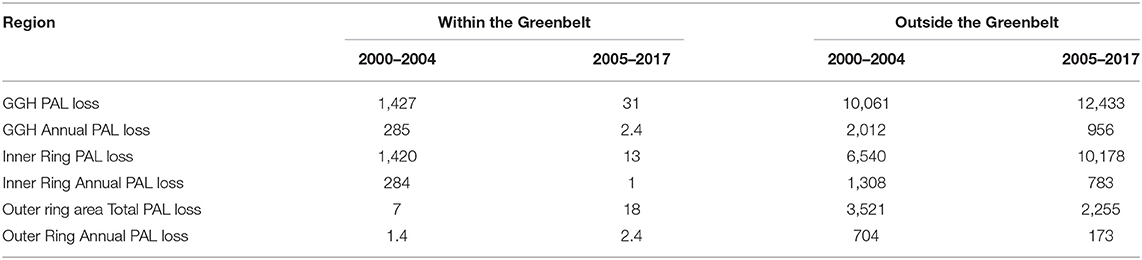
Table 8. Prime agricultural land conversion in GGH 2005–2017.
The Inner Ring municipalities have played increasingly active roles in agricultural land protection with both planning approaches and local initiatives. The Outer Ring municipalities have seen increasing urbanization pressure. Data on farmland loss showed a mixed landscape of large-scale municipality-led urban boundary expansions and small-scale individual applications on policy changes to allow for non-agricultural uses. Southwestern Ontario has experienced limited urbanization during the past two decades, and this research did not detect an obvious upward or downward trend of farmland loss in these areas. Most of the farmland conversion cases in this area were small-scale applications to create small lots on existing agricultural land to allow non-agricultural uses such as commercial, recreational, residential, and agricultural-related facilities. Southeastern Ontario has the smallest provincial share of prime agricultural land and has seen minimal farmland loss since 2000. Most of which were small-scale individual application on land-use redesignations (partially reflecting reduced acreages of prime farmland). The provincial policy impact on farmland preservation is not as obvious in this geography.
The connection between minimized rates farmland loss and provincial farmland protection policies is particularly evident within Ontario's Greater Golden Horseshoe, particularly within the Inner Ring, also the Greenbelt Plan Area. During the initial implementation of the Greenbelt Plan in 2005, there was much scrutiny (and doubt) within Ontario from several stakeholders over the perceived efficacy of the policy (Hume, 2010). For example, anecdotal accounts share how farms in the Greenbelt's “protected countryside” were subject to development after the initial onset of the Greenbelt in 2005—signaling a perceivable policy failure amongst Ontario communities (Epp and Caldwell, 2018). However, as noted in our article, quantifiable evidence illustrates this is not the case. These agricultural parcels were “lost” to development at the time of the planning decision, which would have occurred before the implementation of Greenbelt policies. For instance, before establishing the Greenbelt Plan, there were 1,427 hectares of prime agricultural land redesignated across the Greater Golden Horseshoe between 2000 and 2004 within the current Greenbelt boundary. Approximately 1,420 hectares of the converted farmland were located in the Inner Ring area, and only 7 hectares of farmland were converted in the Outer Ring area. The annual average farmland loss in the Inner Ring area was 284 hectares. Since the Province of Ontario enacted the Greenbelt Plan, the total farmland loss in the Inner Ring area within the Greenbelt boundary dropped to 13 hectares during 2005–2017, making the annual average loss only 1 hectare. There were only three OPAs approved since the establishment of the Greenbelt, which affected prime agricultural land within the Greenbelt boundary. This article shines a light on the success of the Greenbelt Plan, evidencing the effect of the Greenbelt policies on farmland protection when comparing communities with high development pressure to those outside of the protected countryside. Moreover, these findings reiterate the lessons from other Greenbelt policy areas in the world to illustrate the critical and pivotal role policy plays in mobilizing sustainability and farmland protection within policy-protected areas (Carter-Whitney, 2008).
Concerning the success of other farmland protection policies, our analysis suggests that for those areas outside of the Greenbelt and Growth Plan areas, the agriculture policies of the Provincial Policy Statement have performed reasonably well in protecting prime agricultural lands. For example, outside of the Greenbelt, there has been an overall declining rate of farmland loss across the Greater Golden Horseshoe since 2005. Annual farmland loss outside the Greenbelt has dropped by almost 50%. Both the Inner Ring area and the Outer Ring have seen a decline in yearly farmland loss. The average of the Inner Ring's annual farmland loss dropped by 40%, whereas the average of the Outer Ring's annual farmland loss dropped by 75%. This is evident in regions such as southwestern and Southeastern Ontario, where only one policy layer (the PPS) is applied and implemented to protect prime agricultural lands at the municipal level, and trends of farmland loss are relatively low or consistent throughout 2000–2017. This is relative to areas subject to multiple layers of farmland protection policy, however, such as Central Ontario, which is experiencing consistent development pressure (i.e., the highest amount of farmland loss, urbanization, and population growth) and why we bring focus to this policy area in our discussion. Overall, the provincial-wide analysis of farmland loss has provided a way to evaluate whether more robust policy instruments are needed elsewhere in the province beyond the Greenbelt area.
Conclusions
This article reviewed southern Ontario's farmland preservation and urban expansion policies and evaluated their effectiveness with quantitative data. By tracking the agricultural land conversion through local Official Plan Amendments, this study documented farmland loss across Ontario between 2000 and 2017. Provincial policies and local municipalities' role in preserving farmland in different geographic regions were analyzed.
At a provincial level, data from 36 counties/regions shows that the provincial policies and local planning framework have perceivably worked in tandem to affect the agricultural land base in southern Ontario significantly. At a regional level, however, this study reveals that the loss of prime agricultural lands and resulting policy implications are focused within Central, rather than Southwestern or Southeastern, Ontario. In Central Ontario, which is the most urbanized area in Ontario, the Province's Greenbelt Plan has significantly reduced the rates of farmland loss within this geographic range since 2005. Elsewhere within the province, the Provincial Policy Statement and the Growth Plan, for example, establish requirements that municipalities are expected to adopt and implement into local Official Plans, which protect farmland in different ways.
This research has introduced a planning-based methodology to track the availability of agricultural land and has documented the farmland conversion at regional and municipal levels. Measuring approvals at this level can help describe prominent regional trends, successes, and failures in helping to guide growth as it occurs in real-time. This methodology has potential broader applicability in Canada and elsewhere, where land-use decisions primarily involve municipal governments. Moreover, the data in this research has provided a baseline for future farmland availability research, and has created a framework for further policy, agricultural, economic, and planning research.
Data Availability Statement
The datasets presented in this study can be found in online repositories. The names of the repository/repositories and accession number(s) can be found at: http://www.waynecaldwell.ca/projects/.
Author Contributions
All authors listed have made a substantial, direct, and intellectual contribution to the work and approved it for publication.
Funding
This research was made possible through funding support from the Ontario Ministry of Agriculture, Food and Rural Affairs.
Conflict of Interest
The authors declare that the research was conducted in the absence of any commercial or financial relationships that could be construed as a potential conflict of interest.
Publisher's Note
All claims expressed in this article are solely those of the authors and do not necessarily represent those of their affiliated organizations, or those of the publisher, the editors and the reviewers. Any product that may be evaluated in this article, or claim that may be made by its manufacturer, is not guaranteed or endorsed by the publisher.
Footnotes
1. ^The City of Toronto is excluded from this project because no significant undeveloped prime agricultural land is in its jurisdictional boundary.
2. ^http://www.omafra.gov.on.ca/english/landuse/gis/portal.htm
3. ^Some types of OPAs were not included in this study. Certain classes of “housekeeping amendments” were excluded, as were OPAs relating to wind turbines and aggregate operations, as they were not considered a permanent land-use conversion in the existing planning system. The timeframe for this study covers 2000–2017. Much of the data pivots around 2005 when revised provincial policy and new legislation were adopted. It, therefore, provides comparative data to assess the strength of these policies.
4. ^https://www150.statcan.gc.ca/n1/daily-quotidien/200213/dq200213a-eng.htm
References
Agriculture Agri-Food Canada (2019). Departmental Results Report. Available online at: https://www.agr.gc.ca/resources/prod/doc/pdf/drr-rrm_2018-19_v2-eng.pdf (accessed January 24, 2022).
Allen, R., Campsie, P., and Neptis Foundation (2015). Implementing the Growth Plan for the Greater Golden Horseshoe: Has the Strategic Regional Vision Been Compromised? Available online at: https://www.deslibris.ca/ID/246692 (accessed January 24, 2022).
Barnosky, A. D., Matzke, N., Tomiya, S., Wogan, G. O. U., Swartz, B., Quental, T. B., et al. (2011). Has the Earth's sixth mass extinction already arrived? Nature 471, 51–57. doi: 10.1038/nature09678
Barral, M. P., Rey Benayas, J. M., Meli, P., and Maceira, N. O. (2015). Quantifying the impacts of ecological restoration on biodiversity and ecosystem services in agroecosystems: a global meta-analysis. Agric. Ecosyst. Environ. 202, 223–231. doi: 10.1016/j.agee.2015.01.009
Benton, T. G., Bieg, C., Harwatt, H., Pudasaini, R., and Wellesley, L. (2021). Food System Impacts on Biodiversity Loss: Three Levers for Food System Transformation in Support of Nature (Energy, Environment, and Resources Program). Chatham House, 1–73. Available online at: https://www.chathamhouse.org/2021/02/food-system-impacts-biodiversity-loss (accessed January 24, 2022).
Bunce, M.. (1998). Thirty years of farmland preservation in north america: discourses and ideologies of a movement. J. Rural Stud. 14, 233–247. doi: 10.1016/S0743-0167(97)00035-1
Caldwell, Wayne, J., Hilts, S., and Wilton, B., (eds.). (2017). Farmland Preservation: Land for Future Generations, 2nd Edn. Winnipeg Manitoba: University of Manitoba Press.
Cameron, G., and Connell, D. (2021). Food sovereignty and farmland protection in the Municipal County of Antigonish, Nova Scotia. J. Agric. Food Syst. Commun. Dev. 10, 1–21. doi: 10.5304/jafscd.2021.104.005
Capmourteres, V., Adams, J., Berg, A., Fraser, E., Swanton, C., and Anand, M. (2018). Precision conservation meets precision agriculture: a case study from southern Ontario. Agric. Syst. 167, 176–185. doi: 10.1016/j.agsy.2018.09.011
Carter-Whitney, M.. (2008). Ontario's Greenbelt in an International Context: Comparing Ontario's Greenbelt to its Counterparts in Europe and North America. Toronto: Canadian Institute for Environmental Law and Policy.
Chen, J., Gao, J., Yuan, F., and Wei, Y. (2016). Spatial determinants of urban land expansion in globalizing Nanjing, China. Sustainability 8, 868. doi: 10.3390/su8090868
Chien, S.-S.. (2015). Local farmland loss and preservation in China—a perspective of quota territorialization. Land Use Policy 49, 65–74. doi: 10.1016/j.landusepol.2015.07.010
Connell, D. J.. (2020). Evaluating the strength of local legislative frameworks to protect farmland: city of richmond and metro Vancouver, British Columbia. J. Plann. Educ. Res. 1–15. doi: 10.1177/0739456X20943930
Drake, E.. (2019). The Leap-frog Effect in the Context of Ontario's Greenbelt: An Analysis of Farmland Loss in the Unprotected Countryside. University of Guelph. Available online at: http://hdl.handle.net/10214/15909 (accessed January 24, 2022).
Duan, X., Meng, Q., Fei, X., Lin, M., and Xiao, R. (2021). The impacts of farmland loss on regional food self-sufficiency in yangtze river delta urban agglomeration over last two decades. Remote Sens. 13, 3514. doi: 10.3390/rs13173514
Epp, S., and Caldwell, W. (2018). Measuring farmland loss: lessons from Ontario, Canada. WIT Trans. Ecol. Environ. 215, 165–175. doi: 10.2495/EID180151
Food and Agriculture Organization of the United Nations (FAO) (2021). The State of Food and Agriculture. Rome: FAO.
Government of Ontario (2007, April 17). News Release: Ontario Received Prestigious American Growth Planning Award. News.Ontario.Ca. Available online at: https://news.ontario.ca/en/release/86908/ontario-receives-prestigious-american-growth-planning-award (accessed January 24, 2022).
Government of Ontario (2022). Ontario Population Projections. Available online at: https://www.ontario.ca/page/ontario-population-projections (accessed January 24, 2022).
Hertel, T. W.. (2011). The global supply and demand for agricultural land in 2050: a perfect storm in the making? Am. J. Agric. Econ. 93, 259–275. doi: 10.1093/ajae/aaq189
Hu, Y., Kong, X., Zheng, J., Sun, J., Wang, L., and Min, M. (2018). Urban expansion and farmland loss in Beijing during 1980–2015. Sustainability 10, 3927. doi: 10.3390/su10113927
Hume, C.. (2010, February 28). Hume: Five years later, Greenbelt's something to celebrate. The Toronto Star. Available online at: https://www.thestar.com/news/gta/2010/02/28/hume_five_years_later_greenbelts_something_to_celebrate.html (accessed January 24, 2022).
Laurance, W. F., Sayer, J., and Cassman, K. G. (2014). Agricultural expansion and its impacts on tropical nature. Trends Ecol. Evol. 29, 107–116. doi: 10.1016/j.tree.2013.12.001
Liu, X., and Lynch, L. (2011). Do agricultural land preservation programs reduce farmland loss? Evidence from a propensity score matching estimator. Land Econ. 87, 183–201. doi: 10.3368/le.87.2.183
Macdonald, S., and Keil, R. (2012). The Ontario greenbelt: shifting the scales of the sustainability fix? Professional Geographer 64, 125–145. doi: 10.1080/00330124.2011.586874
Masson-Delmotte, V., Zhai, P., Pirani, A., Connors, S. L., Péan, C., Berger, S., et al. (2021). Climate Change 2021: The Physical Science Basis. Contribution of Working Group I to the Sixth Assessment Report of the Intergovernmental Panel on Climate Change. Cambridge: Cambridge University Press.
Miao, Y., Liu, J., and Wang, R. Y. (2021). Occupation of cultivated land for urban–rural expansion in China: evidence from National Land Survey 1996–2006. Land 10, 1378. doi: 10.3390/land10121378
Moroney, J. L., and Castellano, R. S. (2018). Farmland loss and concern in the Treasure Valley. Agric. Human Values 35, 529–536. doi: 10.1007/s10460-018-9847-7
Narducci, J., Quintas-Soriano, C., Castro, A., Som-Castellano, R., and Brandt, J. S. (2019). Implications of urban growth and farmland loss for ecosystem services in the western United States. Land Use Policy 86, 1–11. doi: 10.1016/j.landusepol.2019.04.029
Office of the Auditor General of Ontario (2021). Value for Money Audit: Land-Use Planning in the Greater Golden Horseshoe. Value-for-Money Audit, 76. Available online at: https://auditor.on.ca/en/content/annualreports/arreports/en21/AR_LandUse_en21.pdf (accessed January 24, 2022).
Ontario Ministry of Agriculture Food Rural Affairs (OMAFRA). (2017). Ontario Farm Data, Census of Agriculture, 1996, 2001, 2006, 2011 and 2016. Available online at: http://www.omafra.gov.on.ca/english/stats/census/summary.htm (accessed January 24, 2022).
Ontario Ministry of Municipal Affairs Housing (MMAH) (2005c). Provincial Policy Statement, 2005. Queen's Printer for Ontario. Available online at: http://www.mah.gov.on.ca/Page1485.aspx (accessed January 24, 2022).
Ontario Ministry of Municipal Affairs Housing (MMAH) (2014). Provincial Policy Statement, 2014. Queen's Printer for Ontario. Available online at: https://www.ontario.ca/document/provincial-policy-statement-2014 (accessed January 24, 2022).
Ontario Ministry of Municipal Affairs Housing (MMAH) (2021). Citizen's Guide to Land Use Planning: Official Plans. Available online at: https://www.ontario.ca/document/citizens-guide-land-use-planning/official-plans (accessed January 24, 2022).
Ontario Ministry of Municipal Affairs Housing (MMAH) (2005b). Greenbelt Plan. Available online at: https://www.yumpu.com/en/document/read/28889189/the-greenbelt-plan-2005-ministry-of-municipal-affairs-and-housing (accessed January 24, 2022).
Ontario Ministry of Municipal Affairs Housing (MMAH) (2017a). Oak Ridges Moraine Conservation Plan. Available online at: https://www.ontario.ca/page/oak-ridges-moraine-conservation-plan-2017 (accessed January 24, 2022).
Ontario Ministry of Municipal Affairs Housing (MMAH) (2017b). Greenbelt Plan. Available online at: https://www.ontario.ca/document/greenbelt-plan-2017 (accessed January 24, 2022).
Ontario Ministry of Municipal Affairs Housing (MMAH) (2005a). A Place to Grow: Growth Plan for the Greater Golden Horseshoe. Queen's Printer for Ontario. Available online at: https://www.ontario.ca/document/place-grow-growth-plan-greater-golden-horseshoe (accessed January 24, 2022).
Ontario Ministry of Northern Development Mines Natural Resources Forestry. (2017). Niagara Escarpment Plan. Queen's Printer for Ontario. Available online at: https://www.escarpment.org/LandPlanning/NEP (accessed January 24, 2022).
Perrin, C.. (2013). Regulation of farmland conversion on the urban fringe: from land-use planning to food strategies. Insight into two case studies in provence and Tuscany. Int. Plann. Stud. 18, 21–36. doi: 10.1080/13563475.2013.750943
Planning Act, R. S. O.. (1990). c. P.13. Available online at: https://www.ontario.ca/laws/statute/90p13 (accessed January 24, 2022).
Power, A. G.. (2010). Ecosystem services and agriculture: tradeoffs and synergies. Philos. Trans. R. Soc. B Biol. Sci. 365, 2959–2971. doi: 10.1098/rstb.2010.0143
Qiu, F., Laliberté, L., Swallow, B., and Jeffrey, S. (2015). Impacts of fragmentation and neighbor influences on farmland conversion: a case study of the Edmonton-Calgary Corridor, Canada. Land Use Policy 48, 482–494. doi: 10.1016/j.landusepol.2015.06.024
Robert, N., and Mullinix, K. (2018). Municipal policy enabling regional food systems in British Columbia, Canada: assessing focal areas and gaps. J. Agric. Food Syst. Commun. Dev. 115–132. doi: 10.5304/jafscd.2018.08B.003
Skog, K. L., and Steinnes, M. (2016). How do centrality, population growth and urban sprawl impact farmland conversion in Norway? Land Use Policy 59, 185–196. doi: 10.1016/j.landusepol.2016.08.035
Song, W., and Liu, M. (2017). Farmland conversion decreases regional and national land quality in China. Land Degr. Dev. 28, 459–471. doi: 10.1002/ldr.2518
Statistics Canada (2014). Snapshot of Canadian Agriculture. Available online at: https://www150.statcan.gc.ca/n1/ca-ra2006/articles/snapshot-portrait-eng.htm (accessed January 24, 2022).
Statistics Canada (2016). 2016 Census of Agriculture. Available online at: https://www150.statcan.gc.ca/n1/daily-quotidien/170510/dq170510a-eng.htm (accessed January 24, 2022).
Statistics Canada (2021). Census of Agriculture. Available online at: https://www.statcan.gc.ca/en/survey/agriculture/3438 (accessed January 24, 2022).
Tan, R., Beckmann, V., van den Berg, L., and Qu, F. (2009). Governing farmland conversion: comparing China with the Netherlands and Germany. Land Use Policy 26, 961–974. doi: 10.1016/j.landusepol.2008.11.009
Vinge, H.. (2018). Farmland conversion to fight climate change? Resource hierarchies, discursive power and ulterior motives in land use politics. J. Rural Stud. 64, 20–27. doi: 10.1016/j.jrurstud.2018.10.002
Walton, M.. (2003). Agriculture in the Central Ontario Zone, 38. Neptis Foundation. Available online at: https://neptis.org/publications/agriculture-central-zone (accessed January 24, 2022).
Xu, Z., Zhong, T., Scott, S., Tang, Y., Xu, G., and He, Q. (2019). Links between China's “virtual land use” and farmland loss. Can. J. Dev. Stud. Rev. Can. d'études Du Dév. 40, 29–47. doi: 10.1080/02255189.2018.1506912
Keywords: farmland loss, preservation, urban expansion, Greenbelt, land use policy, Ontario
Citation: Caldwell W, Epp S, Wan X, Singer R, Drake E and Sousa EC (2022) Farmland Preservation and Urban Expansion: Case Study of Southern Ontario, Canada. Front. Sustain. Food Syst. 6:777816. doi: 10.3389/fsufs.2022.777816
Received: 15 September 2021; Accepted: 27 January 2022;
Published: 18 February 2022.
Edited by:
Adam J. Calo, Radboud University, NetherlandsReviewed by:
Heidi Vinge, Institute for Rural and Regional Research (RURALIS), NorwayNaomi Beingessner, University of Manitoba, Canada
Copyright © 2022 Caldwell, Epp, Wan, Singer, Drake and Sousa. This is an open-access article distributed under the terms of the Creative Commons Attribution License (CC BY). The use, distribution or reproduction in other forums is permitted, provided the original author(s) and the copyright owner(s) are credited and that the original publication in this journal is cited, in accordance with accepted academic practice. No use, distribution or reproduction is permitted which does not comply with these terms.
*Correspondence: Wayne Caldwell, wcaldwel@uofguelph.ca; Xiaoyuan Wan, wanxypku@gmail.com