 Yurina Otaki
 Hidehito Honda
 Kazuhiro Ueda
- 1Graduate School of Social Science, Hitotsubashi University, Tokyo, Japan
- 2Faculty of Psychology, Otemon Gakuin University, Osaka, Japan
- 3Graduate School of Arts and Sciences, The University of Tokyo, Tokyo, Japan
It is commonly recognized in the field of water demand management that social comparison of water usage among people with a similar background is an effective measure to promote water efficiency. Many studies have used “neighborhood” to represent group similarity, but it is unclear how much geographic proximity is appropriate for defining a neighborhood. Therefore, the aim of this study is to clarify what neighborhood range is the most effective for promoting residential water use efficiency. We conducted a field experiment on social comparison feedback using two neighborhood ranges: narrow (condominium complex level) and wide (prefecture level), and analyzed changes in the water usage of 114 households residing in a condominium in the Tokyo metropolitan area, based on daily household water consumption data and an emoticon-based feedback system. As a result of classification of water consumption trend patterns using the K-means clustering method, it was suggested that those with low-consumption reduced their consumption as a result of the intervention, irrespective of neighborhood range. Despite the limited amount of data, the results provide insights into designing and implementing more effective feedback methods outside the US and European regions, especially in the context of residential water efficiency.
Introduction
Water management comprises both supply- and demand-side management strategies, which focus on water resource expansion and demand reduction, respectively. For water resource conservation and future water security, water demand management is a particularly essential element (Brooks, 2006; Fielding et al., 2013; Koh, 2020). With the advent of smart water-meter technology, several ICT solutions have already been deployed to optimize operations in supply-side management. By contrast, demand-side management has lagged behind (Makropoulos et al., 2014), but it has recently begun to gain popularity. Demand-side management has been traditionally thought of as too inconvenient for consumers (Kanta and Berglund, 2015). However, the detailed and customized information about water usage provided by smart water-metering technology presents a new opportunity for demand-side management through consumer engagement, based on efficiency measures (Boyle et al., 2013; Liu et al., 2013). Although water utilities have expressed significant interest in utilizing data from smart water metering, actual implementation is still limited world-wide. Moreover, availability of continuous, detailed feedback on water-use as a customer service has been relatively rare and tends to be regionally biased. Such services are being implemented only in some parts of the United States and Europe, where water conservation through feedback is planned. Therefore, greater consideration is required before such measures are introduced by water utilities around the world (Liu et al., 2016).
Some past studies have used real-time feedback on water consumption volume, based on data from smart water meters. Although such simple feedback can reduce consumption by 5–20% (Sonderlund et al., 2014), its efficacy on residential water consumption appears to be limited and transitory (Schultz, 2002; Stewart et al., 2012). Therefore, much research has focused on not only numerical data about consumption but also providing effective feedback. Social comparison with peers based on similarity is an effective way of improving water efficiency. For example, 6.6% of water saving was reported in a 15-week study that used feedback on water consumption and included social comparisons expressed in terms of “neighborhoods like yours” (Erickson et al., 2012). Water saving was also reported by a one-week one-time intervention using social comparison expressed as “similar households” (Schultz et al., 2014, 2019). Likewise, a five-month intervention study using social comparisons expressed as “your neighbor's average” observed a decrease in water consumption (Ferraro et al., 2011). In addition, in the field of energy efficiency, feedback using social comparison in terms of “similar households” reduced electricity consumption without financial benefit (Bator et al., 2019) over a period of two years (Dominicis et al., 2019). In this vein, many studies have used “neighborhood” to represent similarity; however, some concerns have been raised including the boomerang effect and geographic proximity.
Social comparison sometimes triggers a boomerang effect, which drives some consumer groups to increase their consumption (Yakobovitch and Grinstein, 2016). A study on electricity usage reported that low-energy users increased their consumption (i.e., a boomerang effect) if they were informed of their own and their neighbor's consumption by the descriptive norm alone. The study also found that the boomerang effect can be suppressed by adding an injunctive norm (Schultz et al., 2007). Similarly, a study on residential water use reported that comparing neutrally-framed individuals' peer rank with their neighbors' rank caused a minor boomerang effect for low-water-using households (Bhanot, 2017). Therefore, to prevent the boomerang effect, this study used the descriptive plus injunctive norm as a feedback method.
It has been pointed out that the local norm, that is, what people sharing the same spatial-physical setting are doing, rather than subjective norm, that is, what people with whom you have a psychological connection are doing, influences pro-environmental behavior (Fornara et al., 2011). However, few studies have directly tested the relative influence of different geographic proximities that vary in their level of specificity (Mertens and Schultz, 2021). A study on tax payment patterns indicated that social comparison had a greater effect when it was related to the behavior of a geographically closer community than that of a more distant one (Hallsworth et al., 2017). Contrastingly, studies on household recycling reported different results; that is, the effect of a city-level comparison was lower than that of a country-level comparison (Czajkowskia et al., 2019), and there was no difference between specific normative feedback about immediate neighbors (i.e., five closest neighbors) and generic normative feedback about other residents in their neighborhood (i.e., other similar households) (Mertens and Schultz, 2021). Another study on energy conservation programs using a normative feedback approach in the home energy reports indicated that increasing the level of proximity of the comparison from neighborhood to street level in-creased electricity savings; however, further increasing the comparison level to next-door neighbor leads to a drop in energy saving (Shen et al., 2016). These studies suggest that the effect of geo-graphic proximity varies across contexts, regions, and the degree of proximity.
Therefore, the aim of this study is to determine the effective neighborhood range for residential water efficiency. We conducted a field experiment on social comparison feedback using two neighborhood ranges—narrow (condominium complex level) and wide (prefecture level)—in the Tokyo metropolitan area. This is the first paper testing the influence of different geographic proximities that is focused on water conservation and carried out outside the US or the European continent. The results can provide insights on designing and implementing more effective feedback methods, outside the US and European regions, in the context of residential water efficiency.
Materials and Methods
Study Area and Participants
In order to correct the regional bias of the existing body of literature related to smart water metering, this study was conducted in Japan. The current situation regarding the water supply in Japan is that the penetration rate is almost 100%, the average leakage rate is 5%, all households are equipped with water meters, which are read by meter readers every one to two months. Each household is equipped with a water meter managed by the municipality and households pay a water bill every one to two months based on the amount of water used. There are mechanisms in place to maintain a high metering level, such as the legal requirement that water meters be replaced every eight years. However, smart water metering has been lagging behind. It remains at the demonstration test stage and has not yet been put to practical use. Therefore, we conducted our research in a condominium where a private developer, not the water utility, had introduced a system to measure daily water consumption.
This condominium complex is located in Kashiwa-city, which is one of the core cities in the Tokyo metropolitan area. It is located about 30 kilometers from the center of Tokyo (Figure 1). Like the residents of other cities in the Tokyo metropolitan area, of the ones in Kashiwa-city commute to work in central Tokyo. The complex is a large-scale one—consisting of six buildings with ~900 units—that was originally equipped with a system to measure daily water consumption and a display monitor system at the entrance, which allowed push-type information (i.e., information actively sent from the server). Other than these systems, this is a very typical condominium in the Tokyo metropolitan area, with a variety of occupations and age groups living in it. In this condominium complex, households who agreed to cooperate with an academic investigation on electricity and water usage were connected to that system. Therefore, some were interested in the water consumption study and eager to check the display manipulation regularly, but others were not. A total of 114 households were connected to this system and were automatically included in this experimental study. The mean number of occupants of each household was 2.80 (SD = 1.13), with 10% of households having one occupant, 35% having two occupants, 29% having three, 19% having four, and 7% having five or more occupants.
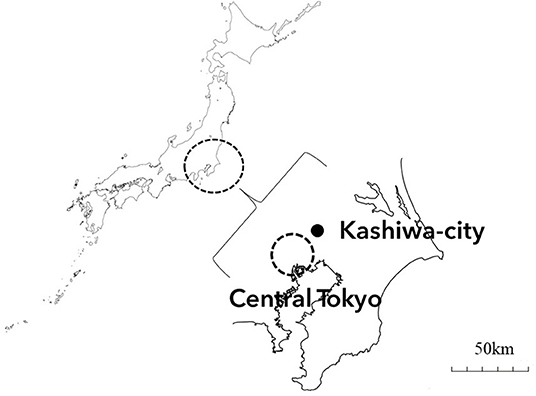
Figure 1. Geographical setting of the study area.
The households were allocated randomly to one of three groups—one control and two intervention groups—based on the range of geographical proximity. The intervention groups received feedback information at two-week intervals from November until March. Households assigned to the control group received no intervention. An analysis of variance indicated that there were no statistically significant differences in the number of occupants between the three groups (F = 0.00, p = 0.996). As participants lived in the same condominium, it was assumed that their living standards and weather conditions were identical.
Intervention
Every two weeks, the intervention groups received feedback wherein their water consumption was compared with that of their neighbors using emoticons that very clearly convey social approval (smiley face) or disapproval (tearful face) (Gaube et al., 2018). Such emoticons have also been successfully used in behavioral change settings to reduce energy consumption (Schultz et al., 2007; Alcott, 2011), food waste (Nomura et al., 2011) and water consumption (Mitchell and Chesnutt, 2013; Schultz et al., 2014; Otaki et al., 2017). Two ranges of neighborhood were set—a “narrow-range neighborhood” and a “wide-range neighbor-hood”—to test which range was the most effective for water efficiency. In the case of the narrow-range neighborhood, water consumption was compared among neighbors living in the same condominium complex. In the case of the wide-range neighborhood, water consumption was compared with neighbors living in the Tokyo metropolitan area.
Four types of emoticons that were commonly used in Japan were used to express relative quantity. Figure 2 shows the feedback for the wide-range neighborhood based on consumption evaluation. Such illustrative feedback was displayed on each house's door intercom monitor once every two weeks for a total of 10 times over five months. Initially, the water consumption per person in the last two weeks was calculated for every household; the households were subsequently sorted by consumption level and classified into four groups (i.e., low, slightly low, slightly high, high) in line with previous study (Otaki et al., 2017). Households in the bottom quarter had the lowest consumption and received a wide-smile smiley face emoticon (leftmost in Figure 2). Those in the top quarter had relatively high consumption and received a crying face emoticon (rightmost in Figure 2). The middle quarters comprised households with slightly low and slightly high consumption, and they received smiley face emoticons (second from left in Figure 2) and not-so-good face emoticons (second from right in Figure 2), respectively, according to their consumption.
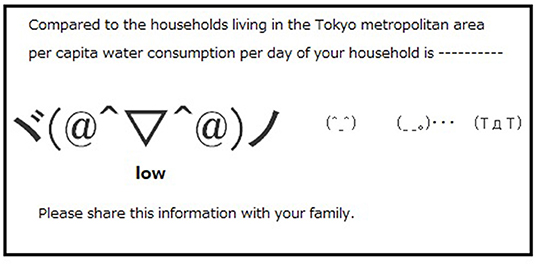
Figure 2. Example of feedback to residents who had the lowest water consumption in the wide range context. All emoticons were displayed, and the corresponding emoticon was shown in a larger type so that the relative position could be easily identified.
Water Consumption Data and Analysis
Daily consumption data during the survey period (mid-October to March) and monthly consumption data for the past year for each household were available from the utility provider. The average daily water consumption per person for the last year was plotted for each group (Figure 3). As daily water use data are highly dependent on the length of time spent outside of the house on a given day and on daily water use behavior (e.g., whether washing is done, whether meals are prepared, etc.), the monthly average of daily water use data was used for the analysis. We conducted a within-subjects ANOVA on the conditions, and the result did not show any significant difference at the commencement of the study [F(1,112) = 0.286, p = 0.594, = 0.002] or in the previous year [F(1,112) = 0.000, p = 0.993, = 0.000].
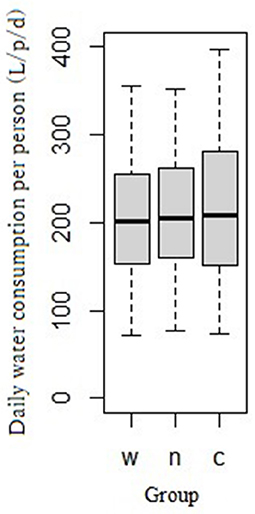
Figure 3. Water consumption data (average daily consumption per person from the previous year) within the study area. W, n, and c on the x-axis represent the wide-range and narrow- range neighborhoods, and the control group, respectively.
Generally, water consumption varies significantly from day to day, because the consumption becomes zero when residents are absent from their home all day and increases, for example, when there is a party. Therefore, we excluded data collected during the year-end and New Year holidays (from 22 December to 5 January) from the analysis because it is customary in Japan to leave one's present home in the Tokyo metropolitan area and return to one's (family) hometown. We also excluded any data that was unusually high or low. For the latter, z values were calculated using daily water consumption during the survey period for each household, and any data whose z value was more than 2.5 or < -2.5 was then excluded from the analysis.
We calculated the relative value for every day of the same month of the previous year for each household as follows:
where Cdn is daily water consumption (L/day) for each day of the month, Cpn is the monthly-average daily water consumption of the previous year (L/day) (baseline), and logRPdn is the log-transformed relative proportion [n = 11 (November), 12 (December), 1(January), 2 (February), 3 (March)]. When logRPdn takes a value greater than (less than) zero, this signifies an increase (decrease) in water usage compared with the previous year. When logRPdn takes zero, water usage is identical to the previous year. Because water usage is affected by many factors and varies every day, we calculated the median of the logRPdn (i.e., logRPn) for every month for each household. We regard this median as the measure of the increase or reduction in water usage for the month. That is, for each household, we obtained five datasets of logRPn (Nov, Dec, Jan, Feb, and Mar) and considered them as the trend in water usage.
Next, we classified the patterns in the water usage trend (i.e., five datasets of logRPn) using the K-means clustering method. We determined the number of clusters by considering the trade-off between parsimony (i.e., as few clusters as possible) and informativeness (i.e., as many clusters as required). In addition, we also determined the number of clusters in the patterns of the water usage trend using the R library “NbClust” (Charrad et al., 2014). In this library, the optimal number of clusters is determined based on 26 criteria. Each of the 26 criteria indicates the optimal number of clusters, and “the best number” of clusters is determined by the majority rule (i.e., the number that is best supported among the 26 criteria is regarded as the “best number”).
To analyze the clustering results, we categorized the households into “low” and “high” consumption in terms of the level of water usage in the previous year, by the following procedure. It is generally understood that as the number of household members increases, water consumption per capita decreases. As the participants were residents of condominiums there was no outdoor water use and all water use was consumed indoors. Indoor water use is more influenced by the household size. To eliminate the influence of household size, we converted each household's water consumption per capita in the previous year into a value that is assumed for a one-person household. In this way, each household was distributed into “high” (more than 230 L/p/day) or “low” (<230 L/p/day) water usage in the previous year (Otaki et al., 2019). The boundary between high and low consumption was 230 L/p/d, which is the average water consumed by a family of three in the Tokyo metropolitan area.
A flow of the entire process is shown in Figure 4.
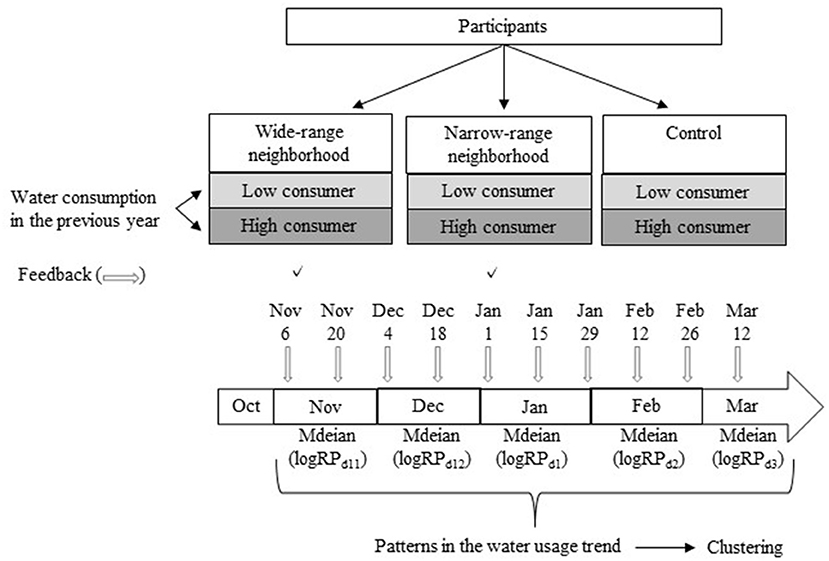
Figure 4. Flow of the methodology.
Results
Clustering of the Trend of Water Usage
We determined that four clusters were reasonable in a parsimonious and informative way. Using NbClust, we tried to find the optimal number of clusters between 2 and 15 clusters. Results showed that two and four clusters were supported by seven criteria and were therefore regarded as the best number. Because this study aimed to investigate the patterns of trends in water usage thoroughly, we adopted four clusters to consider more detailed patterns. Figure 5 gives the features of the four clusters. These plots denote the mean logRPn in every month for each cluster. In terms of trends (i.e., reduction or increase of water usage), we named the four clusters “large reduction,” “small reduction,” “no shift,” and “increase.” The top panel of Table 1 shows the proportion of households classified into each cluster. It was found that most households (around 90%) were classified into “small reduction” or “no shift,” suggesting that most households did not change their water usage significantly as a result of the field experiment.
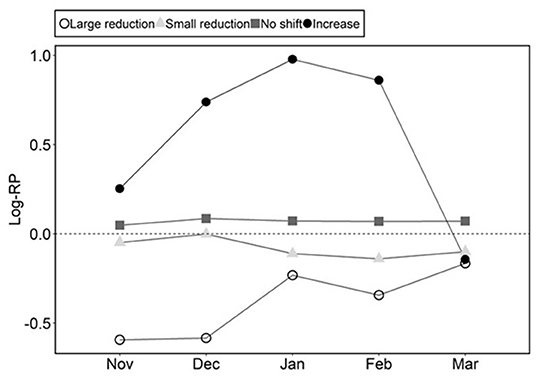
Figure 5. Features of the four clusters. These plots denote the mean Log-RPs in every month for each cluster.
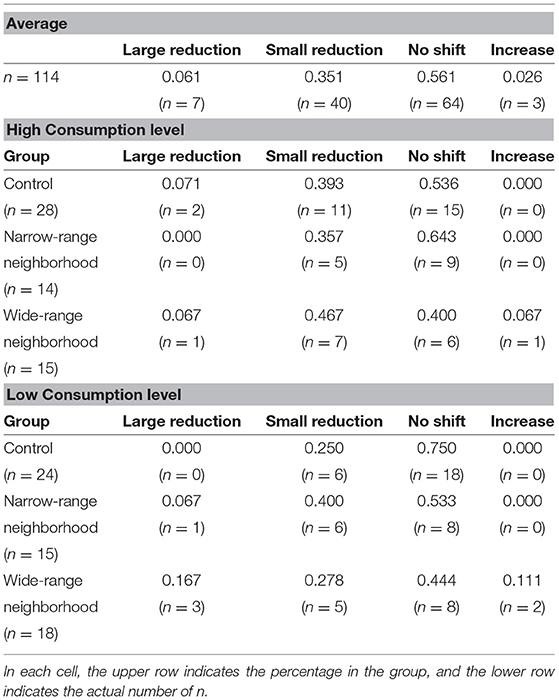
Table 1. The proportion of households categorized into the four clusters.
In every cluster, the LogRPn in March, at the end of the study, was approximately zero. It is possible that the effect of the intervention had expired after five months. However, it is also possible that the multiple outrage of the front door intercom system in March had something to do with it.
Intervention Effect for High- and Low-Consumption Households
Next, we analyzed in detail how each group changed its water usage. We calculated the proportion of households that were classified into each of the clusters in terms of the grouping (i.e., intervention and control) and the level of water usage in the last year (i.e., high consumption and low consumption).
The middle and bottom panels of Table 1 show the results for this classification. Since the data points were not sufficient to analyze high consumption and low consumption separately, we simply note general trends here. First, for the households in the high consumption level, there was no difference in the percentages of households classified as “Small reduction” or “No shift” among the control, narrow-range and wide-range groups (i.e., 39%, 36%, 47% for “Small reduction” and 54%, 64%, 40% for “No shift,” respectively). This implies that the display system intervention did not affect water usage. By contrast, an effect from the display manipulation was observed for those in the low-consumption level. Compared with the control group (the proportion of households that showed a reduction of water usage, i.e., “Large reduction” and “Small reduction,” was 25%), more households showed a reduction in water usage (considering the narrow-range and wide-range groups, around 45% of the households showed a reduction in water usage). In addition, a comparison of the two intervention groups showed that the neighborhood range did not affect this reaction.
Furthermore, the impact of geographic proximity was investigated for the low consumers, who were affected by display manipulation. This was done by determining how the year-on-year change in usage had changed since the beginning of the study (PRn/RP10). There was no significant difference between narrow- and wide-range neighborhood [November: t(29) = −0.841, p = 0.407; December: t(29) = −0.349, p = 0.730; January: t(29) = 0.607, p = 0.549; February: t(29) = −0.336, p = 0.739; March: t(29) = 0.505, p = 0.617] throughout the study period (Figure 6).
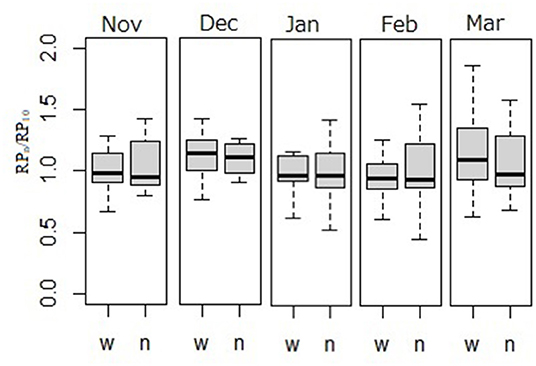
Figure 6. Impact of geographic proximity on the year-on-year change in usage for low consumer. W and n on the x-axis represent the wide-range and narrow-range neighborhoods, respectively.
Discussion
The analysis revealed that in line with previous studies, the same spatial-physical setting encouraged pro-environmental behavior, that is, water-saving behavior (Goldstein et al., 2008; Fornara et al., 2011; Schultz et al., 2019; Mertens and Schultz, 2021), but it was limited to low consumers, not all users. The differences in geographic proximity did not affect water use behavior, and this result is consistent with the findings of Mertens and Schultz (2021)'s waste recycling study. Previously, in the case of tax payment research, the authors concluded that it is better to present communities that are geographically close when making comparisons with their neighbors, because their results showed that when people were presented with the country level and local area level normative messages (i.e. “The great majority of people in UK/your local area pay their tax on time”), those who saw the local area level message were more likely to pay their taxes on time. Our study does not contradict the results of the tax study, as we investigated the differences within “in your local area” in the study of Hallsworth et al. (2017). The same can be said in of a recycling study: that also compared national-level and city-level norm (Czajkowskia et al., 2019). Shen et al. (2016)'s study compared groups such as “all neighbors in your village,” “all neighbors on your street,” and “next door neighbors,” and concluded that “all neighbors on your street” is the most effective for energy saving. However, their results are not consistent with this study's results. Further research is needed to clarify the reasons for this contradiction, but at this point, the difference in location may be one of the most significant factors. Moreover, while Shen et al. (2016) studied a military community, we studied a typical condominium. A military community is different from a general community as the former are likely to have a stronger sense of solidarity than the latter because everyone is in the same profession, and they do not pay for their utility usage even though they are individually metered. Therefore, applying the results from the military community directly to the general community may yield different results. In addition, the geographical proximity measure being compared is different. In our study, narrow-range neighborhood covered about 900 households, which is approximately the same number of households as the largest geographical proximity (“all neighbors in your village”) in Shen et al. (2016)'s study. Therefore, in future studies, a narrower range of geographical proximity for comparison with neighbors, such as households residing on the same floor of an apartment building, could be used as a comparison to verify the water saving effect.
The finding regarding the change in the usage of low-consumption households is different from that of previous studies, which reported that social comparison was effective in decreasing the usage of high-consumption households and had no influence or a minor increase on low-consumption households (Davies et al., 2014; Schultz et al., 2014, 2019; Otaki et al., 2017; Landon et al., 2018). A possible reason for this difference is in the characteristics of the participants. As participants in some previous studies were volunteers or recruited from the registered monitor, they were cooperative and proactive in checking the feedback. By contrast, as the participants of this study were drawn from the general population (i.e., they participated in this study regardless of their voluntary status), some were interested in the feedback and were eager to check the display monitor regularly, while others were not. Because the low-consumption consumers are likely to be aware of and concerned about water consumption in general (Gregory and Leo, 2003), it may be that in our study only these consumers checked the display continuously.
Another possible reason is the differences in the feedback display devices used. Previous studies used in-home display systems, websites, and print media. Newly equipped in-home displays might have been more attractive to residents, whereas the door intercom monitor used in this study was a long-familiar device for participants. Further, most previously used systems were continuously available if residents wanted to check feedback, whereas the display on the door intercom monitor disappeared once it was touched. Because it disappears quickly, it may not leave an impression on anyone other than those who are interested in water use. In addition, in the case of paper media, there is a higher chance that family members will see it, but with the door intercom monitor system used in this study, only the person who touched it had a chance to see it, so the effect on the family may have been limited.
From the perspective of geographic proximity, the result of this study reveals that the proximity level of neighbors, in which hundreds of households may belong, did not seem to affect water use efficiency. These results are significant as they are based on a more “general” population and thus highlight the challenges of societal implementation. Unlike voluntary participants in studies, those from the general population may not see the feedback provided by the system, and there is a possibility that the water saving effect on society will be limited. Therefore, future studies are required to consider not only the contents of the feedback but also the access to it.
There are some limitations to this study. First, we were only able to conduct the study for a few months. When the water consumption feedback system is fully implemented, continuous feedback will be given over a long period of time and the effect may fade away. Precisely, a last-month change suggested that the intervention was no longer effective. A long-term survey needs to be conducted to clarify whether this was due to the continuation of the intervention or a problem in the system. Future research can verify the effect of continuous feedback over a long period. Second, as smart water metering has not been put to practical use in all but a few regions of the world, it is difficult to obtain digital data on water consumption, and there is a limit to the number of data that can be used. In this study, it was also difficult to secure a sufficient amount of survey data. However, considering that the introduction of smart water meters and the establishment of feedback systems usually proceed in parallel, it is possible to build a useful system if the supplier knows in advance how the feedback will change water usage. Therefore, we believe that it is worthwhile to conduct a study even with limited resources.
Conclusion
A field experiment on residential water consumption using social comparison feedback was conducted in the Tokyo metropolitan area. Feedback evaluation on resident water consumption was shown on door intercom monitors once every two weeks for a total of 10 times over five months. The control group received no feedback evaluation. The intervention groups received feedback wherein their water consumption was compared with that of their physically close neighbors using emoticons that very clearly conveyed social approval (smiley face) or disapproval (tearful face). For the intervention groups, we distinguished two types of physically close neighbors, namely, narrow-range (condominium complex level) and wide-range (prefecture level) neighbors, and compared the effects of feedback between them.
In terms of geographical proximity, no difference was found between narrow-range and wide-range neighbors, with both types of feedback encouraging water saving among low water consumers. Some of the differences in findings from previous studies may be due to differing characteristics of the participants, feedback display devices, and study areas. The study findings indicate that the level of neighbors, in which hundreds of households may belong, did not seem to affect water use efficiency.
Data Availability Statement
The original contributions presented in the study are included in the article/Supplementary Material, further inquiries can be directed to the corresponding author.
Ethics Statement
The studies involving human participants were reviewed and approved by the University of Tokyo. The patients/participants provided their written informed consent to participate in this study.
Author Contributions
YO: conceptualization, methodology, resources, data curation, writing—original draft preparation, project administration, and funding acquisition. HH: conceptualization, methodology, validation, formal analysis, investigation, and writing—review and editing. KU: conceptualization, methodology, investigation, writing—review and editing, and supervision. All authors contributed to the article and approved the submitted version.
Funding
This research was funded by JSPS: Japan Society for the Promotion of Science, Grant-in-Aid for Scientific Research (B), grant number JP18H04324 and Scientific Research (C), grant number JP15K00653.
Conflict of Interest
The authors declare that the research was conducted in the absence of any commercial or financial relationships that could be construed as a potential conflict of interest.
Publisher's Note
All claims expressed in this article are solely those of the authors and do not necessarily represent those of their affiliated organizations, or those of the publisher, the editors and the reviewers. Any product that may be evaluated in this article, or claim that may be made by its manufacturer, is not guaranteed or endorsed by the publisher.
Supplementary Material
The Supplementary Material for this article can be found online at: https://www.frontiersin.org/articles/10.3389/frwa.2022.821896/full#supplementary-material
References
Alcott, H. (2011). Social norms and energy conservation. J. Public Econ. 95, 1082–1095. doi: 10.1016/j.jpubeco.2011.03.003
Bator, R., Phelps, K., Tabanico, J., Schultz, P. W., and Walton, M. (2019). When it's not about the money: social comparison can promote energy conservation when residents don't pay utility bills. Energy Res. Soc. Sci. 56, 101198. doi: 10.1016/j.erss.2019.05.008
Bhanot, S. (2017). Rank and response: a field experiment on peer information and water use behaviour. J. Econ. Psychol. 62, 155–172. doi: 10.1016/j.joep.2017.06.011
Boyle, T., Giurco, D., Mukheibir, P., Liu, A., Moy, C., White, S., et al. (2013). Intelligent metering for urban water: a review. Water 5, 1052–1081. doi: 10.3390/w5031052
Brooks, D. B. (2006). An operational definition of water demand management. Int. J. Water Resour. Dev. 22, 521–528. doi: 10.1080/07900620600779699
Charrad, M., Ghazzali, N., Boiteau, V., and Niknafs, A. (2014). NbClust: an R package for determining the relevant number of clusters in a data set. J. Stat. Softw. 61, 1–36. doi: 10.18637/jss.v061.i06
Czajkowskia, M., Zagórska, K., and Hanley, N. (2019). Social norm nudging and preferences for household recycling. Resour. Energy Econ. 58, 101110. doi: 10.1016/j.reseneeco.2019.07.004
Davies, K., Doolan, C., Honert, R., and Shi, R. (2014). Water-saving impacts of smart meter technology: an empirical 5 year, whole-of-community study in Sydney, Australia. Water Resour. Res. 50, 7348–7358. doi: 10.1002/2014WR015812
Dominicis, S. D., Sokoloski, R., Jaeger, C. M., and Schultz, P. W. (2019). Making the smart meter social promotes long-term energy conservation. Palgrave Commun. 5, 51. doi: 10.1057/s41599-019-0254-5
Erickson, T., Podlasek, M., Sahu, S., Dai, J. D., Chao, T., and Naphade, M. (2012). “The Dubuque water portal: evaluation of the uptake, use and impact of residential water consumption feedback,” in Proceedings of SIGCHI Conference on Human Factors in Computing Systems (Austin, TX). doi: 10.1145/2207676.2207772
Ferraro, P. J., Miranda, J. J., and Price, M. K. (2011). The persistence of treatment effects with norm-based policy instruments: evidence from a randomized environmental policy experiment. Am. Econ. Rev. 101, 318–322. doi: 10.1257/aer.101.3.318
Fielding, K. S., Spinks, A., Russell, S., McCrea, R., Stewart, R., and Gardner, J. (2013). An experimental test of voluntary strategies to promote urban water demand management. J. Environ. Manag. 114, 3463–3351. doi: 10.1016/j.jenvman.2012.10.027
Fornara, F., Carrus, G., Passafaro, P., and Bonnes, M. (2011). Distinguishing the sources of normative influence on proenvironmental behaviors: the role of local norms in household waste recycling. Group Process. Intergroup Relat. 14, 623–635. doi: 10.1177/1368430211408149
Gaube, S., Tsivrikos, D., Dollinger, D., and Lermer, E. (2018). How a smiley protects health: a pilot intervention to improve hand hygiene in hospitals by activating injunctive norms through emoticons. PLoS ONE 13, e0197465. doi: 10.1371/journal.pone.0197465
Goldstein, N. J., Cialdini, R. B., and Griskevicius, V. (2008). A room with a viewpoint: using social norms to motivate environmental conservation in hotels. J. Consum. Res. 35, 472–482. doi: 10.1086/586910
Gregory, G., and Leo, M. (2003). Repeated behavior and environmental psychology: the role of personal involvement and habit formation in explaining water consumption. J. Appl. Soc. Psychol. 33, 1261–1296. doi: 10.1111/j.1559-1816.2003.tb01949.x
Hallsworth, M., List, J., Metcalfe, R., and Vlaev, I. (2017). The behavioralist as tax collector: using natural field experiments to enhance tax compliance. J. Public Econ. 148, 14–31. doi: 10.1016/j.jpubeco.2017.02.003
Kanta, L., and Berglund, E. Z. (2015). Exploring tradeoffs in demand-side and supply-side management of urban water resources using agent-based modeling and evolutionary computation. Systems 3, 287–308. doi: 10.3390/systems3040287
Koh, R. (2020). Attitude, behaviour and choice: the role of psychosocial drivers in water demand management in Singapore. Int. J. Water Resour. Dev. 36, 69–87. doi: 10.1080/07900627.2019.1617114
Landon, A. C., Woodward, R. T., Kyle, G. T., and Kaiser, R. A. (2018). Evaluating the efficacy of an information-based residential outdoor water conservation program. J. Cleaner Prod. 195, 56–65. doi: 10.1016/j.jclepro.2018.05.196
Liu, A., Giurco, D., Mukheibir, P., and Watkins, G. (2013). Smart metering and billing: information to guide household water consumption. Water (Australia) 40, 73–77.
Liu, A., Giurco, D., Mukheibir, P., and White, S. (2016). Detailed water-use feedback: a review and proposed framework for program implementation. Utilities Policy 43, 140–150. doi: 10.1016/j.jup.2016.09.002
Makropoulos, C., Kossieris, P., Kozanis, S., Katsiri, E., and Vamvakeridou-Lyroudia, L. (2014). “From smart meters to smart decisions: web-based support for the water efficient household,” in Proceedings of 11th International Conference on Hydroinformatics (New York, NY).
Mertens, S. N., and Schultz, P. W. (2021). Referent group specificity: optimizing normative feedback to residential recycling. J. Environ. Psychol. 73, 101541. doi: 10.1016/j.jenvp.2020.101541
Mitchell, D., and Chesnutt, T. (2013). Evaluation of East Bay Municipal Utility District's Pilot of WaterSmartHome Water Reports, M.CUBED Policy Analysis for the Public and Private Sectors. Available online at: http://waterfoundation.net/wp-content/uploads/PDF/1389391749-Watersmart_evaluation_report_FINAL_12-12-13(00238356).pdf (accessed November 25, 2021).
Nomura, H., John, P. C., and Cotterill, S. (2011). The use of feedback to enhance environmental outcomes: a randomised controlled trial of a food waste scheme. Local Environ. 16, 637–653. doi: 10.1080/13549839.2011.586026
Otaki, Y., Honda, H., and Ueda, K. (2019). Historical self-comparison of water consumption as a water demand management tool. Water 11, 844. doi: 10.3390/w11040844
Otaki, Y., Ueda, K., and Sakura, O. (2017). Effects of feedback about community water consumption on residential water conservation. J. Cleaner Prod. 143, 719–730. doi: 10.1016/j.jclepro.2016.12.051
Schultz, P., Messina, A., Tronu, G., Limas, E., Gupta, R., and Estrada, M. (2014). Personalized normative feedback and the moderating role of personal norms: a field experiment to reduce residential water consumption. Environ. Behav. 48, 686–710. doi: 10.1177/0013916514553835
Schultz, W. (2002). “Knowledge, education, and household recycling: examining the knowledge-deficit model of behavior change. New tools for environmental protection,” in Education, Information, and Voluntary Measures in Environmental Protection, eds T. Dietz and P. Stern (Washington, DC: National Academy of Sciences), 67–82.
Schultz, W., Javey, S., and Sorokina, A. (2019). Social comparison as a tool to promote residential water. Front. Water 2:2. doi: 10.3389/frwa.2019.00002
Schultz, W., Nolan, J. M., Cialdini, R. B., Goldstein, N. J., and Griskevicius, V. (2007). The constructive, destructive, and reconstructive power of social norm. Psychol. Sci. 18, 429–434. doi: 10.1111/j.1467-9280.2007.01917.x
Shen, M., Young, R., and Cui, Q. (2016). The normative feedback approach for energy conservation behavior in the military community. Energy Policy 98, 19–32. doi: 10.1016/j.enpol.2016.08.014
Sonderlund, A. L., Smith, J. R., Hutton, C., and Kapelan, Z. (2014). Using smart meters for household water consumption feedback: knowns and unkowns. Procedia Eng. 89, 990–997. doi: 10.1016/j.proeng.2014.11.216
Stewart, R. A., Willis, R. M., Panuwatwanich, K., and Sahin, O. (2012). Showering behavioural response to alarming visual display monitors: longitudinal mixed method study. Behav. Inf. Technol. 7, 695–711. doi: 10.1080/0144929X.2011.577195
Keywords: water demand management, geographic proximity, social comparison, neighborhood range, water efficiency, household water consumption
Citation: Otaki Y, Honda H and Ueda K (2022) What Are the Most Effective Neighborhood Ranges for Social Comparison to Improve Water Use Efficiency? Front. Water 4:821896. doi: 10.3389/frwa.2022.821896
Received: 25 November 2021; Accepted: 25 January 2022;
Published: 18 February 2022.
Edited by:
Leon M. Hermans, IHE Delft Institute for Water Education, NetherlandsReviewed by:
Pradip P. Kalbar, Indian Institute of Technology Bombay, IndiaFaisal Ahammed, University of South Australia, Australia
Copyright © 2022 Otaki, Honda and Ueda. This is an open-access article distributed under the terms of the Creative Commons Attribution License (CC BY). The use, distribution or reproduction in other forums is permitted, provided the original author(s) and the copyright owner(s) are credited and that the original publication in this journal is cited, in accordance with accepted academic practice. No use, distribution or reproduction is permitted which does not comply with these terms.
*Correspondence: Yurina Otaki, yurina.otaki@r.hit-u.ac.jp