Forensic Identification of Fentanyl and its Analogs by Electrochemical-Surface Enhanced Raman Spectroscopy (EC-SERS) for the Screening of Seized Drugs of Abuse
 Colby E. Ott1
  Martin Perez-Estebanez2
  Sheila Hernandez2
  Kendra Kelly1
  Kourtney A. Dalzell1
  M. Julia Arcos-Martinez2
  Aranzazu Heras2
  Alvaro Colina2
  Luis E. Arroyo1*
- 1Department of Forensic and Investigative Science, West Virginia University, Morgantown, WV, United States
- 2Departamento de Química, Universidad de Burgos, Burgos, Spain
Reliable identification of fentanyl and fentanyl analogs present in seized drug samples is imperative to the safety of first responders and laboratory personnel and informs the future analysis process and handling procedures. The electrochemical-surface enhanced Raman spectroscopy (EC-SERS) method developed in this work allows the in-situ preparation of the SERS substrate providing a rapid, efficient, and accurate approach to detect fentanyl, even at low percent by weight concentrations common in seized drugs. Optimization of the electrochemical potentials suitable for the SERS substrate preparation and adsorption of the analyte was achieved using multi-pulse amperometric detection. This method demonstrated large enhancement of the SERS response. This method was applied to six fentanyl analogs with substitutions to the amide group, representing small changes in the fentanyl core structure. Identification of these analogs through differences in the EC-SERS spectra was evident. Interference studies incorporating analytes frequently encountered with fentanyl including heroin, cocaine, methamphetamine, naltrexone, and naloxone were assessed and found to offer limited to no interference. The limits of detection of the fentanyl compounds were in the low to mid nanograms per milliliter range, with the most sensitive compound detected at 10 ng/ml. Application of the method to simulated drug mixtures was performed to determine fit-for-purpose. In all mixtures with fentanyl as the minor contributor, fentanyl was correctly identified, including mixture samples comprised of 5 and 1% fentanyl. This approach represents the first in-situ EC-SERS analysis of fentanyl and its analogs and provides accurate and efficient screening for fentanyl in seized drug samples.
Introduction
Seized drugs represent a large proportion of cases submitted to forensic laboratories each year, with over 1.5 million drug cases reported in the United States in 2019 (U.S. Drug Enforcement Administration Diversion Control Division, 2020). In addition, the prevalence of fentanyl and its analogs continues to pose risks for society. Fentanyl has remained in the top 5 drugs encountered by forensic laboratories each year since 2017 and acetyl fentanyl and 4-ANPP have been in the top 25 (U.S. Drug Enforcement Administration Diversion Control Division, 2018; U.S. Drug Enforcement Administration Diversion Control Division, 2019; U.S. Drug Enforcement Administration Diversion Control Division, 2020; U.S. Drug Enforcement Administration Diversion Control Division, 2021). Since the rise of fentanyl analogs, drugs containing a similar core structure to fentanyl, identification, scheduling, and differentiation have been cornerstones of the forensic community’s response to the growing problem. However, similar structures and presence at lower concentrations and with other drugs has posed problems for traditional on-site detection techniques for both identification purposes and risk assessment for first responders and crime scene units.
With advancements in technology, the field of forensics continues to search for ways to screen seized drugs without the use of chemical color tests due to their subjective interpretation and lack of specificity. On the other hand, Raman spectroscopy has been presented as a viable alternative to color tests because of improved specificity and the possibility for objective analysis and use of libraries. As a form of vibrational spectroscopy, Raman provides structural information about analytes of interest, yielding a highly selective analysis, classified by the Scientific Working Group for the Analysis of Seized Drugs (SWGDRUG) as a Category A technique for its discrimination ability (SWGDRUG, 2019). Raman spectroscopy has been utilized extensively in the analysis of drug analytes with benchtop and portable instrumentation (O’Connell et al., 2010; Gerace et al., 2019; Omar et al., 2019; Lanzarotta et al., 2020; Cooman et al., 2021). However, a main drawback to this approach is generally sensitivity, where some drugs are present in authentic samples at a low percent ratio, sometimes masked by diluents or prone to fluorescence, making their analysis challenging with many portable methods.
One method to overcome this challenge has been the use of surface enhanced Raman spectroscopy (SERS), a phenomenon discovered by Fleishman et al. (1974). This phenomenon relies on the plasmonic properties of metallic nanostructures to greatly enhance the Raman signal of the molecules adsorbed over those structures (Wu et al., 2008; Langer et al., 2020), making single-molecule detection of several analytes possible (Chen et al., 2015). The use of SERS for analyzing drug analytes has become quite popular. In fact, the investigation of many drugs of abuse has been explored with SERS including amphetamines, MDMA, and amphetamine-like substances (Bell et al., 2000; Sägmüller et al., 2001; Faulds et al., 2002); barbiturates (Farquharson and Lee, 2000); mephedrone (Mabbott et al., 2013); and other types of drugs including cocaine, morphine, hydrocodone, fentanyl, codeine, diazepam, and fentanyl analogs (Farquharson et al., 2011; Rana et al., 2011; Leonard et al., 2017; Haddad et al., 2018; Shende et al., 2019b; Wang et al., 2019, Smith et al., 2021; Wang H. et al., 2021; Wang L. et al., 2021; Wilson et al., 2021; Zhang et al., 2021). The use of SERS has also enabled the analysis of these drug analytes in toxicological specimens such as urine, saliva, and blood (Inscore et al., 2011; Andreou et al., 2013; D’Elia et al., 2018; Shende et al., 2019a; Sivashanmugan et al., 2019; Han et al., 2021).
While most of the previously cited literature use metallic nanostructures for the Raman enhancement, in-situ preparation of a suitable substrate may be desirable to simplify the analysis procedure, reduce the number of needed resources, speed up analysis, and to improve reproducibility. Therefore, electrochemical-surface enhanced Raman spectroscopy (EC-SERS) has become a useful spectroelectrochemical approach. In an EC-SERS methodology, the SERS substrate is prepared by electrochemical roughening and generation of nanoparticles in-situ, differing from other approaches where the electrodes are modified with nanoparticles or colloids or where electrochemistry is used for preconcentration (Robinson et al., 2012; Jiménez-Pérez et al., 2016a; Jiménez-Pérez et al., 2016b; Ameku et al., 2019).
The use of EC-SERS is explained in detail in several papers for the detection of redox probes and multivitamins, as well as other analytes (Hernández et al., 2018; Martín-Yerga et al., 2018a; Martín-Yerga et al., 2018b; Hernandez et al., 2020; Ibáñez et al., 2020). The application of the proper electrical potentials will result in the oxidation and reduction of the metal electrode surface, generating nanostructures and often adsorbing the molecule to the surface of the electrode, resulting in enhancements in the Raman signal or detection of a previously undetectable analyte. Of the literature regarding EC-SERS approaches, two could fall into the realm of forensic analysis. Bindesri et al. (2020) reported the detection of THC and THC-COOH in saliva, and Ibáñez et al., 2021 reported the EC-SERS detection of several pesticides on gold electrodes.
To our knowledge, time-resolved in-situ EC-SERS has not been utilized to investigate the behavior of fentanyl and fentanyl analogs, nor for the quantitative analysis of fentanyl. Herein, we present a simple, selective, and sensitive method for in-situ EC-SERS identification of fentanyl and related compounds. Characterization and description of the generation of the silver substrate using EC-SERS is provided. Time-resolved measurements provide information regarding the behavior of these analytes under various conditions and differentiation of analog compounds is discussed. The result presented provide a platform for increased sensitivity and future analysis of other seized drug analytes by these methods.
Materials and Methods
Chemicals and Reagents
Fentanyl, 4-ANPP, Valeryl fentanyl, Furanyl fentanyl, Methoxyacetyl fentanyl, Acetyl fentanyl, Acryl fentanyl, and 2′-fluoro ortho-Fluorofentanyl were purchased from Cayman Chemical Company (Ann Arbor, MI). Perchloric acid was obtained from Fisher Scientific (Fair Lawn, NJ). Potassium chloride was received from Sigma-Aldrich (St. Louis, MO). Water (18.2 MΩ) was obtained using a Millipore Direct-Q® UV water purification system (Billerica, MA).
Instrumentation and Electrodes
A 785 nm-SPELEC commercial Raman spectroelectrochemistry instrument was purchased from Metrohm DropSens, United States with DropView SPELEC data analysis software (version 3.2.2 18LZ04), allowing for time-resolved measurements between electrochemical and spectroscopic data. Silver screen-printed electrodes (SPEs) DRP-C013 were obtained from Metrohm DropSens, containing a silver working and reference electrode with a carbon counter electrode. The working electrode had a geometric area of 0.02 cm2.
Surface Characterization
Voltametric approaches were utilized to investigate the generation of a suitable SERS substrate in-situ at the silver working electrode surface. An anodic potential of +0.3 V was applied and then scanned in the cathodic direction until approximately −0.3 V (after the reduction wave) in a solution of 0.1 M HClO4 solution supplemented with 0.01 M KCl. For comparison, pristine silver screen-printed electrodes were used. Characterization of the surface was performed using both scanning electron microscopy (SEM) and atomic force microscopy (AFM). A JEOL SEM JSM7600 operating at 5.0 keV was utilized to obtain surface images of the electrodes between 40X and 30000X. Samples were lightly coated with carbon using a Denton Desk V Sputter coater with Carbon Rod Accessory for carbon evaporation. Additionally, an Asylum Research MFP-3D™ AFM instrument was used to provide surface topography information. Additional data processing was performed with WSXM free software.
Methodology
Samples were prepared to the desired concentration using water, perchloric acid, and potassium chloride to achieve a final supporting electrolyte concentration of 0.1 M HClO4 and 0.01 M KCl. In addition, simulated mixture samples were prepared to replicate authentic seized samples from a crime scene or drug seizure containing a binary mixture of analytes at varying ratios. These mixtures were prepared in similar fashion as previously described by Cooman et al. (2021). Briefly as an example, a 1:4 mixture was prepared by combining 10 mg of compound one with 40 mg of compound two within a plastic bag. All simulated powdered samples were prepared in this way as solid mixtures. Prior to analysis, dissolution of a small amount of the powdered mixture was performed in the supporting electrolyte. However, for fentanyl and heroin mixtures, solid samples of heroin were not readily available and instead, these mixtures were made by preparing each analyte to the same concentration (10 μg/ml) prior to the preparation of the mixture ratios by combining the appropriate volume of each analyte to form the ratio, i.e. 10 μL and 40 μL.
In-situ roughening and preparation of silver nanoparticles was achieved using both a cyclic voltammetry (CV) and multi-pulse amperometric detection (MPD) method to achieve substrate preparation and analyte analysis in the same experiment. To this end, samples were analyzed by first placing a 50 μL drop of analyte and supporting electrolyte on the silver electrode, covering the three-electrode system completely. The spectrometer was set to the desired integration time and laser power, typically 1,000 ms or 5,000 ms and 122.0 or 379.1 mW. Cyclic voltammetry was used to obtain electrochemical data for the analytes of interest and to understand the in-situ changes to the electrode surface. CV measurements were generally performed starting at +0.45 V in the cathodic direction and sweeping between +0.45 V and −0.40 V. MPD was used for analysis of individual analytes, interference studies, and simulated samples. The following MPD method was performed in 5 steps with an interval of 0.1 s: +0.45 V for 3 s, −0.05 V for 30 s, OCP (open circuit potential) for 240 s, +0.45 V for 3 s, and −0.05 V for 50 s. MPD method was developed based on an optimization process of the experimental conditions. The resulting EC-SERS spectra were then utilized for data analysis.
Results and Discussion
EC-SERS affords the benefits of providing a substrate capable of enhancing the Raman scattering of the analyte of interest while reducing the complexity of analysis and allowing in-situ experiments to occur. A simple method like this is beneficial for use with portable instrumentation like the one used in this work, where the procedures and methods must be easy to use and utilize limited resources, especially in forensic science settings and crime scenes.
EC-SERS Substrate
First, the process of in-situ generation of the SERS substrate was assessed using silver screen-printed electrodes and a simple linear sweep voltammetry method. To this end, an anodic potential was set to achieve oxidation of the silver electrode surface (+0.30 V) and then scanned in the cathodic direction until just after the reduction wave, indicating the formation of nanoparticles. Both SEM and AFM were used to assess the surface changes of the silver electrode to determine the presence and approximate size of the any nanoparticles present. Figure 1 demonstrates the before and after surface analysis of new electrodes and the SERS substrate surface. Figures 1A,B demonstrate the reasonably smooth and clean starting silver surface. In contrast, Figures 1C,D demonstrate the presence of newly formed nanoparticles and nanofeatures on the now “roughened” silver electrode, where the enhancement of Raman scattering can be attributed to effects at these structures. The approximate size of the nanoparticles averaged 163 ± 81 nm and often appeared in clusters of several nanoparticles. A histogram of the distribution of the size of the nanoparticles can be found in Supplementary Figure S1.
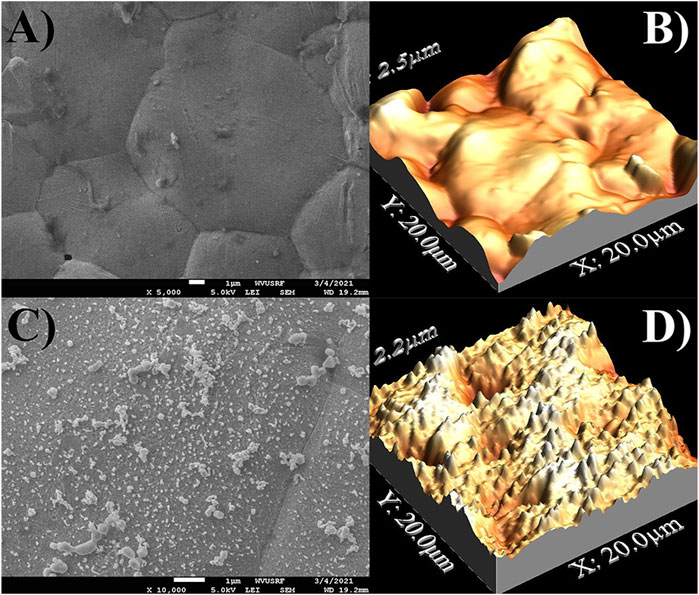
FIGURE 1. Surface analysis images of silver screen printed electrodes via SEM and AFM in unused condition (A,B) and with the in-situ preparation of a nanostructured surface for SERS (C,D).
EC-SERS Analysis of Fentanyl
A multi-pulse amperometric detection (MPD) method was created in order to provide a more controlled process over the development of the SERS substrate for optimal response of the target molecule. Optimization of the MPD parameters was manually achieved through assessment of various oxidation and reduction potentials related to the oxidation and reduction processes of the electrode materials and analyte, as well as any possible adsorption of the analyte on the SERS substrate. To this end, various oxidation potentials and times were first explored to properly oxidize the silver working electrode surface. Next, reduction potentials corresponding to the reduction of silver and generation of nanoparticles was tested to generate the largest response. During this process, it was observed that adsorption of the molecule may take place on the reduced silver surface. Therefore, an adsorption time at the open circuit potential was applied to the method. SERS generally relies on the molecule of interest being in close proximity to the SERS substrate in order for enhancement to occur, where generally the best-case scenario is for an adsorbed analyte of interest. This adsorption time demonstrated the ability to increase the fentanyl signal when applied for an optimized amount of time. Figure 2 demonstrates an example of an MPD response for the in-situ EC-SERS analysis of fentanyl, showing the first and second oxidation/reduction steps and the OCP time. Additionally, the evolution of the Raman intensity of the major Raman shift for fentanyl (∼1,004 cm−1) can be seen, demonstrating the corresponding Raman intensity with the amperogram. This figure shows how the Raman spectrum evolves and changes throughout the MPD method, allowing one to observe the in-situ preparation of the SERS substrate.
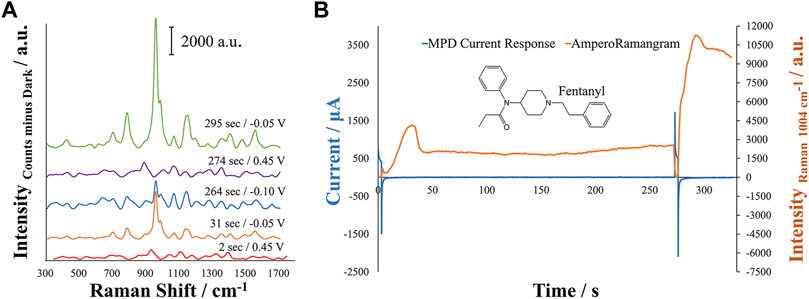
FIGURE 2. Analysis of a 5 μM solution of Fentanyl in 0.1 M perchloric acid +0.01 M KCl for (A) overlay of EC-SERS spectra on the same y-axis scale for the evolution of the Raman spectrum of Fentanyl during the MPD method and (B) MPD current response generated from the applied potential at different times and evolution of the Raman signal during the in-situ preparation of the electrode SERS substrate. A large increase in the Raman signal can be noted around 295 s following the second reduction potential. Spectra were collected with a 1 s integration time at a laser power of 379.1 mW. The abbreviation a.u. represents arbitrary units.
Initially, an oxidation potential, +0.45 V, is applied for 3 s to generate the oxidation of silver, generating Ag+ in solution that is reduced at −0.05 V for 30 s. This pulse is also useful to start with a clean surface where no molecules are adsorbed on the electrode surface. A large increase in the Raman intensity at 1,004 cm−1 can be seen in Figure 2 during this reduction step, where silver nanostructures are generated on the electrode. The increase of Raman intensity at 1,004 cm−1 occurs twice within the MPD amperogram, once directly following the first reduction potential and again directly following the application of the second reduction potential. However, the increase in Raman intensity differs for the two regions by approximately 10,000 counts. This can be attributed to the adsorption of the molecule during the OCP step, where the molecule may become more concentrated and in closer proximity to the silver nanostructures generated during the first set of oxidation and reduction potentials. A slight increase of Raman intensity at 1,004 cm−1 is observed during the OCP step. The second oxidation potential at +0.45 V is applied rapidly over a short time, 3 s, allowing for the growth of new nanostructures during the subsequent reduction but allowing the preconcentrated fentanyl to remain in close proximity to the surface. The new nanostructures clearly show a higher enhancement of the Raman signal that could be related to the generation of new hot spots and to the adsorption of a higher amount of fentanyl that is available because of the OCP adsorption step. Figure 2 also demonstrates the development of the full Raman spectrum of fentanyl during this process, where clear SERS activity can be noted as evidence from the initial growth then loss of the Raman signal until the final redox step where the Raman intensity is highest at 295 s.
Following the development and optimization of method parameters and demonstrations of the SERS effect, the Raman spectrum was assessed for identification of Raman shift bands corresponding to the functional groups present within the fentanyl molecule. The following Raman bands were identified: -C-C symmetrical in-plane ring bending and R-CO-NR2 in-plane bending (619 cm−1), C-H rocking (654 cm−1), symmetric C-H bending (746 cm−1), asymmetric C-H bending (830 cm−1), C-C-C trigonal bending (1,004 cm−1), C-C stretching and C-H in-plane bending (1,030 and 1,179 cm−1), symmetric C-C stretching (1,200 cm−1), C-N piperidine stretching and C-H wagging (1,237 cm−1), C-H twisting (1,285 cm−1), CH3 and CH2 bending (1,447 cm−1), and C-C symmetric stretching (1,583 and 1,600 cm−1) (HORIBA Jobin Yvon Inc., 2018; Lin-Vien et al., 1991; Leonard et al., 2017). Supplementary Figure S2 presents the fentanyl structure and the EC-SERS spectrum for fentanyl along with band identifications and Raman shift values in Supplementary Table S1.
Analogs and Limits of Detection
This method was then applied to several fentanyl analogs including acetyl fentanyl, methoxyacetyl fentanyl, furanyl fentanyl, acryl fentanyl, valeryl fentanyl, and 4-ANPP. These fentanyl analogs represent changes in the amide portion of the core fentanyl structure and were chosen to demonstrate if similar molecules differing in changes at one position of the molecule could be differentiated using this method and approach. The EC-SERS spectra and molecular structures of the analogs can be seen in Figure 3. Several distinct areas between these spectra can be observed, including changes in the ratios of Raman bands. Some of these main differences have been highlighted in light red within the figure. It is important to note that many of the bands remain very similar within the analogs due to their shared core structure. This is especially evident in the analogs with only changes in the alkyl chain on the amide such as acetyl fentanyl (1 carbon chain), fentanyl (2 carbon chain), and valeryl fentanyl (4 carbon chain). In these analogs, slight spectral differences are present allowing for discrimination of these analogs using the generated EC-SERS spectra. The proposed EC-SERS method can help in screening situations by alerting investigators and laboratory personnel about the presence of fentanyl or fentanyl analogs within a sample, an important step to ensure the safety of personnel and first responders. Additionally, the EC-SERS spectra may allow specific identification of the fentanyl analog present. Another important note in these results is the difference in the 4-ANPP structure and spectrum from the other fentanyl analogs. 4-ANPP, also known as despropionyl fentanyl, is a metabolite and a precursor of fentanyl. Since this structure lacks an amide group, the EC-SERS spectrum differs from that of the other fentanyl analogs in several different places as expected due to the lack of the amide group. Additionally, 4-ANPP also demonstrated high sensitivity for this method. This increased sensitivity may result from the overall more linear structure of the molecule and reduced steric hindrance from absence of the amide substitution. This could improve the adsorption of the molecule to the EC-SERS substrate as well as its orientation on the surface. Chemometric approaches may be utilized in the future in order to improve discrimination and provide for more objective assessment of Raman shift band ratios and positions.
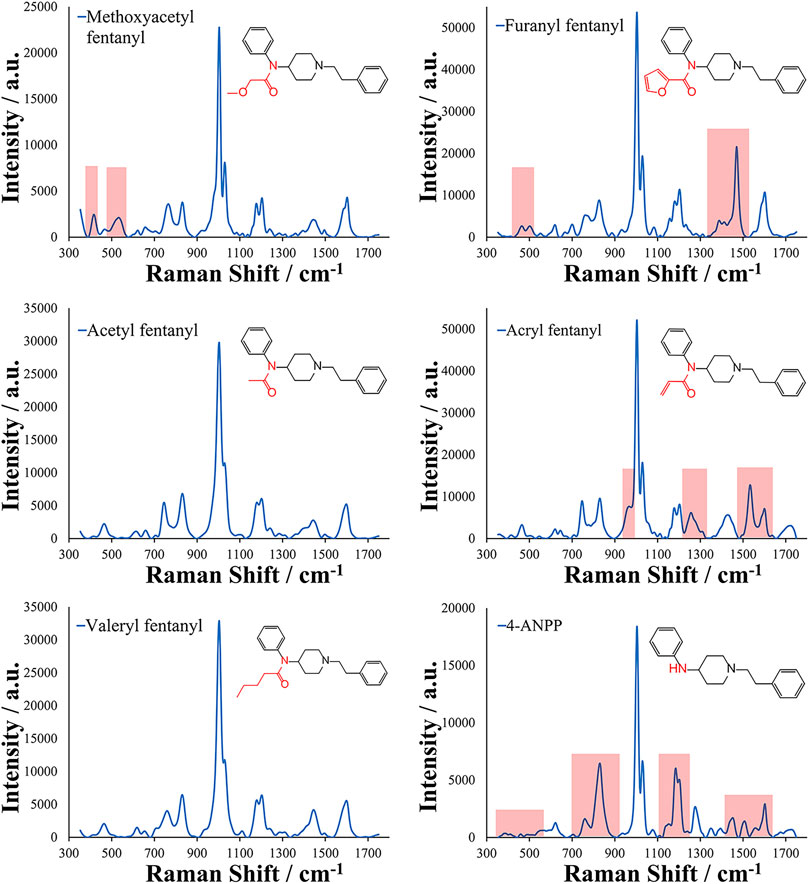
FIGURE 3. EC-SERS spectra collected for fentanyl analogs with substitutions made at the amide group (highlighted in red) of the core structure for Methoxyacetyl fentanyl, Furanyl fentanyl, Acetyl fentanyl, Acryl fentanyl, Valeryl fentanyl, and 4-ANPP. Raman shifts related to the amide group substitution are highlighted in light red in the spectra.
Based on the ability to detect fentanyl and its analogs, the sensitivity of the method was assessed for each of the analytes to determine the limit of detection. With the objective of offering screening capabilities for fentanyl compounds, the limit of detection was experimentally determined by increasingly diluting samples and measuring the response of the band at 1,004 cm−1. This response was tested as the height and area of the peak and compared to the average response of blank samples (n = 4). The limits of detection (LODs) for the analytes were in the low to mid parts-per-billion (4-ANPP = 10 ng/ml; Acetyl, Methoxyacetyl, Valeryl fentanyl, and Fentanyl = 100 ng/ml; Furanyl fentanyl = 300 ng/ml; and Acryl fentanyl = 500 ng/ml). It was interesting to note that the fentanyl analogs did not all exhibit similar sensitivity for the method. Acryl fentanyl and furanyl fentanyl demonstrated the highest LOD values at 500 and 300 ppb, respectively. Observation of their structures indicates that in their amide substitution is the introduction of double bonds (1 in the case of acryl fentanyl and 2 in the case of furanyl fentanyl). The presence of these double bonds may inhibit the molecule’s ability to adsorb to the metal surface or may change the molecule’s orientation when in close proximity to the metal surface, lowering the observed SERS effect. The presence of the conjugated system with a five-member ring may be sufficient to enhance the Raman scattering for furanyl fentanyl more than that of acryl fentanyl. The remaining analytes demonstrated an LOD value of 100 ppb with this EC-SERS method with the exception of 4-ANPP. The LOD of 4-ANPP was 10X lower than fentanyl and was observed to be 10 ppb. One theory for this increased sensitivity may be that the absence of the amide group results in a more linear structure overall and may remove some steric hindrance, allowing the molecule to approach the metal substrate closer, resulting in a larger enhancement in the scattered radiation. Additionally, the now available secondary amine may be able to interact and adsorbed to the silver surface by establishing a bond. The EC-SERS spectra for the experimental LOD determination of 4-ANPP can be seen in Figure 4, where the Raman bands of interest can still be observed at the LOD.
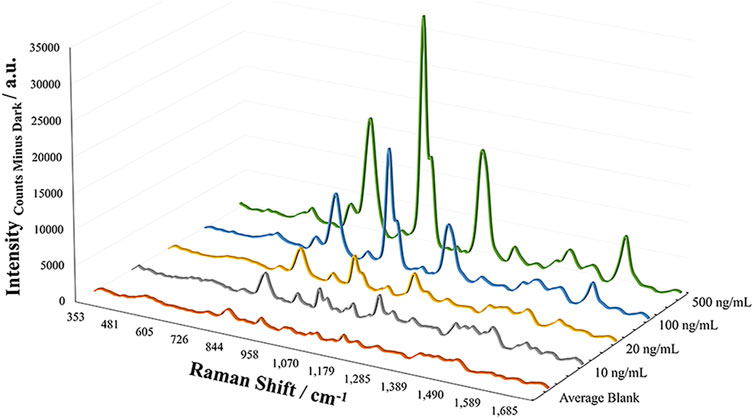
FIGURE 4. EC-SERS spectral overlays demonstrating the LOD studies for 4-ANPP, showing an LOD of 10 ng/ml.
Quantitative Analysis
Assessment of this method for quantitative analysis procedures was next performed. Using the multi-pulse detection method, a calibration curve spanning the range of 0.170 μg/ml to 3.4 μg/ml was established in triplicate for five calibration levels. Good repeatability was observed with an RSD of 14% with excellent linearity demonstrated by an R2 value of 0.99 over the wide linear dynamic range. The calibration curve can be seen in Figure 5 along with test samples. These test samples were prepared to demonstrate the applicability of the quantitative method for fentanyl. Proof of concept was achieved by preparing spiked tap water samples for analysis to represent contaminated water. These samples were prepared at a high concentration of 2.5 μg/ml and a low concentration of 0.47 μg/ml and analyzed in triplicate against the calibration curve. Good accuracy was achieved for the simulated samples with an average reported concentration of 2.77 μg/ml and 0.53 μg/ml for the high and low and representing errors of 9.7 and 12.9%, respectively. These results demonstrated the quantitative ability of this EC-SERS approach for the detection of fentanyl. In addition, the reproducibility of the in-situ SERS substrate preparation was evident from these results with an RSD of 15% calculated from comparison of the slopes of three calibration curves, demonstrating the ability to perform repeatable quantitative SERS/Raman experiments.
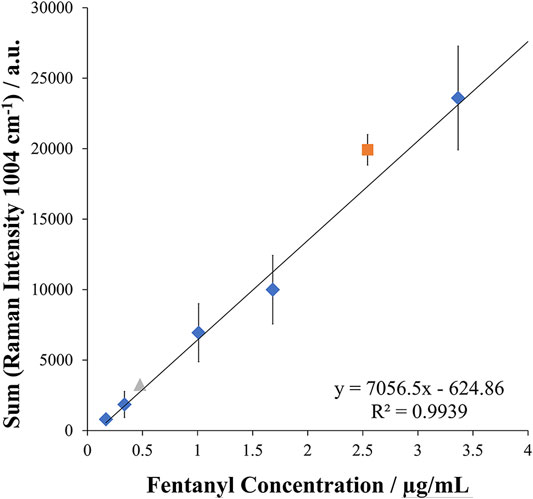
FIGURE 5. Calibration curve and test samples for EC-SERS quantitative analysis of fentanyl in tap water (n = 3 measurements for each point) with test samples assessed at both a high and low concentration in triplicate within the calibration curve. The diamond points represent the concentration levels of the calibration curve, while the triangle and square point represent the spiked samples compared to the curve for the low and high concentration spike, respectively.
Interferences and Simulated Samples
Finally, before the assessment of authentic and simulated samples, interference studies were carried out for analytes commonly encountered with fentanyl in seized street samples. These interferences included heroin, caffeine, cocaine, and methamphetamine. Other interferences were also evaluated including alprazolam, levamisole, acetaminophen, and mephedrone. One advantage of this EC-SERS method over normal Raman analysis is the improved sensitivity of the method to certain analytes compared with the bulk analysis common to normal Raman measurements. Typically, samples containing mixtures of analytes, especially mixtures where one component is the minor contributor, will suffer from the Raman signal being dominated by the major component. However, this is not the case when using this EC-SERS approach as the developed method did not demonstrate a response for acetaminophen, caffeine, heroin, mephedrone, or methamphetamine, allowing for identification of fentanyl in the presence of these interfering compounds. This may be a result of selective adsorption of the fentanyl molecule for the silver substrate, selectivity due to the electrochemical potentials applied, and lack of Raman enhancement for the molecules. This can be seen in Figure 6 for mixtures of fentanyl with heroin, methamphetamine, and caffeine. It is important to note that the fentanyl and caffeine mixture contained less than 5% fentanyl, representing a very low percent by weight contribution. Additionally, since no response was seen for caffeine or heroin, it should be possible to identify the presence of fentanyl or fentanyl analogs at lower concentrations than 5% making this method extremely desirable for street samples of seized drugs as they generally contain small amounts of fentanyl and for seizures containing high concentrations or pure samples of fentanyl.
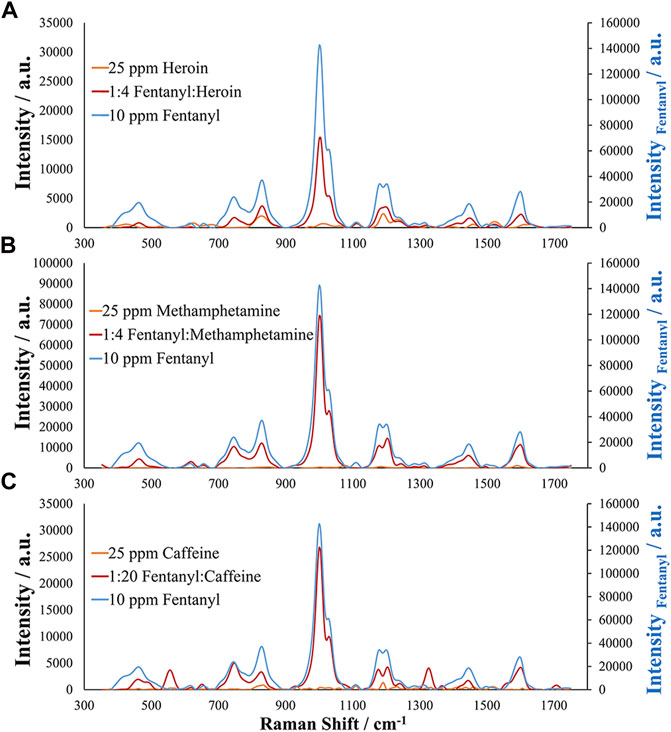
FIGURE 6. EC-SERS analysis of simulated seized drug samples and different mixture ratios by weight for (A) 1:4 Fentanyl to Heroin, (B) 1:4 Fentanyl to Methamphetamine, and (C) 1:20 Fentanyl to Caffeine (<5% fentanyl). Note that the secondary axis is for fentanyl, demonstrating higher sensitivity than the other analytes.
The other interfering compounds tested demonstrated some response using the method. Cocaine resulted in an EC-SERS spectrum with the same main Raman band but other bands that differed from that of fentanyl. However, when assessed in a 1:4 mixture of fentanyl to cocaine, the method demonstrated preference toward the fentanyl molecule, allowing the fentanyl EC-SERS spectrum to be resolved from that of the cocaine spectrum, providing identification of fentanyl. In the cases of alprazolam and levamisole, the EC-SERS spectra of the two molecules demonstrated differing Raman bands from that of fentanyl. In addition, the sensitivity of the two analytes was smaller than that for fentanyl and are not as commonly associated with fentanyl in street samples. Supplementary Figure S3 provides the EC-SERS results for these interfering compounds.
Mentioned previously, an interesting result using this method is the preference, and therefore selectivity, for fentanyl compared to other analytes. Although several analytes tested demonstrated an EC-SERS response, when present with fentanyl in a mixture, the resulting EC-SERS spectrum was dominated by Raman shifts associated only with the fentanyl structure. This was true even at very dilute mixtures. Toward the demonstration of this selectivity, several other mixtures and possible interfering compounds were tested. Firstly, heroin samples containing low percentages of fentanyl are common in the seized drug landscape. Therefore, several fentanyl to heroin mixtures were assessed. These mixtures were simulated using liquid standards and combined in a part-to-part format to form mixture ratios of fentanyl to heroin of 1:20 (5%), 1:50 (2%), and 1:100 (1%). The resulting spectra were compared against the average blank signal to determine that the resulting spectrum was above the LOD established previously. Fentanyl was successfully and clearly identified down to the 1% contribution and suggests that lower detection may be possible (Supplementary Figure S4).
Three other analytes were chosen for analysis due to their combination with fentanyl. However, while the previous analytes are commonly encountered in street samples, the following interferents were chosen due to their presence in biological samples as a result of treating overdose victims: Buprenorphine, naltrexone, and naloxone. These analytes are common in medication-assisted treatment (MAT) and for preventing opioid overdose and represent opioid receptor antagonists (naloxone and naltrexone) and partial agonist (buprenorphine) drugs (Medication-Assisted Treatment, 2021). Due to their common presence with fentanyl in biological samples, interference studies were conducted for these drugs as well. Figure 7A demonstrates the EC-SERS spectra for high concentrations of the pure analytes. Both naloxone and buprenorphine did not demonstrate SERS activity using this method, but naltrexone demonstrated large SERS response. The naltrexone response is significantly different from that of fentanyl with several main Raman bands observed. However, as demonstrated in previous examples, this method is specific for fentanyl. Therefore, various mixture ratios of fentanyl with naltrexone were assessed. Figures 7B–D provides evidence toward the specificity of this method for fentanyl since at all ratios the majority of signals obtained for the samples were that of fentanyl. This result supports the importance of a potential selective adsorption of fentanyl on the roughened silver electrode surface, allowing fentanyl to exhibit the SERS effect while suppressing the response from naltrexone. These samples provide evidence for the selective adsorption of fentanyl and the presence of a competitive adsorption process occurring. The Raman spectrum of the fentanyl:naltrexone mixture undergoes small changes as the amount of fentanyl in the sample decreases. These changes can be seen at Raman shifts of approximately 1,114, 1,195, 1,234, 1,527, and 1,630 cm−1. The increase in intensity of these bands and change in shape of some bands in relation to the fentanyl spectrum provides evidence of a competitive adsorption process between fentanyl and naltrexone, where fentanyl outcompetes naltrexone for adsorption. The presence of these Raman bands suggests that the slight differences in the spectrum may be a result of the close proximity of the two molecules on the substrate surface or adsorption of one molecule on top of the other, altering the observed Raman scattering. Regardless, the high preference for fentanyl over the many potential interferences demonstrates the strength of the developed targeted EC-SERS method.
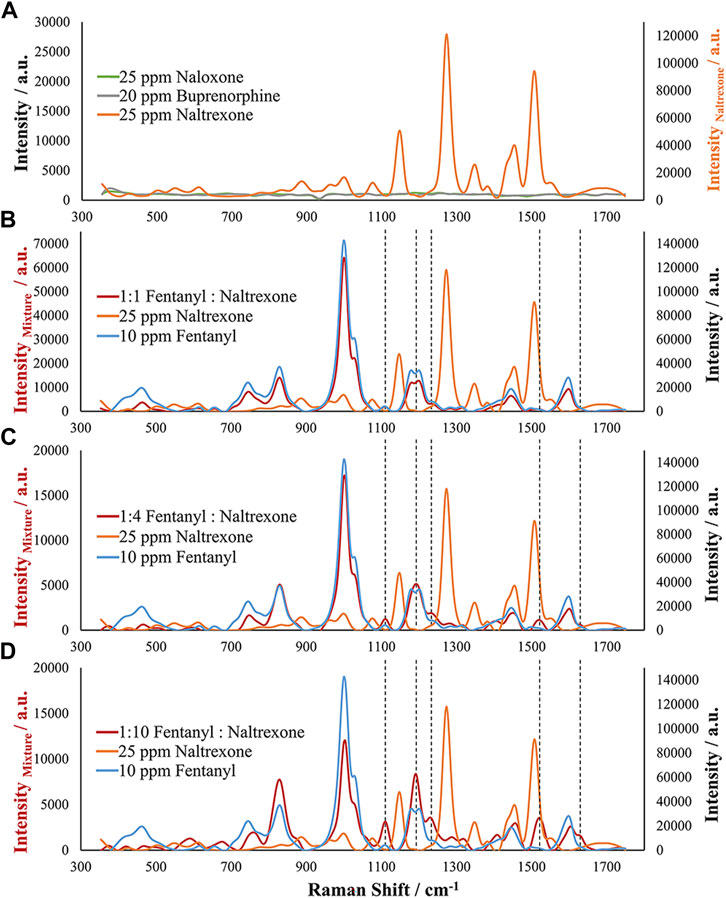
FIGURE 7. EC-SERS analysis of (A) Naloxone, Buprenorphine, and Naltrexone as potential interfering compounds and simulated mixture samples of fentanyl and naltrexone containing (B) 1:1 Fentanyl to Naltrexone, (C) 1:4 Fentanyl to Naltrexone, and (D) 1:10 Fentanyl to Naltrexone compared to the pure compounds. Note the differences in the primary and secondary axes between (A) and (B–D).
Conclusion
The development of an in-situ EC-SERS detection method for fentanyl and its analogs was achieved with low limits of detection and minimal interference from other expected compounds. To our knowledge, this is the first report of EC-SERS being used for the detection of fentanyl, representing a novel application of the technology and facilitating a rapid, sensitive, and efficient detection platform for seized drugs of abuse. It was demonstrated that informative Raman bands were present, allowing for identification of fentanyl and differentiation of several amide-substituted fentanyl analogs. In addition, the low detection capability of 4-ANPP is desirable as this compound is a known precursor material and a metabolite of fentanyl. The applications of this method toward screening seized drugs of abuse are apparent with the simulated case samples containing fentanyl as the minor contributor mixed with other common substances. This method was able to identify fentanyl in all the samples. Moreover, a low percent by weight contribution of fentanyl provided identifying and characteristic EC-SERS bands during the analysis, resulting in identification of fentanyl in a mixture ratio of less than 5% fentanyl by weight and as low as 1% fentanyl. Indeed, the quantitative ability of this EC-SERS method was examined. The in-situ preparation of the SERS substrate demonstrated the reproducible nature of this method and resulted in the generation of a calibration curve with a linear dynamic range between 0.17 μg/ml and 3.4 μg/ml with an R2 value of 0.99. The accuracy of this quantitative method was tested with low percent errors, providing evidence for the possibility of providing quantitative information along with the identification of fentanyl.
The highly selective nature of this method for analyzing fentanyl in the presence of several interfering compounds including heroin, cocaine, and methamphetamine, represents a powerful application for screening seized drugs of abuse at the laboratory and at the crime scene. This will serve to improve the safety of laboratory and crime scene personnel, provide case triage, and inform analytical protocols for the analysis of samples. In addition, the lack of interference from medications such as naloxone, buprenorphine, and naltrexone presents the possibility of future applications of this method for the analysis of biological specimens for fentanyl. Future work will focus on altering these methodologies created for the screening of seized drugs of abuse to apply this technique to toxicological matrices such as oral fluid and urine to provide rapid screening for fentanyl and fentanyl analogs. Environmental applications will be further explored due to the ability to detect fentanyl in the spiked water samples. The analysis of water from treatment plants and environmental sources presents opportunities to trace the use and presence of these potent drugs within the population and communities.
Data Availability Statement
The raw data supporting the conclusions of this article will be made available by the authors, without undue reservation once the data enters the agency repository.
Author Contributions
CO: Conceptualization, Formal Analysis, Investigation, Methodology, Writing—original draft/review and editing, Visualization. MP-E: Conceptualization, Methodology, Writing—review and editing. SH: Conceptualization, Methodology, Writing—review and editing. KK: Investigation, Writing—review and editing. KD: Methodology, Investigation, Writing—review and editing. MA-M: Resources, Supervision. AH: Resources, Supervision, Writing—review and editing. AC: Conceptualization, Formal Analysis, Methodology, Resources, Supervision, Writing—review and editing. LA: Conceptualization, Formal Analysis, Funding Acquisition, Project Administration, Resources, Supervision, Writing—review and editing.
Funding
This work was funded by the National Institute of Justice award number 2019-DU-BX-0030 to West Virginia University. The opinions, findings, and conclusion are those of the authors and do not necessarily reflect those of the Department of Justice.
Conflict of Interest
The authors declare that the research was conducted in the absence of any commercial or financial relationships that could be construed as a potential conflict of interest.
Publisher’s Note
All claims expressed in this article are solely those of the authors and do not necessarily represent those of their affiliated organizations, or those of the publisher, the editors and the reviewers. Any product that may be evaluated in this article, or claim that may be made by its manufacturer, is not guaranteed or endorsed by the publisher.
Acknowledgments
The authors would like to acknowledge support from graduate research students Travon Cooman and Alexis Wilcox for contributions made to this project in the form of sample preparation and analysis. We would also like to thank Josh Motter and Josh Motter Welding for providing supplies and fabrication. Additionally, we acknowledge the use of the WVU Shared Research Facilities.
Supplementary Material
The Supplementary Material for this article can be found online at: https://www.frontiersin.org/articles/10.3389/frans.2022.834820/full#supplementary-material
References
Ameku, W. A., De Araujo, W. R., Rangel, C. J., Ando, R. A., and Paixão, T. R. L. C. (2019). Gold Nanoparticle Paper-Based Dual-Detection Device for Forensics Applications. ACS Appl. Nano Mater. 2, 5460–5468. doi:10.1021/acsanm.9b01057
Andreou, C., Hoonejani, M. R., Barmi, M. R., Moskovits, M., and Meinhart, C. D. (2013). Rapid Detection of Drugs of Abuse in Saliva Using Surface Enhanced Raman Spectroscopy and Microfluidics. ACS Nano 7, 7157–7164. doi:10.1021/nn402563f
Bell, S. E. J., Burns, D. T., Dennis, A. C., and Speers, J. S. (2000). Rapid Analysis of Ecstasy and Related Phenethylamines in Seized Tablets by Raman Spectroscopy. Analyst 125, 541–544. doi:10.1039/a908091k
Bindesri, S. D., Jebailey, R., Albarghouthi, N., Pye, C. C., and Brosseau, C. L. (2020). Spectroelectrochemical and computational studies of tetrahydrocannabinol (THC) and carboxy-tetrahydrocannabinol (THC-COOH). Analyst 45, 1849–1857. doi:10.1039/c9an02173f
Chen, H.-Y., Lin, M.-H., Wang, C.-Y., Chang, Y.-M., and Gwo, S. (2015). Large-Scale Hot Spot Engineering for Quantitative SERS at the Single-Molecule Scale. J. Am. Chem. Soc. 137, 13698–13705. doi:10.1021/jacs.5b09111
Cooman, T., Ott, C. E., Dalzell, K. A., Burns, A., Sisco, E., and Arroyo, L. E. (2021). Screening of Seized Drugs Utilizing Portable Raman Spectroscopy and Direct Analysis in Real Time-Mass Spectrometry (DART-MS). Forensic Chem. 25, 100352. doi:10.1016/j.forc.2021.100352
D’Elia, V., Rubio-Retama, J., Ortega-Ojeda, F. E., García-Ruiz, C., and Montalvo, G. (2018). Gold Nanorods as SERS Substrate for the Ultratrace Detection of Cocaine in Non-pretreated Oral Fluid Samples. Colloids Surf. A: Physicochem. Eng. Aspects 557, 43–50. doi:10.1016/j.colsurfa.2018.05.068
Farquharson, S., and Lee, V. Y. (2000). Trace Drug Analysis by Surface-Enhanced Raman Spectroscopy. Biochem. Biomol. Sens. 4200, 89–95. doi:10.1117/12.411716
Farquharson, S., Shende, C., Sengupta, A., Huang, H., and Inscore, F. (2011). Rapid Detection and Identification of Overdose Drugs in Saliva by Surface-Enhanced Raman Scattering Using Fused Gold Colloids. Pharmaceutics 3, 425–439. doi:10.3390/pharmaceutics3030425
Faulds, K., Smith, W. E., Graham, D., and Lacey, R. J. (2002). Assessment of Silver and Gold Substrates for the Detection of Amphetamine Sulfate by Surface Enhanced Raman Scattering (SERS). Analyst 127, 282–286. doi:10.1039/b107318b
Fleischmann, M., Hendra, P. J., and McQuillan, A. J. (1974). Raman Spectra of Pyridine Adsorbed at a Silver Electrode. Chem. Phys. Lett. 26, 163–166. doi:10.1016/0009-2614(74)85388-1
Gerace, E., Seganti, F., Luciano, C., Lombardo, T., Di Corcia, D., Teifel, H., et al. (2019). On-site Identification of Psychoactive Drugs by Portable Raman Spectroscopy during Drug-Checking Service in Electronic Music Events. Drug Alcohol. Rev. 38, 50–56. doi:10.1111/dar.12887
Haddad, A., Comanescu, M. A., Green, O., Kubic, T. A., and Lombardi, J. R. (2018). Detection and Quantitation of Trace Fentanyl in Heroin by Surface-Enhanced Raman Spectroscopy. Anal. Chem. 90, 12678–12685. doi:10.1021/acs.analchem.8b02909
Han, S., Zhang, C., Lin, S., Sha, X., and Hasi, W. (2021). Sensitive and Reliable Identification of Fentanyl Citrate in Urine and Serum Using Chloride Ion-Treated Paper-Based SERS Substrate. Spectrochim. Acta A: Mol. Biomol. Spectrosc. 251, 119463. doi:10.1016/j.saa.2021.119463
Hernández, C. N., Martín-Yerga, D., González-García, M. B., Hernández-Santos, D., and Fanjul-Bolado, P. (2018). Evaluation of Electrochemical, UV/VIS and Raman Spectroelectrochemical Detection of Naratriptan with Screen-Printed Electrodes. Talanta 178, 85–88. doi:10.1016/j.talanta.2017.09.004
Hernandez, S., Perales-rondon, J. V., Arnaiz, A., Perez-estebanez, M., Gomez, E., Colina, A., et al. (2020). Determination of Nicotinamide in a Multivitamin Complex by Electrochemical-Surface Enhanced Raman Spectroscopy. J. Electroanalytical Chem. 879, 114743–116657. doi:10.1016/j.jelechem.2020.114743
Ibáñez, D., Pérez-Junquera, A., González-García, M. B., Hernández-Santos, D., and Fanjul-bolado, P. (2020). Spectroelectrochemical Elucidation of B Vitamins Present in Multivitamin Complexes by EC-SERS. Talanta 206, 120190–120196. doi:10.1016/j.talanta.2019.120190
Ibáñez, D., González-García, M. B., Hernández-Santos, D., and Fanjul-bolado, P. (2021). Detection of dithiocarbamate, chloronicotinyl and organophosphate pesticides by electrochemical activation of SERS features of screen-printed electrodes. Spectrochim Acta - Part A Mol. Biomol. Spectrosc. 248, 1–7. doi:10.1016/j.saa.2020.119174
Inscore, F., Shende, C., Sengupta, A., Huang, H., and Farquharson, S. (2011). Detection of Drugs of Abuse in Saliva by Surface-Enhanced Raman Spectroscopy (SERS). Appl. Spectrosc. 65, 1004–1008. doi:10.1366/11-06310
Jiménez-Pérez, R., Sevilla, J. M., Pineda, T., Blázquez, M., and Gonzalez-Rodriguez, J. (2016a). Comparative Study of γ-hidroxybutiric Acid (GHB) and Other Derivative Compounds by Spectroelectrochemistry Raman (SERS) on Platinum Surface. Electrochim. Acta 193, 154–159. doi:10.1016/j.electacta.2016.02.041
Jiménez-Pérez, R., Sevilla, J. M., Pineda, T., Blázquez, M., and Gonzalez-Rodriguez, J. (2016b). Study of the Electro-Oxidation of a Recreational Drug GHB (Gamma Hydroxybutyric Acid) on a Platinum Catalyst-type Electrode through Chronoamperometry and Spectro-Electrochemistry. J. Electroanal. Chem. 766, 141–146. doi:10.1016/j.jelechem.2016.02.005
Langer, J., Jimenez de Aberasturi, D., Aizpurua, J., Alvarez-Puebla, R. A., Auguié, B., Baumberg, J. J., et al. (2020). Present and Future of Surface-Enhanced Raman Scattering. ACS Nano 14, 28–117. doi:10.1021/acsnano.9b04224
Lanzarotta, A., Witkowski, M., and Batson, J. (2020). Identification of Opioids and Related Substances Using Handheld Raman Spectrometers. J. Forensic Sci. 65, 421–427. doi:10.1111/1556-4029.14217
Leonard, J., Haddad, A., Green, O., Birke, R. L., Kubic, T., Kocak, A., et al. (2017). SERS , Raman , and DFT Analyses of Fentanyl and Carfentanil: Toward Detection of Trace Samples. J. Raman Spectrosc. 48, 1323–1329. doi:10.1002/jrs.5220
Lin-Vien, D., Norman, C., William, F., and Grasselli, J. (1991). The Handbook of Infrared and Raman Characteristic Frequencies of Organic Molecules. San Diego: Academic Press.
Mabbott, S., Correa, E., Cowcher, D. P., Allwood, J. W., and Goodacre, R. (2013). Optimization of Parameters for the Quantitative Surface-Enhanced Raman Scattering Detection of Mephedrone Using a Fractional Factorial Design and a Portable Raman Spectrometer. Anal. Chem. 85, 923–931. doi:10.1021/ac302542r
Martín-Yerga, D., Pérez-Junquera, A., González-García, M. B., Perales-Rondon, J. V., Heras, A., Colina, A., et al. (2018a). Quantitative Raman Spectroelectrochemistry Using Silver Screen-Printed Electrodes. Electrochimica Acta 264, 183–190. doi:10.1016/j.electacta.2018.01.060
Martín-Yerga, D., Pérez-Junquera, A., Hernández-Santos, D., and Fanjul-Bolado, P. (2018b). In Situ Activation of Thick-Film Disposable Copper Electrodes for Sensitive Detection of Malachite Green Using Electrochemical Surface-Enhanced Raman Scattering (EC-SERS). Electroanalysis 30, 1095–1099. doi:10.1002/elan.201800023
O'Connell, M.-L., Ryder, A. G., Leger, M. N., and Howley, T. (2010). Qualitative Analysis Using Raman Spectroscopy and Chemometrics: A Comprehensive Model System for Narcotics Analysis. Appl. Spectrosc. 64, 1109–1121. doi:10.1366/000370210792973541
Omar, J., Slowikowski, B., Guillou, C., Reniero, F., Holland, M., and Boix, A. (2019). Identification of New Psychoactive Substances (NPS) by Raman Spectroscopy. J. Raman Spectrosc. 50, 41–51. doi:10.1002/jrs.5496
Rana, V., Cañamares, M. V., Kubic, T., Leona, M., and Lombardi, J. R. (2011). Surface-enhanced Raman Spectroscopy for Trace Identification of Controlled Substances: Morphine, Codeine, and Hydrocodone. J. Forensic Sci. 56, 200–207. doi:10.1111/j.1556-4029.2010.01562.x
Robinson, A. M., Harroun, S. G., Bergman, J., and Brosseau, C. L. (2012). Portable Electrochemical Surface-Enhanced Raman Spectroscopy System for Routine Spectroelectrochemical Analysis. Anal. Chem. 84, 1760–1764. doi:10.1021/ac2030078
Sägmüller, B., Schwarze, B., Brehm, G., and Schneider, S. (2001). Application of SERS Spectroscopy to the Identification of (3,4-Methylenedioxy)Amphetamine in Forensic Samples Utilizing Matrix Stabilized Silver Halides. Analyst 126, 2066–2071. doi:10.1039/b105321n
Shende, C., Brouillette, C., and Farquharson, S. (2019a). Detection of Codeine and Fentanyl in Saliva, Blood Plasma and Whole Blood in 5-minutes Using a SERS Flow-Separation Strip. Analyst 144, 5449–5454. doi:10.1039/c9an01087d
Shende, C., Farquharson, A., Brouillette, C., Smith, W., and Farquharson, S. (2019b). Quantitative Measurements of Codeine and Fentanyl on a Surface-Enhanced Raman-Active Pad Test. Molecules 24, 2578–8. doi:10.3390/molecules24142578
Sivashanmugan, K., Zhao, Y., and Wang, A. X. (2019). Tetrahydrocannabinol Sensing in Complex Biofluid with Portable Raman Spectrometer Using Diatomaceous SERS Substrates. Biosensors 9, 125. doi:10.3390/bios9040125
Smith, M., Logan, M., Bazley, M., Blanchfield, J., Stokes, R., Blanco, A., et al. (2021). A Semi‐quantitative Method for the Detection of Fentanyl Using Surface‐enhanced Raman Scattering (SERS) with a Handheld Raman Instrument. J. Forensic Sci. 66, 505–519. doi:10.1111/1556-4029.14610
Medication-Assisted Treatment (2021). Substance Abuse and Mental Health Services Administration: U.S. Department of Health and Human Services. Rockville, MD. Available at: https://www.samhsa.gov/medication-assisted-treatment (Accessed October 13, 2021).
SWGDRUG (2019). Scientific Working Group for the Analysis of Seized Drugs (SWGDRUG) Recommendations. Available at: www.swgdrug.org (Accessed September 15, 2021).
U.S. Drug Enforcement Administration Diversion Control Division (2018). National Forensic Laboratory Information System: NFLIS-Drug 2017 Annual Report. Springfield, VA. Available at: https://www.nflis.deadiversion.usdoj.gov/publicationsRedesign.xhtml?jfwid=Xq3OmKEsyhuj4k84v1fTqFITjwC5HTxB6IDDNXLg:0 (Accessed September 15, 2021).
U.S. Drug Enforcement Administration Diversion Control Division (2019). National Forensic Laboratory Information System: NFLIS-DRUG 2018 Annual Report. Springfield, VA. Available at: https://www.nflis.deadiversion.usdoj.gov/publicationsRedesign.xhtml?jfwid=Xq3OmKEsyhuj4k84v1fTqFITjwC5HTxB6IDDNXLg:0 (Accessed September 15, 2021).
U.S. Drug Enforcement Administration Diversion Control Division (2020). National Forensic Laboratory Information System: NFLIS-Drug 2019 Annual Report. Springfield, VA. Available at: https://www.nflis.deadiversion.usdoj.gov/publicationsRedesign.xhtml?jfwid=Xq3OmKEsyhuj4k84v1fTqFITjwC5HTxB6IDDNXLg:0 (Accessed December 09, 2020).
U.S. Drug Enforcement Administration Diversion Control Division (2021). National Forensic Laboratory Information System: NFLIS-Drug 2020 Mid-year Report. Springfield, VA. Available at: https://www.nflis.deadiversion.usdoj.gov/publicationsRedesign.xhtml?jfwid=Xq3OmKEsyhuj4k84v1fTqFITjwC5HTxB6IDDNXLg:0 (Accessed September 15, 2021).
Wang, L., Deriu, C., Wu, W., Mebel, A. M., and McCord, B. (2019). Surface‐enhanced Raman Spectroscopy, Raman, and Density Functional Theoretical Analyses of Fentanyl and Six Analogs. J. Raman Spectrosc. 50, 1405–1415. doi:10.1002/jrs.5656
Wang, H., Xue, Z., Wu, Y., Gilmore, J., Wang, L., and Fabris, L. (2021a). Rapid SERS Quantification of Trace Fentanyl Laced in Recreational Drugs with a Portable Raman Module. Anal. Chem. 93, 9373–9382. doi:10.1021/acs.analchem.1c00792
Wang, L., Vendrell-Dones, M. O., Deriu, C., Doğruer, S., de B. HarringtonHarrington, P. P., and McCord, B. (2021b). Multivariate Analysis Aided Surface-Enhanced Raman Spectroscopy (MVA-SERS) Multiplex Quantitative Detection of Trace Fentanyl in Illicit Drug Mixtures Using a Handheld Raman Spectrometer. Appl. Spectrosc. 75, 1225–1236. doi:10.1177/00037028211032930
Wilson, N. G., Raveendran, J., and Docoslis, A. (2021). Portable Identification of Fentanyl Analogues in Drugs Using Surface-Enhanced Raman Scattering. Sensors Actuators B: Chem. 330, 129303. doi:10.1016/j.snb.2020.129303
Wu, D.-Y., Li, J.-F., Ren, B., and Tian, Z.-Q. (2008). Electrochemical Surface-Enhanced Raman Spectroscopy of Nanostructures. Chem. Soc. Rev. 37, 1025–1041. doi:10.1039/b707872m
Keywords: electrochemical-surface enhanced Raman spectroscopy (EC-SERS), fentanyl, fentanyl analogs, seized drugs of abuse, forensics, drug screening, drug mixtures
Citation: Ott CE, Perez-Estebanez M, Hernandez S, Kelly K, Dalzell KA, Arcos-Martinez MJ, Heras A, Colina A and Arroyo LE (2022) Forensic Identification of Fentanyl and its Analogs by Electrochemical-Surface Enhanced Raman Spectroscopy (EC-SERS) for the Screening of Seized Drugs of Abuse. Front. Anal. Sci. 2:834820. doi: 10.3389/frans.2022.834820
Received: 13 December 2021; Accepted: 12 January 2022;
Published: 10 February 2022.
Edited by:
Entesar Al-Hetlani, Kuwait University, KuwaitReviewed by:
Reza Salemmilani, Twist Bioscience, United StatesVenugopal Rao Soma, University of Hyderabad, India
Copyright © 2022 Ott, Perez-Estebanez, Hernandez, Kelly, Dalzell, Arcos-Martinez, Heras, Colina and Arroyo. This is an open-access article distributed under the terms of the Creative Commons Attribution License (CC BY). The use, distribution or reproduction in other forums is permitted, provided the original author(s) and the copyright owner(s) are credited and that the original publication in this journal is cited, in accordance with accepted academic practice. No use, distribution or reproduction is permitted which does not comply with these terms.
*Correspondence: Luis E. Arroyo, Luis.arroyo@mail.wvu.edu