Effect of Rehydration on the Performance of Mechanically Loaded UHPC
 Yue Wang
 Mingzhe An
 - School of Civil Engineering, Beijing Jiaotong University, Haidian District, Beijing, China
Unhydrated cementitious materials in ultrahigh-performance concrete (UHPC) with a low water-to-binder ratio stop hydrating owing to water shortage but can continue to hydrate after re-exposure to water; this phenomenon is referred to as rehydration. This article discusses the effects of rehydration on the performance of mechanically loaded UHPC when subjected to continuous water exposure. For this purpose, UHPCs with a steel fiber content of 0 and 2% were prepared with a constant water–binder ratio of 0.20. A uniaxial compression load was applied to generate microcracks in the UHPC, where cube specimens were preloaded up to 50, 70, 90, and 100% of the ultimate compressive load. After preloading, UHPC specimens were stored in water for 90 days. Preloading is found to have a more significant effect on the splitting tensile strength than on the compressive strength. At different preload levels, the splitting tensile strength first increases and then decreases with increasing water curing time. The cumulative capillary water absorption decreases with increasing water curing time, and the percentage decrease increases with an increasing preload level. The chemically bound water content increases with increasing water curing time, and the increase becomes more significant at a higher preload level. The filling effect of the rehydration reduces the connectivity of the internal pores, which is the main reason for the increase in strength and decrease in permeability observed under water curing. These results provide a foundation for the application and life-cycle design of UHPC structures over long service periods in water environments.
1 Introduction
Ultrahigh-performance concrete (UHPC) shows excellent mechanical properties (Long, 2004; Huang et al., 2021a; Mo et al., 2021), excellent durability (Matte and Moranville, 1999), and good workability (Huang et al., 2021b), which gives it a wide range of applicability. A high cement content and low water-to-binder ratio are essential to ensuring the quality of UHPC (Randl et al., 2014). However, one problem that cannot be ignored is that UHPC still contains a large amount of unhydrated cementitious material after steam curing, which can rehydrate upon penetration of external moisture into the concrete structure during service. Vandamme et al. (2010) used the nanoindentation technology to study the content of unhydrated cement particles in samples with different water–binder ratios. Among them, the content of unhydrated cement particles in cement paste samples with a water–binder ratio of 0.15 reached as high as 41%, whereas the content in cement paste samples with a water–binder ratio of 0.20 reached 30%. The rehydration problem is significant for concrete structures with a low water-to-binder ratio that serve in a moist environment for an extended period, and it must be considered deeply.
At present, the effects of rehydration on concrete performance can be divided into three categories: First, the strength of a specimen cured in a moist environment increases with increasing curing time, which is known as the enhancement effect. Yang and Huang (2003) soaked reactive powder concrete in artificial seawater and tap water for 180 days each. Their results showed that both the compressive and flexural strength show higher values than those before soaking. The second effect of rehydration on concrete performance is the damage effect. Continued hydration of unhydrated cement produces new hydration products; the volume expansion of the new products generates and spreads new microcracks, which reduces the strength. Liu (2016) showed that a large amount of microcracks are produced after 80 days of rehydration at a temperature of 80°C; this leads to a 17.0% decrease in the compressive strength compared with the strength after rehydration for 21 days. Guan et al. (2004); Yang and Guan (2004); Yang et al. (2007) proved that a large amount of unhydrated cementitious materials is present in concrete with a water-to-cement ratio of 0.28, which can generate products because of the rehydration reaction. The damage caused by the expansion of the rehydration products can significantly decrease the compressive strength. A lower water-to-binder ratio for concrete can lead to a more significant decrease in compressive strength with rehydration. This damage can be effectively inhibited by mixing fly ash and slag. Hillermeier and Schroeder (1995) accelerated the hydration of high-performance concrete with a water-to-cement ratio of 0.3 and a water temperature of 90°C. After 7 days of rehydration, visible cracks were observed on the surface of the specimens. The third effect of rehydration also enhances the performance of concrete via healing defects. Liu et al. (2005) studied the effect of the damage degree on the self-healing ability of concrete. Their results showed that the self-healing ability decreases with an increase in the damage degree. The strength of damaged concrete at an early age can be restored to that of undamaged concrete with rehydration. Yao and Zhong (2006) showed that the self-healing behavior of damaged concrete is caused by the rehydration of unhydrated cement particles. A critical value for the damage degree was identified; below this critical value, the self-healing effect increases with the damage degree, and above the critical value, the self-healing effect is not significant with aggravated damage. Zhu et al. (2012) studied the performance changes for ECCs damaged by preloading after freeze–thaw cycles, and the results showed that rehydration in freeze–thaw cycles can repair the cracks produced by preloading to a certain extent. When the preload tensile strain is less than 1.5%, the capillary water absorption coefficient of ECCs after freeze–thaw cycles is similar to that without freeze–thaw cycling. The research results of Kan and Shi (2012) showed that after 90 days of dry–wet cycling, the ECC compressive strength of preload damage was higher than that before the dry–wet cycle, which is due to the repair of internal defects and pores by rehydration products (including fibrous C-S-H gel and CaCO3). Ersan et al. (2018) reported that calcium carbonate, in the form of calcite and aragonite, is the major constituent of the healing material. Didier and Nele (2019) reported that healing is governed by further hydration and calcium carbonate crystallization at an early age, and the main autogenous healing mechanism involves calcium carbonate crystallization from 3 months onward. From the previous finding, it can be seen that the concrete structure with a low water–binder ratio serving in a water environment for an extended period leads to an obvious rehydration problem (Dils et al., 2013), which needs further study.
The effect of rehydration on the long-term performance of concrete is complicated, and the mechanism needs to be clarified. In this study, UHPC was subjected to uniaxial preloading with different preload levels. Then, the effect of rehydration on the mechanical properties, capillary water absorption characteristics, and chemically bound water content of UHPC with and without fly ash were studied at different preload levels. The mechanism for the effects of rehydration on the concrete performance was analyzed.
2 Experimental
2.1 Mix Proportion
This study used P·O42.5 ordinary Portland cement; micro-silica powder with an average particle diameter of 0.31 µm; non-naphthalene-based superplasticizer with a water reduction rate of 30% and solid content of 40%; quartz sand with diameters of 0.16–0.315, 0.315–0.63, and 0.63–1.25 mm at a blending ratio of 2:4:1 as the aggregate; and copper-plated short and fine steel fibers with a diameter of 0.22 mm, length of 13 mm, and tensile strength of 2.8 GPa. The specific mix proportion is presented in Table 1.
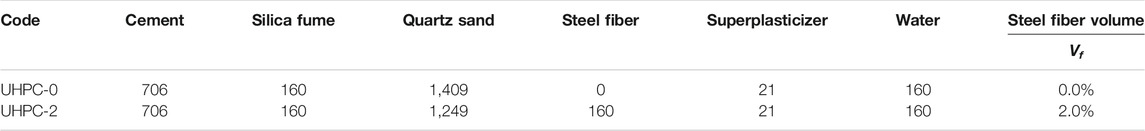
TABLE 1. Mix proportion (kg/m3).
2.2 Test Methods
Cubes with dimensions of 100 mm × 100 mm × 100 mm were produced as specimens. After molding for 24 h, the specimens were removed and placed in a steam curing box, which was then kept at 75°C for 68 h. Next, the specimens were cooled to room temperature and placed in a standard curing room for 28 days. The heating and cooling rates were both 15°C/h.
Uniaxial compression loads with different preload levels (0, 50, 70, 90, and 100% of the ultimate compressive load determined at 28 days) were applied to cube UHPC specimens. The preload levels for UHPC-0 were 0, 50, 70, and 90%. As the steel fiber can increase the toughness of UHPC, UHPC-2 can remain intact after a 100% preload level is applied. For a preload level of 50%, the specimens will remain in the elastic stage without any microcracks inside. Therefore, the preload levels of 0, 70, and 100% were used for UHPC-2.
A simulated rehydration test was carried out by water curing, and the specimens were placed at a constant temperature of 30°C after preloading. During the testing process, the upper surface of the water was always kept 5 cm higher than the surface of the specimens. The compressive strength, splitting tensile strength, capillary water absorption characteristics, and chemically bound water content of the UHPC were measured at different water curing times. The compressive strength and splitting tensile strength were tested in accordance with GB/T 50081. The direction of load application was always kept consistent with the preload when testing the strength after preloading and after water curing.
The capillary water absorption test was based on ASTM C 1585. After water curing, the specimens were placed in an oven at 105°C and dried to a constant weight. After being removed from the oven, the specimens were sealed on four sides with paraffin and weighed to a precision of 0.1 g after cooling to room temperature. Then, the specimens were placed in water at a constant temperature of 20 ± 1°C. The testing surface was kept facing down, and the water level was kept 5 mm higher than the bottom of the specimens during the testing process. The moisture on the test surface was wiped off with a damp cloth every 15 min, after which the specimens were then weighed immediately. The process was completed within 30 s, and the total testing time was 510 min. A schematic diagram of the water absorption test is shown in Figure 1.
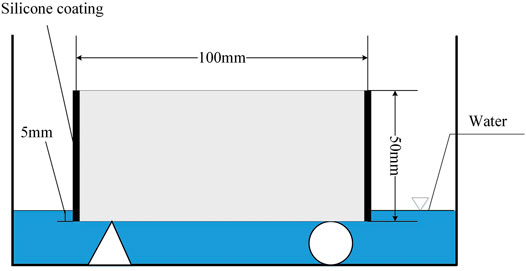
FIGURE 1. Schematic diagram of the water absorption test.
The chemically bound water was measured with the loss on ignition method. First, 10 g of powder with a depth of 5–20 mm from the surface of the specimens was selected, and the burning temperature was 950 °C. The chemically bound water content wne was calculated as follows (Ersan et al., 2018):
where w1 and w2 are the weights of the specimens before and after ignition, respectively, and rfc is the total loss-on-ignition for all ingredients.
where pf, pc, and ps are the weight fractions of silica fume, cement, and superplasticizer (solid part), respectively, and rf, rc, and rs are the loss-on-ignition of the silica fume, cement, and superplasticizer, respectively.
The hydration degree can be calculated according to the chemically bound water content using Equation 3. The percentage increase of chemically bound water is equal to the percentage increase in hydration degree.
where wnei is the chemically bound water content at time i, and wne∞ is the chemically bound water content of the fully hydrated specimen, which is a constant for a certain mixture.
3 Results
3.1 Effect of the Preload Level on the Unhealed Specimens
Table 2 presents the mechanical and capillary water absorption properties of UHPC specimens at 28 days that were previously preloaded to 50, 70, 90, or 100% of their compressive strength. The properties of virgin (preload level of 0%) specimens are also included in this table. As these specimens were tested immediately after preloading, they had no time to undergo any crack healing.
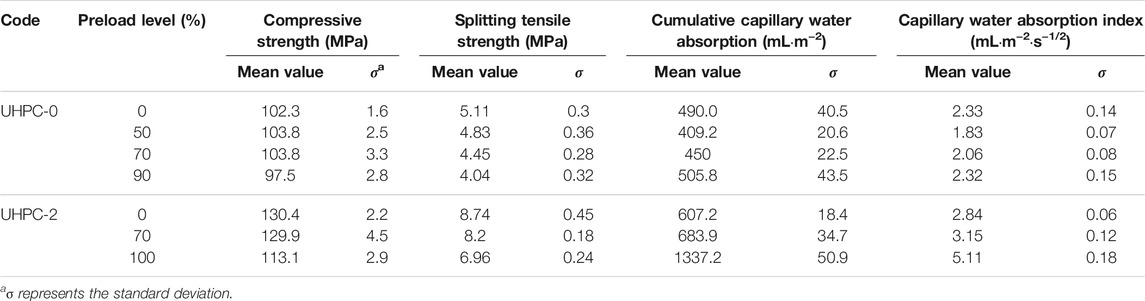
TABLE 2. Mechanical and capillary water absorption properties of specimens after preloading.
The results reveal that for the specimens that were not preloaded, the strength of UHPC-2 is much higher than that of UHPC-0 as the steel fiber content is increased. For the capillary water absorption property, despite its higher strength, undamaged control specimens of UHPC-2 showed a cumulative capillary water absorption of 607.2 ml m−2 and a capillary water absorption index of 2.84 ml m−2·s−1/2, which are significantly higher than those of UHPC-0 without steel fiber. Therefore, it appears that the control specimens with steel fibers are more permeable than the specimens without steel fibers.
To visualize the extent of damage to the properties of the specimens, the compressive and splitting tensile strengths are plotted against the preload level in Figures 2, 3. As shown in Figure 2, there is no significant decrease in strength when the preload level is less than 70%. The compressive strength decreases remarkably as the preload level is increased (>70%). When the preload levels are 90 and 100%, the compressive strengths of UHPC-0 and UHPC-2 are decreased by 4.8 and 13.3%, respectively, compared with the strengths at a preload level of 0% (102.3 and 130.4 MPa, respectively). This is because the concrete is still in the elastic stage when the preload level is low. Most of the deformation is recovered after unloading, which results in little residual deformation. To some extent, this means that existing defects, such as microcracks and pores, are closed, and the compactness is improved. Higher preload levels not only generate many microcracks but also accelerate the development and spread of existing cracks, which leads to the formation of macroscopic cracks that are visible to the naked eye. Eventually, the strength clearly deteriorates. Figure 3 shows that the splitting tensile strength gradually decreases with an increasing preload level. For preload levels of 50, 70, and 90%, the UHPC-0 splitting tensile strength decreases by 5.5, 12.9, and 20.9%, respectively, compared with the strength at a preload level of 0% (5.11 MPa). The splitting tensile strength of UHPC-2 is 8.74 MPa when the preload level is 0%, and decreases by 0.6 and 20.4% when the preload levels are 70 and 100%, respectively.
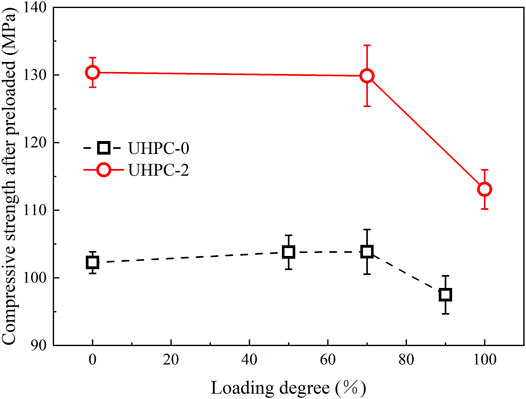
FIGURE 2. Compressive strength of unhealed specimens under different preload levels.

FIGURE 3. Splitting tensile strength of unhealed specimens under different preload levels.
Figure 4 shows the curves for the compressive and splitting tensile strengths against the preload level. As the preload level is increased, the change laws for the compressive strengths for UHPC-0 and UHPC-2 are similar. When the preload level is low, the compressive strength shows a small change rate. The compressive strength decreased significantly when the preload level exceeded 70%. The tensile splitting strength continuously decreased with an increasing preload level, and the splitting tensile strength showed a greater change rate than the compressive strength at different preload levels. This indicates that the tensile splitting strength is much more affected by the preload level than the compressive strength.
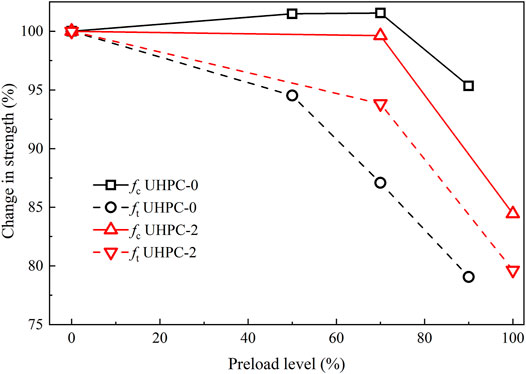
FIGURE 4. Change in strength of unhealed specimens under different preload levels.
The effect of the preload level on the tension-to-compression ratio is shown in Figure 5. The tension-to-compression ratios for UHPC-0 and UHPC-2 decreased as the preload level is increased. This is because preloading reduces the ductility of the concrete and increases the brittleness. For preload levels of 50, 70, and 90%, the tension-to-compression ratios for UHPC-0 decreased to 0.046, 0.043, and 0.041, respectively, which correspond to a decrease of 8.8, 14.2, and 17.2%, respectively, compared to the ratio for a preload level of 0% (0.050). For preload levels of 70 and 100%, the tension-to-compression ratio of UHPC-2 decreases to 0.063 and 0.061, respectively, which correspond to a decrease of 5.8 and 8.2%, respectively, compared to the ratio for a preload level of 0% (0.067).
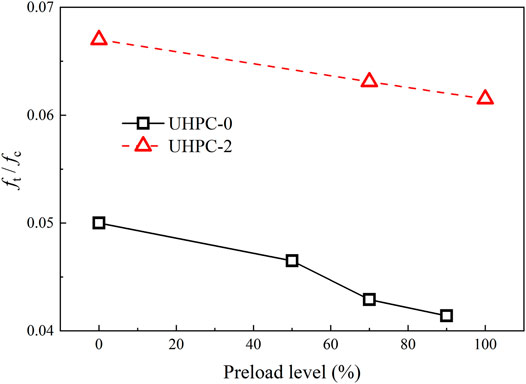
FIGURE 5. Tension-to-compression ratio of specimens under different preload levels.
A typical plot for the cumulative water absorption (normalized per unit surface area) as a function of the square root of time is shown in Figure 6. The cumulative volume of water absorbed per unit surface area in the specimens increases with the square root of time. The preloading has a significant influence on the water absorption of specimens. This is because the presence of microcracks in concrete alters the transport properties measured as a function of the preload level. The cumulative water absorption and the absorption rate of UHPC-0 decrease first and then increase with the increasing preload level. For UHPC-2, the cumulative water absorption and absorption rate increase with the increasing preload level. A decreasing phenomenon was not observed for UHPC-2 as the preload level was larger than that of UHPC-0. It can also be observed that the change percentage in cumulative water absorption and absorption rate of UHPC-0 and UHPC-2 at the same preload level (70%) are quite different; they decrease by 8.2 and 11.6% for UHPC-0; however, they increase by 12.6 and 10.9% for UHPC-2, respectively.
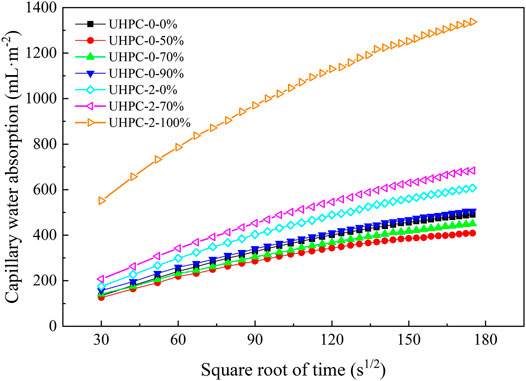
FIGURE 6. Typical plot for the capillary water absorption test.
3.2 Effect of Rehydration on the UHPC Performance
3.2.1 Splitting Tensile Strength
The preload level has a more significant effect on the splitting tensile strength than the compressive strength according to the analysis in Effect of the Preload Level on the Unhealed Specimens Section. Hence, the following analysis for the effect of rehydration mainly focuses on the splitting tensile strength. Figure 7 shows the curve for the splitting tensile strength with increasing rehydration time. The splitting tensile strength of UHPC-0 with preload levels of 0, 50, 70, and 90% first increases and then decreases with increasing rehydration time and reaches maximum values at 28, 14, 28, and 56 days, respectively. The maximum values increase by 14.5, 7.1, 32.4, and 35.6% compared to the values before rehydration (5.11, 4.83, 4.45, and 4.04 MPa, respectively). After rehydration for 90 days, the splitting tensile strength decreases by 7.8, 20.7, 14.2, and 8.2%, respectively, compared to the values before rehydration, and decreases by 19.4, 25.9, 35.1, and 32.3%, respectively, compared to the maximum values.
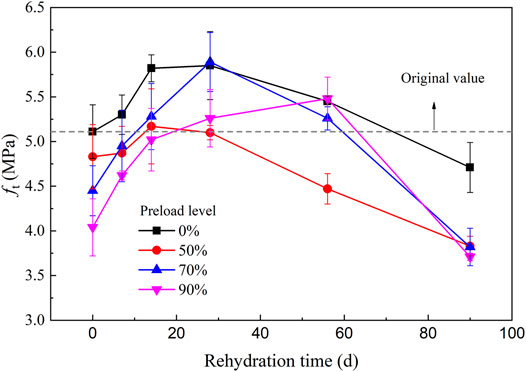
FIGURE 7. Splitting tensile strength of UHPC-0 with increasing rehydration time.
Figure 8 shows the relationship between the splitting tensile strength of UHPC-2 and the rehydration time at different preload levels. As the rehydration time is increased, the splitting tensile strength of specimens with 0% loading fluctuated around the value obtained for no rehydration (8.74 MPa). In contrast, the splitting tensile strengths for specimens with 70 and 100% loading first increased and then decreased. At higher preload levels, the strength increases by a greater amount and declines at a later time. The splitting tensile strengths for specimens with 70 and 100% preload levels reach their maximum values at 14 days and 56 days, respectively, and are 14.5 and 21.4% higher than the values obtained before rehydration (8.21 and 6.96 MPa, respectively). After rehydration for 90 days, the splitting tensile strength increases by 10.6 and 13.5%, respectively, compared to the values obtained before rehydration, and decreases by 3.5 and 6.5%, respectively, compared to the maximum values.
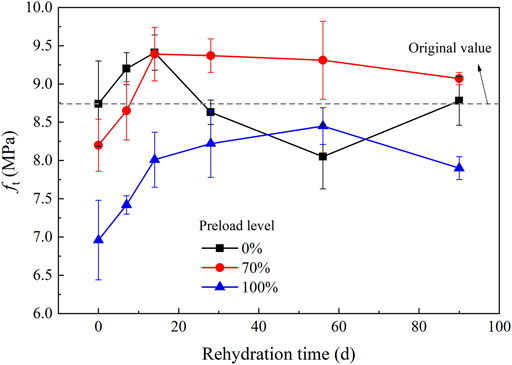
FIGURE 8. Splitting tensile strength of UHPC-2 with increasing rehydration time.
3.2.2 Capillary Water Absorption
A non-linear relationship was observed between the capillary water absorption and water absorption time at different preload levels. The capillary water absorption increased rapidly in the early stage of rehydration and slowed down in the later stage. Figure 9 shows the change in the cumulative capillary water absorption for UHPC-0 and UHPC-2 with increasing rehydration time. The cumulative capillary water absorption of UHPC-0 decreases rapidly in the early stage of rehydration time and tended to become stable in the later stage at different loadings. After 90 days of rehydration time, the total capillary water absorption with 0, 50, 70, and 90% preload levels decreased by 30.7, 17.7, 30.0, and 36.5%, respectively, compared to the values before rehydration (490.0, 409.2, 450.0, and 505.8 ml m−2, respectively). The capillary water absorption change law for UHPC-2 was the same as that for UHPC-0 at different preload levels. The cumulative capillary water absorption for UHPC-2 decreased with increasing rehydration time at different loadings; in particular, there was a significant decrease in the first 7 days. After 90 days of rehydration time, the cumulative capillary water absorption with preload levels of 0, 70, and 100% decreased by 41.4, 40.4, and 44.2%, respectively, compared to the values obtained before rehydration (607.2, 683.9, and 1,337.2 ml m−2, respectively).
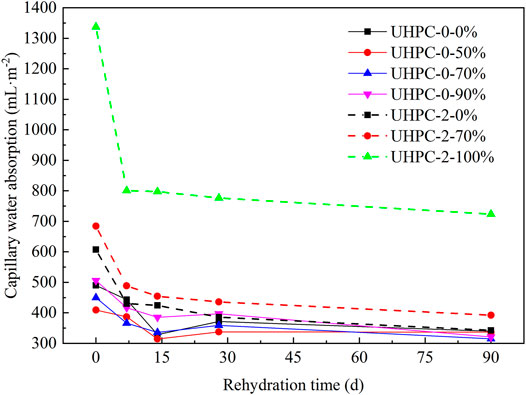
FIGURE 9. Cumulative capillary water absorption of UHPC-0 and UHPC-2 with increasing rehydration time.
Figure 10 presents the capillary water absorption coefficients for UHPC-0 and UHPC-2 during the rehydration process. As observed in Figure 9, with subsequent curing in water, the capillary water absorption coefficients decrease, especially during the first 14 days. For UHPC-0, after 14 days of water curing, the capillary water absorption coefficients decreased by 15.0, 21.9, 30.6, and 22.8% for a preload level of 0, 50, 70, and 90%, respectively. These amounts of reduction demonstrate the extent of the healing effect of rehydration. Even for the control UHPC-0 mixture that was not subject to any preloading, a reduction of 15.0% was still found. The rehydration of unhydrated cementitious materials can block capillary pores and channels, which results in a reduction in the capillary water absorption coefficient. For UHPC-0 with a preload level of 70%, the reduction in the capillary water absorption coefficient is larger than that of 90%. As presented earlier in Table 2, preloading leads to microcracks, which effectively increase the overall porosity and permeability of the system. However, the effects of rehydration cannot repair larger pores or cracks. Therefore, much of the damage cannot be healed after 90% preloading. With increasing curing time, the healing effect persists. For UHPC-0 after 90 days of water curing, the capillary water absorption coefficients decrease by 28.3, 29.5, 37.4, and 33.6% for preload levels of 0, 50, 70, and 90%, respectively.
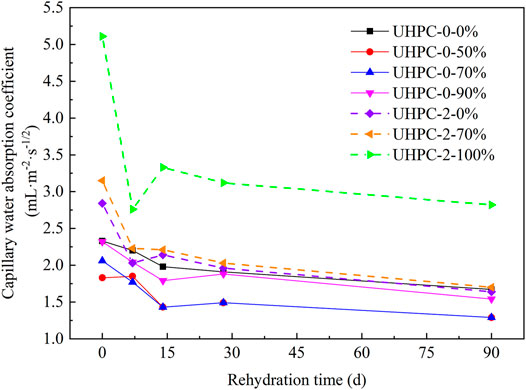
FIGURE 10. Capillary water absorption coefficients of UHPC-0 and UHPC-2 with increasing rehydration time.
Similar to UHPC-0, with subsequent curing in water, the capillary water absorption coefficients decrease, especially during the first 14 days, and these values decreased by 24.6, 29.8, and 34.8% for preload levels of 0, 70, and 100%, respectively. For UHPC-2 after 90 days of water curing, the capillary water absorption coefficients decrease by 42.3, 46.0, and 44.8% for preload levels of 0, 70, and 100%, respectively. Compared with UHPC-0, the repair effect for UHPC-2 is clearer. The steel fiber in the UHPC can prevent cracks from spreading, which results in the formation of more microcracks. Therefore, a higher percentage of cracks can be healed, which results in a larger reduction in capillary water absorption coefficients. As presented in Table 2, for the control UHPC mixtures that were not subject to any healing, the initial capillary water absorption index of UHPC-2 is much larger than that of UHPC-0. Therefore, many more capillary pores are healed in UHPC-2, and the reduction in the capillary water absorption coefficients is larger.
3.2.3 Chemically Bound Water
Figure 11 shows the effect of rehydration on the percentage increase of chemically bound water content. Chemically bound water content is usually used to present the hydration process for cementitious materials. As presented in Figure 11, the percentage increase for chemically bound water change laws for UHPC-0 and UHPC-2 is basically the same at different preload levels: a rapid increase in the early stage that eventually slows down. A higher preload level increases the rate at which water becomes chemically bound. After 90 days of rehydration, the chemically bound water for UHPC-0 with preload levels of 0, 50, 70, and 90% increases by 9.09, 11.15, 13.08, and 16.94%, respectively, compared with the values obtained before rehydration. The chemically combined water content of UHPC-2 with preload levels of 0, 70, and 100% increases by 13.9, 14.7, 21.3, and 23.51%, respectively, compared with the values obtained before rehydration. This is because the 30°C water environment provides enough moisture for the rehydration reaction. The moisture penetrating the concrete reacts with the unhydrated cementitious materials, which leads to a large degree of change in the chemically bound water.
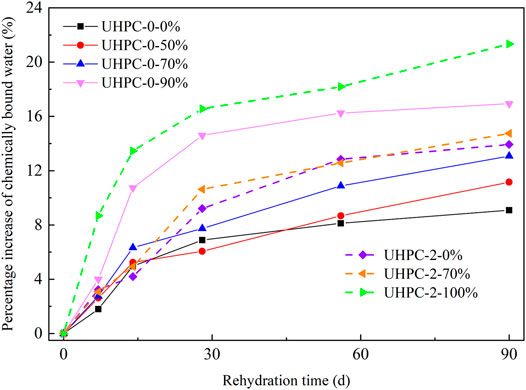
FIGURE 11. Percentage increase of chemically bound water content of UHPC-0 and UHPC-2 with increasing rehydration time.
4 Discussion
According to hydration kinetics theory, the volume of cement particles after hydration is 2.1 times that of original cement particles (Powers, 1958; Zhang et al., 2000). Therefore, the volume of hydration products is 2.1 times that of unhydrated cement particles. When there is enough space in hardened concrete to accommodate the newly formed rehydration products, the volume expansion of hydration products plays a filling and reinforcing role (Neville, 1995). However, when there is not enough space to accommodate the new rehydration products, the expansion stress generated by the volume expansion of the rehydration products will result in damage to the concrete.
The filling enhancement and the damage effect caused by the volume expansion of the new rehydration products occur simultaneously. Figures 12, 13 show the relationship between the change in splitting tensile strength and increase in rehydration degree (equal to the increase in chemically bound water). The change in splitting tensile strength first increases and then decreases with the increasing rehydration degree. The effect of rehydration on the repair and damage of the splitting tensile strength of concrete is more significant at a higher preload level. The repair time increases with the preload level. This is because the water-to-binder ratio of UHPC is very low, which leads to a relatively dense interior structure. At a low preload level, the interior of the concrete remains dense after preloading, which results in insufficient water penetrating the concrete and participating in the reaction. Hence, the effect of rehydration on the strength is not obvious because the hydration degree does not increase significantly. Cracks in the interior and surface of the concrete caused by the damage effect of rehydration not only provide enough space to accommodate the new rehydration products but also offer a channel for the entry of external moisture. According to the Powers theory, the minimum water-to-cement ratio for the complete hydration of cement is 0.38. However, a water-to-binder ratio of only 0.20 was used for UHPC in this study, which is much lower than 0.38. The internal concrete still contains a large amount of unhydrated cementitious materials after normal curing. The rehydration reaction between the abundant unhydrated cementitious materials and water significantly increased the rehydration degree, which results in many rehydration products. The new rehydration products gather around the cracks and play a significant role in repairing the concrete strength through filling and cementing (Zivica, 2009).
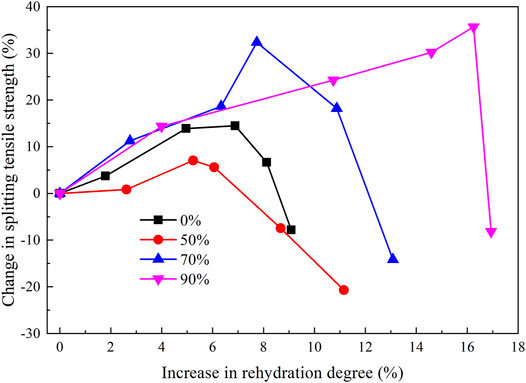
FIGURE 12. Relationship between the splitting tensile strength of UHPC-0 and its rehydration degree.
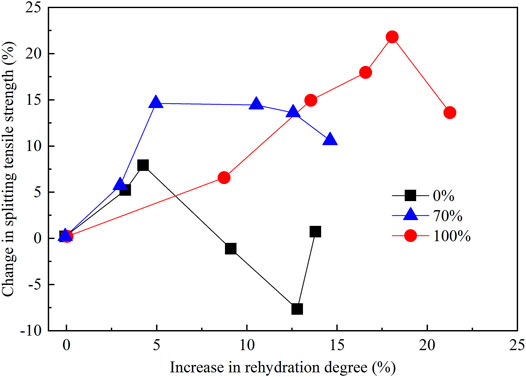
FIGURE 13. Relationship between the splitting tensile strength of UHPC-2 and its rehydration degree.
At higher preload levels, the rehydration degree increases more significantly in the early stage. Hence, the change in splitting tensile strength is more significant than the initial value in the early stage. The rehydration degree continues to increase; when the internal concrete has no surplus space to accommodate the new rehydration products, the expansion stress generated by the new rehydration products acting on the hardened cement paste decreases the strength. The better repair effect on the strength in the early stage produces a denser internal concrete, which leads to a more significant decrease in the strength in the later stage.
Figures 14, 15 show the relationship between the change in cumulative capillary water absorption and the increase in rehydration degree. The change in cumulative capillary water absorption decreases with an increasing rehydration degree. At a higher preload level, the decrease in the cumulative capillary water absorption becomes more significant. This is because the cumulative capillary water absorption is closely related to the change in the pore structure at the surface layer. The external moisture required for the rehydration reaction penetrates from the surface to the internal concrete. The rehydration reaction between the external moisture and unhydrated cementitious material occurs in the same period. In the early stage, as the rehydration degree increases, the hydration products generated by the rehydration reaction fill the surface defects and voids, which significantly reduces the permeability of the concrete. The rehydration degree still increases at the later stage, which leads to abundant rehydration products. However, there is not enough space to accommodate the new rehydration products because the density of the concrete is significantly increased by the rehydration effect in the early stage. Hence, the rehydration at this stage is not significant for repairing the concrete permeability. The integrity of the concrete is compromised as the preload level is increased. Concrete with serious defects contains more space to accommodate the rehydration products, so the cumulative capillary water absorption changes more significantly as the rehydration degree increases.
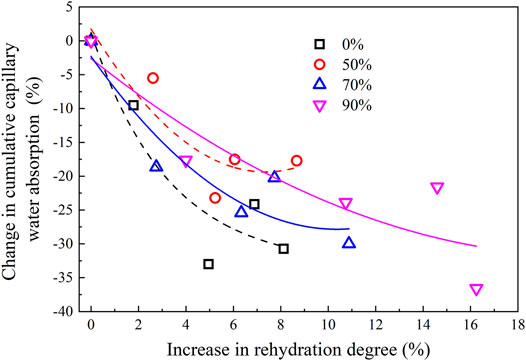
FIGURE 14. Relationship between the cumulative capillary water absorption of UHPC-0 and its rehydration degree.
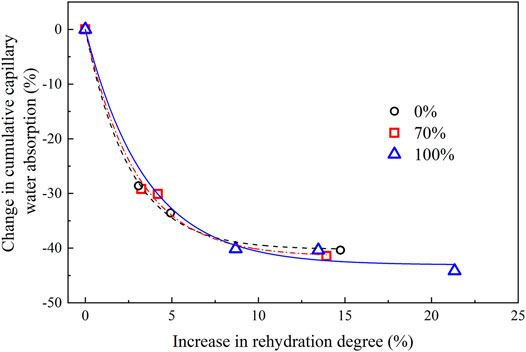
FIGURE 15. Relationship between the cumulative capillary water absorption of UHPC-2 and its rehydration degree.
The permeability of the concrete increases not only because of the porosity but also because of the connectivity degree of the pores. In the early stage of rehydration, the internal concrete contains many internal defects after preloading. The rehydration products fill the pores and defects of the concrete, which enhanced the strength and reduced the permeability. In the later stage of rehydration, the damage caused by the expansion of rehydration products is dominant and increases the internal porosity. However, the degree of pore connectivity does not increase, so the permeability does not decrease, and the strength is decreased.
The development of the mechanical properties of concrete during rehydration involves a dynamic process. The filling enhancement and the damage effect caused by the volume expansion of the new rehydration products occur simultaneously. On the one hand, the new rehydration products produced by the rehydration strengthen the cementing strength of the system and compensate for the initial defects, which improve the strength. On the other hand, the original stability of the system is destroyed because more space is needed to accommodate the volume expansion of the rehydration products. This is harmful to the development of strength. When the strength is repaired to a certain extent, the damage effect begins to dominate. When the internal damage reaches a certain level, the repair effect becomes dominant again. These macroscopic changes are the result of the combination of both effects.
5 Conclusion
In this article, the results of an experimental investigation into the rehydration effect on the performance of mechanically loaded UHPC specimens are presented. After a controlled precracking phase reaching to 100% of the ultimate compressive strength, specimens are cured in water for an additional 90 days to simulate the effect of rehydration. The main conclusions of this study are as follows:
•Preloading UHPC leads to changes in the total porosity and ultimate strength. When the preload level does not exceed 70%, the degradation in the mechanical properties of the concrete is not significant. When the preload level is 90%, the compressive strength and splitting tensile strength of UHPC-0 decrease by 4.8 and 20.9%, respectively, compared with the initial values. For a preload level of 100%, the compressive strength and splitting tensile strength of UHPC-2 decrease by 13.3 and 20.3%, respectively, compared to the initial values. This indicates that when the preload level exceeds 70%, the mechanical properties of the concrete decrease with an increasing preload level. The splitting tensile strength shows a more significant decrease than the compressive strength at the same preload level, which indicates that the former is more sensitive to the preload level.
•At different preload levels, the splitting tensile strength first increases and then decreases with increasing rehydration time. The repair time for the strength with rehydration increases with the increasing preload level. At higher preload levels, the decrease in strength at the later stage of rehydration becomes more significant. At different preload levels, the cumulative capillary water absorption decreases with increasing rehydration time, and the amplitude of the decrease increases with the preload level. After 90 days of rehydration, the total capillary water absorption for UHPC-2 with preload levels of 90 and 100% decreases by 36.5 and 44.2%, respectively, compared with the initial values.
•At different preload levels, the chemically bound water content increases with the increasing rehydration time. At higher preload levels, the increase in the chemically bound water content becomes more significant. After 90 days of rehydration, the chemically bound water content of UHPC-0 with preload levels of 0, 70, and 90% increases by 9.09, 11.15, and 16.94%, respectively, compared to the initial values. At a preload level of 100%, the chemically bound water of UHPC-2 is increased by 23.51%. The splitting tensile strength first increases and then decreases as the rehydration degree is increased. The cumulative capillary water absorption decreases as the rehydration degree is increased. At higher preload levels, the decrease in the total capillary water absorption becomes more significant.
Data Availability Statement
The original contributions presented in the study are included in the article/Supplementary Material, further inquiries can be directed to the corresponding author.
Author Contributions
YW was responsible for making the research plan, analyzing the test results, and writing the manuscript. MA guided the research work. JL completed the relevant experimental research work. HH participated in the experimental research and helped complete the manuscript.
Funding
Financial support from the Beijing Natural Science Foundation (Grant No. 8192032) and the National Natural Science Foundation of China (Grant No. 51878033) is greatly appreciated.
Conflict of Interest
The authors declare that the research was conducted in the absence of any commercial or financial relationships that could be construed as a potential conflict of interest.
Publisher’s Note
All claims expressed in this article are solely those of the authors and do not necessarily represent those of their affiliated organizations, or those of the publisher, the editors, and the reviewers. Any product that may be evaluated in this article, or claim that may be made by its manufacturer, is not guaranteed or endorsed by the publisher.
References
Didier, S., and Nele, D. B. (2019). Autogenous Healing in Strain-Hardening Cementitious Materials with and without Superabsorbent Polymers: An 8-Year Study. Front. Mater.6, 48.
Dils, J., Boel, V., and De Schutter, G. (2013). Influence of Cement Type and Mixing Pressure on Air Content, Rheology and Mechanical Properties of UHPC. Construction Building Mater.41, 455–463. doi:10.1016/j.conbuildmat.2012.12.050
Ersan, Y. C., Palin, D., Yengec Tasdemir, S. B., Tasdemir, K., Jonkers, H. M., Boon, N., et al. (2018). Volume Fraction, Thickness, and Permeability of the Sealing Layer in Microbial Self-Healing concrete Containing Biogranules. Front. Built Environ.4, 70. doi:10.3389/fbuil.2018.00070
Guan, X., Yang, L., and Yao, Y. (2004). Research on the Durability of High Performance concrete with Low Water-Binder Ratio. Concrete10, 3–4.
Hillermeier, B., and Schroeder, M. (1995). Durability of High Performance Concrete. RILEM Workshop, 70–75.
Huang, H., Gao, X., and Khayat, K. H. (2021). Contribution of Fiber Orientation to Enhancing Dynamic Properties of UHPC under Impact Loading. Cement and Concrete Composites121, 104108. doi:10.1016/j.cemconcomp.2021.104108
Huang, H., Gao, X., and Teng, L. (2021). Fiber Alignment and its Effect on Mechanical Properties of UHPC: An Overview. Construction Building Mater.296, 123741. doi:10.1016/j.conbuildmat.2021.123741
Kan, L.-l., and Shi, H.-s. (2012). Investigation of Self-Healing Behavior of Engineered Cementitious Composites (ECC) Materials. Construction Building Mater.29, 348–356. doi:10.1016/j.conbuildmat.2011.10.051
Liu, J. (2016). Rehydration of Reactive Powder concrete Prepared with Different Fineness Cement. Dissertation, Beijing Jiao tong University.
Liu, X., Yao, W., and Zheng, X. (2005). Experimental Study on Self-Healing Performance of concrete. J. Build. Mater.8 (2), 184–188.
Long, G. (2004). Study on the Composition, Structure and Properties of Reactive Powder concrete. Shanghai: Ph.D. Thesis of Tongji University.
Matte, V., and Moranville, M. (1999). Durability of Reactive Powder Composites: Influence of Silica Fume on the Leaching Properties of Very Low Water/binder Pastes. Cement and Concrete Composites21, 1–9. doi:10.1016/s0958-9465(98)00025-0
Mo, Z., Gao, X., and Su, A. (2021). Mechanical Performances and Microstructures of Metakaolin Contained UHPC Matrix under Steam Curing Conditions. Construction Building Mater.268, 121112. doi:10.1016/j.conbuildmat.2020.121112
Powers, T. C. (1958). Structure and Physical Properties of Hardened Portland Cement Paste. J. Am. Ceram. Soc.41, 1–6. doi:10.1111/j.1151-2916.1958.tb13494.x
Randl, N., Steiner, T., Ofner, S., Baumgartner, E., and Mészöly, T. (2014). Development of UHPC Mixtures from an Ecological point of View. Construction Building Mater.67, 373–378. doi:10.1016/j.conbuildmat.2013.12.102
Vandamme, M., Ulm, F.-J., and Fonollosa, P. (2010). Nanogranular Packing of C-S-H at Substochiometric Conditions. Cement Concrete Res.40, 14–26. doi:10.1016/j.cemconres.2009.09.017
Yang, L., and Guan, X. (2004). Study on the Damage of Unhydrated Cement Hydration on High Strength Concrete. Henan Build. Mater.2, 3–5.
Yang, L., Ma, B., and Guan, X. (2007). Inhibitory Effect of Mineral Admixture on Later Hydration Hazard of Unhydrated Cement. China Concrete Cement Product.3, 6–8.
Yang, W., and Huang, Z. (2003). Study on Durability of Reactive Powder Concrete. Concrete Cement Prod.1, 19–20.
Yao, W., and Zhong, W. (2006). Mechanism for Self-Healing of concrete Damage. Chin. J. Mater. Res.20 (1), 24–28.
Zhang, Y. M., Sun, W., and Yan, H. D. (2000). Hydration of High-Volume Fly Ash Cement Pastes. Cement and Concrete Composites22 (6), 445–452. doi:10.1016/s0958-9465(00)00044-5
Zhu, Y., Yang, Y., and Yao, Y. (2012). Autogenous Self-Healing of Engineered Cementitious Composites under Freeze-Thaw Cycles. Construction Building Mater.34, 522–530. doi:10.1016/j.conbuildmat.2012.03.001
Keywords: rehydration, ultrahigh-performance concrete, preload level, mechanical properties, capillary water absorption
Citation: Wang Y, An M, Lu J and Huang H (2022) Effect of Rehydration on the Performance of Mechanically Loaded UHPC. Front. Mater. 9:836201. doi: 10.3389/fmats.2022.836201
Received: 15 December 2021; Accepted: 17 January 2022;
Published: 08 February 2022.
Edited by:
Lik-ho Tam, Beihang University, ChinaReviewed by:
Jing Yu, Sun Yat-sen University, ChinaXiaojian Gao, Harbin Institute of Technology, China
Copyright © 2022 Wang, An, Lu and Huang. This is an open-access article distributed under the terms of the Creative Commons Attribution License (CC BY). The use, distribution or reproduction in other forums is permitted, provided the original author(s) and the copyright owner(s) are credited and that the original publication in this journal is cited, in accordance with accepted academic practice. No use, distribution or reproduction is permitted which does not comply with these terms.
*Correspondence: Yue Wang, yue.wang@bjtu.edu.cn