Dispersal and Deposition of Detritus From Kelp Cultivation
 Ole Jacob Broch
 Kasper Hancke
 Ingrid Helene Ellingsen
- 1SINTEF Ocean, Trondheim, Norway
- 2NIVA, Oslo, Norway
A high resolution coastal and ocean hydrodynamic model system was used to investigate the transport and deposition patterns of Particulate Organic Matter (POM) from kelp farmed at three locations of different properties: a sheltered location, an exposed location, and an offshore location. Published values on the sinking speeds of organic particles from kelp were used, spanning several orders of magnitude. Recent work on quantifying the release of particulate organic matter from farmed kelp was used to link the release of carbon to possible cultivation volumes and scenarios, and finally to link this to the potential for carbon loading on the ocean floor. The results are presented in terms of loading and distribution per unit harvested kelp, and the loading estimates are compared with estimates of natural (background) primary production. According to the simulation results, organic matter may be transported anything from a few (hundred) meters up to a hundred km away from the release site, depending on the sinking rates, time of release, and the location. The depth at which the matter settles on the sea floor likewise depends on the properties of the matter and the sites. The time until settlement varied from minutes to several hundred hours. The results underscore the importance of constraining the dispersal and deposition of detritus from kelp cultivation in order to better understand and quantify associated environmental risks posed by organic loading, and the potential for seafloor carbon sequestration by kelp farming as a nature based climate solution.
1. Introduction
Recent work suggests that the potential for macroalgae aquaculture globally is great, also outside of Asia, that currently produces more than 99% of the 32 million tons wet weight cultivated per annum (Lehahn et al., 2016; Hadley et al., 2018; van der Molen et al., 2018; Broch et al., 2019; FAO, 2020; Forbord et al., 2020; Aldridge et al., 2021; Duarte et al., 2021). During the grow out phase in culture, as in natural populations, macroalgal tissue fragments are shredded and entire plants dislodged (Parke, 1948; Sjtun, 1993; Krumhansl and Scheibling, 2012; Zhang et al., 2012; Pedersen et al., 2020; Fieler et al., 2021). Both these processes contribute to the pool and export of Particulate Organic Matter (POM). In particular kelps, large brown macroalgae of the order Laminariales, display meristematic growth with ensuing erosion of the distal end(s) of the frond(s). In natural kelp forests, 50% of the Net Primary Production (NPP) may be released as POM (Pedersen et al., 2020). The erosion of cultivated S. japonica in Sungo Bay in China has been reported at up to 61% of the cultivated kelp NPP (Zhang et al., 2012). Recent results from Norwegian kelp cultivation indicate a POM export of 8 to 13% of the NPP if the kelp is harvested early during spring, and up to 49% if harvested later in the growth season during summer (Fieler et al., 2021). The export includes a wide range of kelp fragment sizes (Fieler et al., 2021). POM released from natural kelp forests is an important source of food and habitat for bacteria, macro- and meiofauna (Duggins et al., 1989; Renaud et al., 2015; Queirs et al., 2019; de Bettignies et al., 2020a; Brunet et al., 2021; Harbour et al., 2021a). It has been suggested that organic matter from intense kelp cultures may have negative environmental impacts (Walls et al., 2017; Campbell et al., 2019), as in fin fish farming (Carroll et al., 2003). However, investigations indicate that the impacts of organic loads even from large-scale seaweed farming are modest (Zhang et al., 2009; Walls et al., 2017; Visch et al., 2020).
Regardless of the source, kelp POM contributes to carbon sequestration through export and subsequent deposition and permanent burial of carbon rich organic detritus in coastal or deep sea soft sediments (Krause-Jensen and Duarte, 2016; Duarte et al., 2017, 2021; Smale et al., 2022). Macroalgal tissue may be transported distances at the order of 1000 km and to depths of several thousands of meters (Harrold et al., 1998; Ortega et al., 2019). Simulation studies and in situ observations have also shown that POM from natural kelp populations can be transported beyond the natural habitats, both horizontally and vertically (Filbee-Dexter et al., 2018, 2020), and that it may degrade over time periods of months (Frontier et al., 2021; Smale et al., 2022). Despite this, it is yet unclear how exported biomass of kelp detritus is dispersed (Pedersen et al., 2021), how far it is transported, and how the matter is distributed between the near and far field. Neither have there been any studies focusing on cultivated kelp detritus, and in particular the importance of kelp farming location and physical characteristics.
Here, we investigate how kelp farming contributes to the export of POM, how far it is transported and how it is subsequently distributed on the seafloor. These questions are approached by using a high resolution 3 dimensional hydrodynamic model (SINMOD) with a detritus transport module. We then relate the results to cultivation scenarios for the commercially important kelp Saccharina latissima (sugar kelp) and present the results in terms of fractions of production volumes so that they are scalable and not directly related to production technologies, species, or cultivation practices at any one particular farm.
2. Materials and Methods
2.1. Ocean Model SINMOD
The 3 dimensional model framework SINMOD (Slagstad and McClimans, 2005) was used for the simulations. The hydrodynamic component solves the primitive Navier-Stokes equations using a finite difference scheme on an Arakawa C-grid (Aarakawa and Lamb, 1977). In the present simulations, z-layers were used (i.e., each vertical layer had a fixed thickness except the surface and bottom layers) and a hydrostatic assumption was applied (Slagstad and McClimans, 2005).
A model domain of 160 m horizontal resolution was used (Figure 1). Boundary conditions were produced in a 3 step nesting procedure, running models of successively finer grids from 20,000 m, to 4,000, to 800 m and finally to 160 m resolution, e.g., Broch et al. (2019, 2020). The model setup in 160 m horizontal resolution used here had depth layer thicknesses ranging from 1 to 5 m for the upper 25 m, followed by 25 m thick layers down to 650 m depth. The simulation time step for the 160 m model was 30 s.
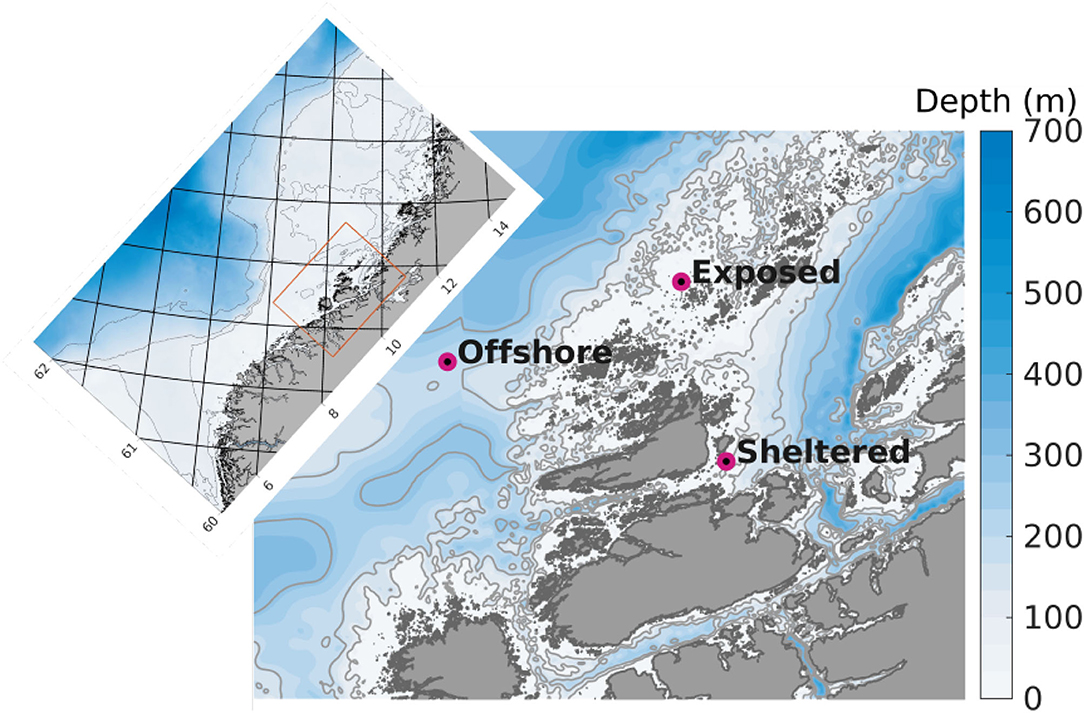
Figure 1. Detail of the model domain in 160 m horizontal resolution used for the dispersal simulations. The purple dots indicate the positions of the release sites. The colors indicate bottom depth (m), and the thin gray curves represent the 100, 200, and 300 m isobaths. The inset map displays the 800 m model domain that was used to generate boundary conditions for the 160 model (orange rectangle in inset map). The numbers along the axes denote latitude and longitude.
Atmospheric forcing was applied using ECWMF's ERA-Interim data (Dee et al., 2011). Forcing by freshwater from rivers and land was implemented by using data from the Norwegian Water Resources and Energy Directorate (www.nve.no) generated by a version of the HBV-model (Beldring et al., 2003).
Previous studies have shown that the model system is able to approximate the local current system at and around aquaculture sites in a realistic manner (Broch et al., 2020). On a larger scale, the model has been shown to reproduce the circulation dynamics at the Norwegian Shelf outside Northern Norway (Skardhamar and Svendsen, 2005).
2.2. Transport and Deposition Modeling
A conceptual diagram of the deposition model is presented in Figure 2. An Eulerian approach was taken in the transport simulations. This entails the calculation of concentration fields of suspended or sedimented POM. A summary of all the parameters and variables of the transport model, including choices of numerical values where applicable, is given in Table 1.
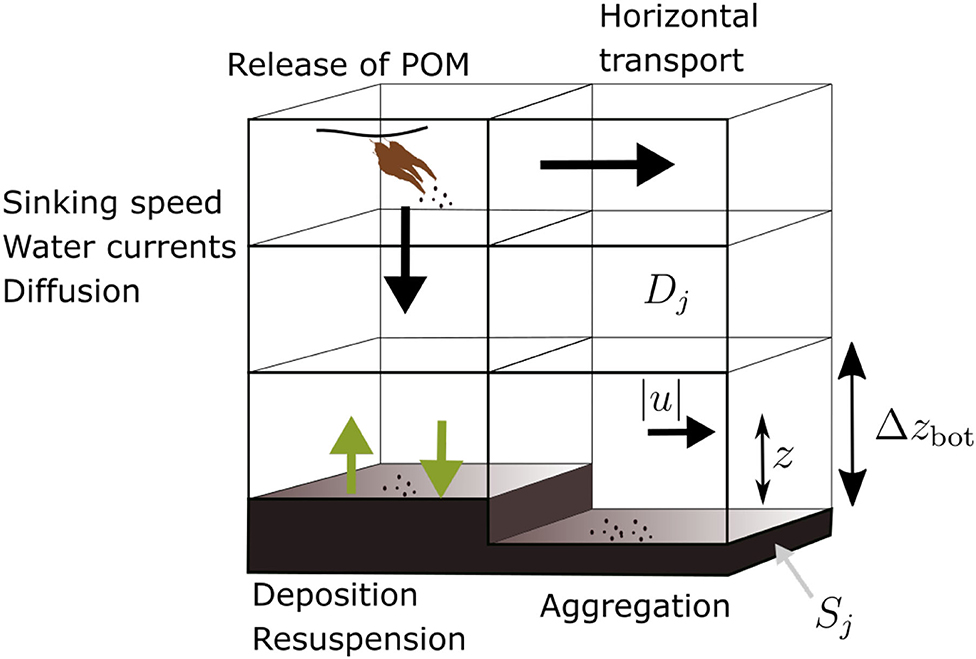
Figure 2. Diagram of the POM transport model, illustrating the main processes: horizontal transport, vertical sinking, sedimentation, resuspension, and aggregation. The source is indicated (brown “kelp,” upper left), as well as the quantities |u|, z, and Δzbot involved in calculation of the shear velocity (Equation 4).
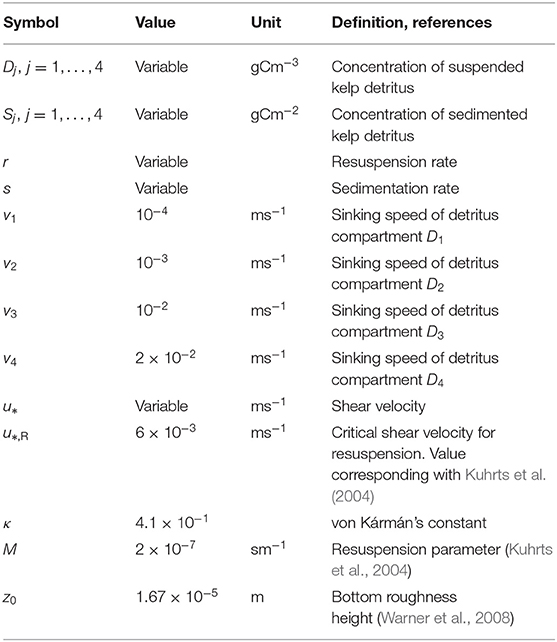
Table 1. Parameters and variables used in the transport and sedimentation model.
Four model compartments (D1,D2,D3,D4) representing the concentrations of kelp POM (unit: gC m−3) of different sinking speeds were used (Table 1). The concentration Dj of component number j is calculated according to the following equation (Wassmann et al., 2006):
Here, Adv and Diff are the 3 dimensional advection and diffusion operators, respectively, while the source term Gj represents release of POM from the cultivation sites (Slagstad and McClimans, 2005). It is tacitly assumed that all expressions and equations are valuated in spatial position (x, y, z). A Richardson scheme for vertical mixing is used (Sundfjord et al., 2008).
The sea floor concentration of deposited POM from compartment j (unit: gC m−2) is denoted by Sj, and the concentration of kelp POM in compartment j in the model's bottom layer by Dj,bot. The fluxes and inter-actions between Dj,bot and Sj are given by the equations:
and
for j = 1, 2, 3, 4. Here r = r(x, y) is the amount of POM resuspended and s = s(x, y) is the fraction deposited in position (x, y); Δzbot is the thickness of the bottom layer (Figure 2).
The resuspension and advection of POM from the bottom is calculated as follows. Let u = (ux, uy) denote the current velocity in the middle of the bottom grid cell. The shear velocity u* is calculated using a logarithmic law (Kuhrts et al., 2004; Warner et al., 2008),
where κ = 0.41 is the universal von Kármán constant, z is the distance from the bottom to the middle of the Dj,bot grid cell, and z0 is the roughness height: the height above the bottom at which the current speed |u| tends to 0 (Figure 2, Table 1). Whether the POM is sedimented, remains neutral, or is resuspended from the sediment, i.e., the values of s and r in Equations (2) and (3), depends on the value of u* relative to the critical shear velocity for reuspension u*,R, thus:
where vj denote the sinking speed of compartment j and
where ρ is the density of sea water and M is a parameter depending on the properties of the matter (Kuhrts et al., 2004). The interactions of sinking and resuspension with horizontal and vertical advection leads to the possibility of aggregation of POM, in contrast to passive tracers.
2.3. Detritus Sinking Speeds and Release
The sinking speeds vj used for POM compartments j are recorded in Table 1. The sinking speed of D2 to D4 are based on the lower end of the range of values published in Wernberg and Filbee-Dexter (2018). They are sinking speeds for whole fronds, frond fragments, and of sea urchin fecal particles (shredded kelp) for Laminaria hyperborea. The sinking speed of D1 is about an order of magnitude lower than the lowest ones recorded in Wernberg and Filbee-Dexter (2018). Consequently, a wide range of sinking speeds are covered.
The transport of POM from the beginning of April until the end of June was considered, assuming deployment of the kelp cultures in January-February (Boreal winter). Before this period, the absolute biomass, and biomass export of a farm is low, even if the size and biomass specific growth rates usually are high (Forbord et al., 2020; Fieler et al., 2021).
It was assumed that 10% of the total amount of POM was released in April, 20% in May, and 70% in June (Fieler et al., 2021). The release was assumed to be constant over each month, i.e., the same amount of matter was released for every model time step within each month.
One simulation was run for each of three types of farm locations (Figure 1):
• Sheltered: a nearshore farm in a coastal environment with a mean water depth of 18 m influenced by tidal mixing and coastal water currents.
• Exposed: a nearshore farm in an exposed environment with a mean water depth of 40 m influenced by tidal mixing and the Norwegian Coastal Current.
• Offshore: a farm in a fully open ocean environment with a mean water depth 232 m influenced by the North Atlantic and Norwegian Coastal currents.
For more information in the prevailing currents along the Norwegian coast cf. (Sætre, 2007). The sheltered farm site is an actual kelp cultivation location with a permit for kelp cultivation of 30 ha. The other two (hypothetical) farms are assumed to cover an area of 125 ha (7 × 7 model grid cells). Although the concepts of “sheltered,” “exposed,” and “offshore” may sometimes be used differently, the words serve to distinguish easily between the sites in the present case.
2.4. Organic Loading Calculations
The generic dispersal simulation results were translated into estimates for organic loading from sugar kelp (Saccharina latissima) aquaculture. While the conditions are suitable for S. latissima cultivation along most parts the Norwegian coast (Forbord et al., 2020), the full cultivation potential is not yet known. Simulation model results indicate an average potential for S. latissima cultivation in Norwegian coastal waters inside the maritime baseline (Harsson and Preiss, 2012) of around 75 t ha−1 year−1 (February-June), though with substantial spatial variability and a maximum potential close to 200 t ha−1 near shore and even higher offshore (Broch et al., 2019).
According to Fieler et al. (2021), 8 to 13% of the S. latissima NPP in culture from January/February until June in Central Norway is lost as POM through frond erosion and plant dislodgement. This translates into the losses by harvest time recorded in Table 2. The results form the dispersal simulations were up-scaled accordingly.
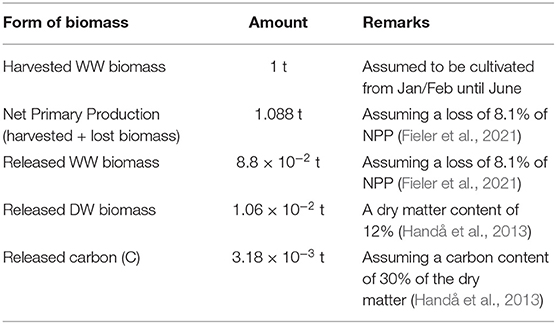
Table 2. Relations/assumptions between production and release of organic matter/release of matter per 1 t harvested biomass.
The sensitivity of POM loading to variations in the loss fraction and production intensity was calculated as follows. We consider only the carbon (C) fraction released. Assuming a harvested WW biomass of Bharvest t WW ha−1 and a loss of a fraction p of the NPP BNPP t WW ha−1 (that is, the biomass had no POM been lost), we have that
with the unit g C m−2, that is: g C per unit of the farmed area. The factor kC converts from t WW to g C (Table 2). The maximum loadings (i.e., the loading in the model grid cell/location with the highest carbon loading) from each of the simulations described above for a loss fraction of q = 0.08 (equivalent to 8%), normalized to the unit g C m−2 (t ha−1)−1 is denoted by Smax(q). This was scaled from the results for q = 0.08 to a production scenario of Charvest t ha−1 and a loss fraction of p as
again of the unit g C m−2. In summary
• Equation (7) denotes the average carbon loss from a farm harvesting Bharvest t WW ha−1 assuming a loss fraction of p of the NPP (the biomass had nothing been lost) as POM. This may also be interpreted as the average amount of carbon deposited per unit area assuming direct deposition without any horizontal advection.
• Equation (8) represents the maximum organic loading (g C m−2) to the sea floor from a farm harvesting Bharvest t WW ha−1 assuming a loss fraction of p of the gross production. Here, sinking rates, horizontal transport and diffusion, sedimentation, and resuspension processes have been accounted for, and are calculated by the ocean model dispersal simulations.
We consider two main dispersal and organic loading scenarios with different distribution of the organic matter between different sinking speeds:
• Scenario A, with 50% slowly sinking matter and the mass distributed evenly between the four detritus compartments D1 to D4;
• Scenario B, with 90% fast sinking matter: 5% of the matter allocated to each of the D1 and D2 compartments and 45% to each of the D3 and D4 compartments.
3. Results
3.1. Dispersal of POM
The average (standard deviation, maximum) simulated current speeds (hourly data April, May, and June) at the middle of the sheltered, exposed and offshore sites were 0.078(0.048, 0.443), 0.166(0.091, 0.8530), and 0.219(0.125, 0.681) ms−1, respectively.
The dispersal distances and patterns of POM differed between the three release sites (Figure 3). The least dispersive site was the sheltered one, while the offshore location was the most dispersive one in the sense that the 90% of the POM deposited within a much grater region at the offshore site than at the sheltered one (Figures 3, 4). A higher proportion of faster sinking POM lead to less dispersal, but did not change the ranking between the sites. Almost 80% of the sedimented POM released from the sheltered site was transported less than 1 km away from the center of the release site, and thus sedimented within the farm itself in Scenario A. By contrast, around 60% of the POM released from the offshore site was transported at least 2 km from the center of the release site in Scenario A, and more than 20% of the POM was transported more than 16 km away from the offshore site.
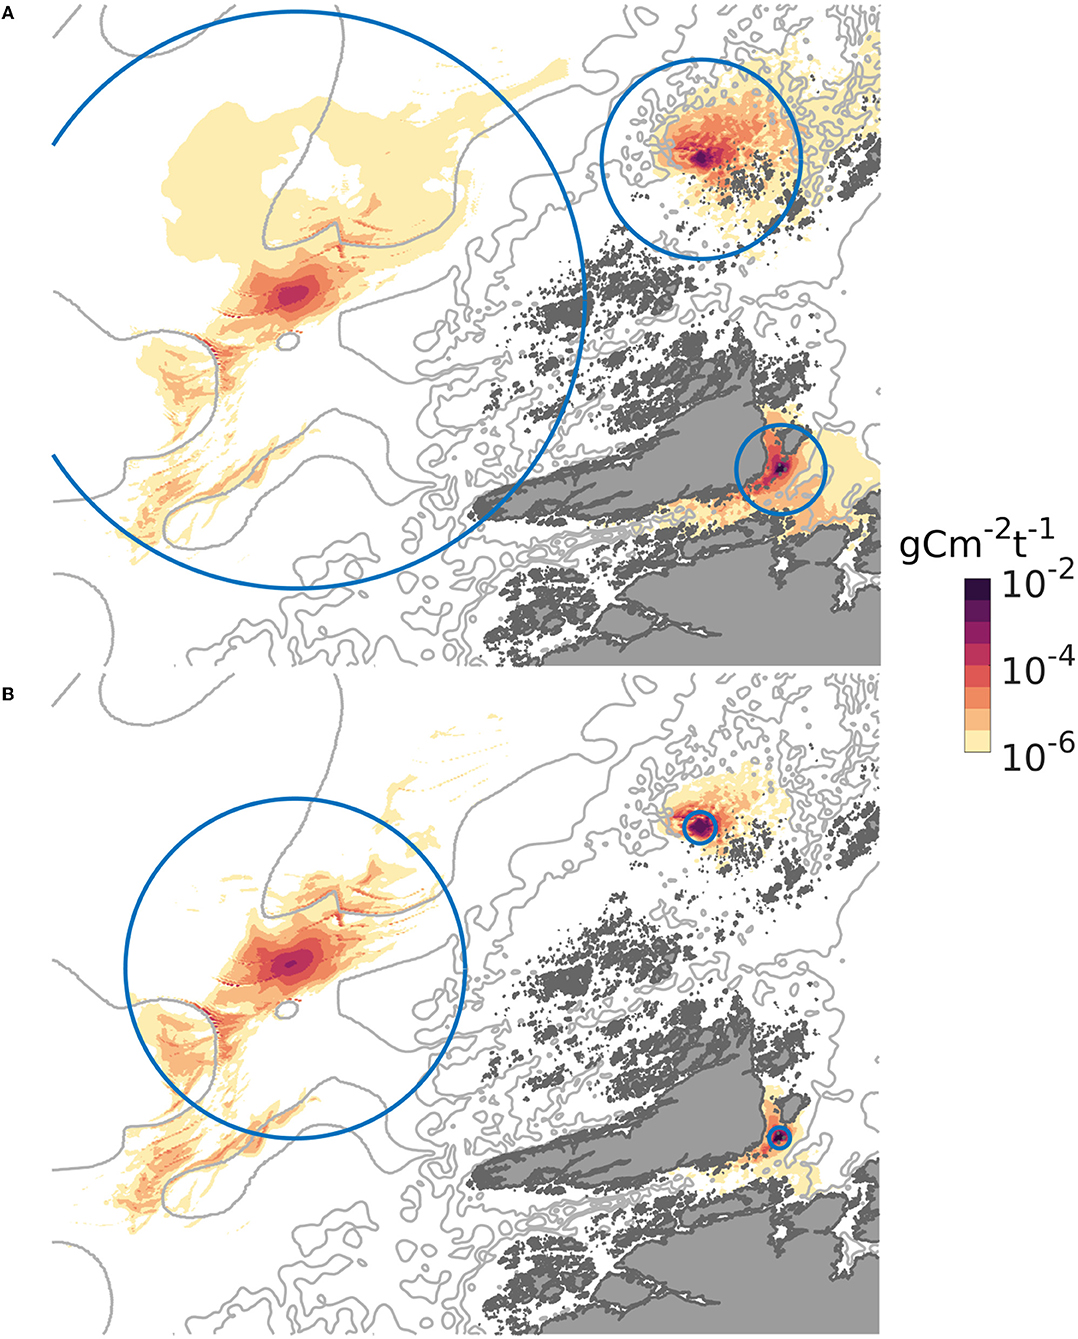
Figure 3. Spatial distribution of POM from the three locations on the sea floor, expressed as g C m−2 (t WW harvested biomass) −1, June. The gray curves are 100, 200, and 300 m isobaths. The circles indicate the region within which 90 per cent of the released POM deposited. In (A), representing scenario A, the radii of the circles were 4, 10, and 28 km, for the sheltered, exposed, and offshore scenarios, respectively. In (B), representing scenario B, the radii of the circles were 1, 1.5, and 16 km for the sheltered, exposed, and offshore scenarios, respectively. The colormap used is described in Thyng et al. (2016).
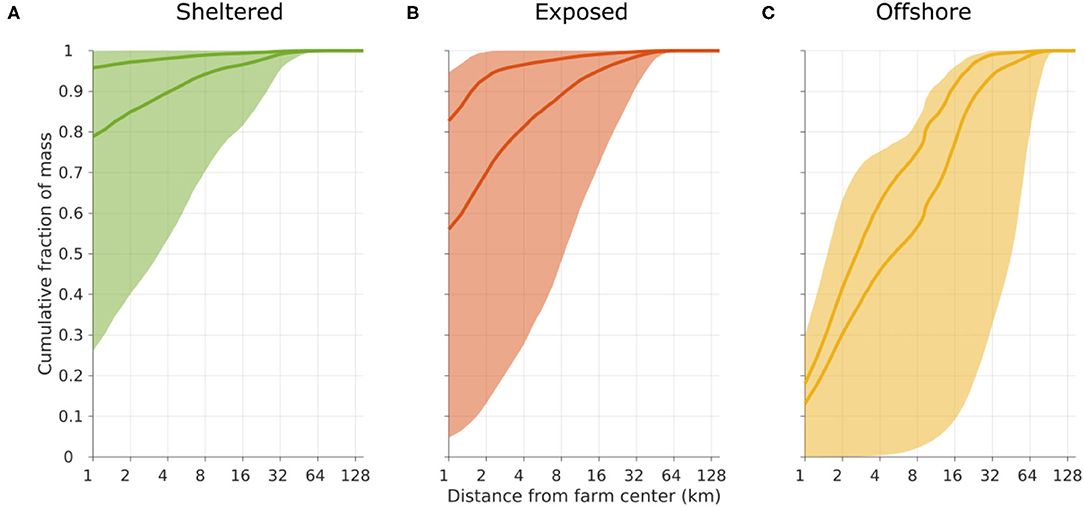
Figure 4. Cumulative frequency plot of the transport distance of POM before sedimentation on the seafloor, released from the sheltered [(A), green], exposed [(B), red], and offshore [(C), yellow] sites. The shaded regions indicate the span from considering only the slowest sinking D1 (lower limit) to considering only the fastest sinking D4 (upper limit) compartments. The darker curves represent scenarios A (lower curve) and B (upper curve); cf. Figure 3.
Matter in the slowest sinking POM compartment D1 was transported relatively far for all release sites. In particular at the offshore location, there was a potential for transport of around 40% of the POM more than 60 km away (Figure 4). In contrast, the fastest sinking POM (compartment D4) released from the sheltered and exposed sites, never moved more than 2 km, thus in practice remaining within the near zone. At the offshore site, around 30% the D4 POM was transported more than 4 km away before depositing.
3.2. Deposition Depth
The average deposition depths of the POM varied according to the location, reflecting the bottom depth in the region around the release sites (Figures 1, 5). POM released from the offshore location deposited significantly deeper than that released from both the sheltered and exposed sites for all POM compartments D1 to D4 (see confidence intervals in Figure 5). In this case, the deposition depth varied significantly between POM compartments as well, except between D3 and D4. The D1 POM deposited shallower than the other compartments probably because the settling velocity allowed for transport out into deeper waters, and then toward the shallow watered archipelago to the East of the offshore site and directly South West and East of the exposed site (Figure 3). For each POM component Dj the median deposition depth was shallower when released from the sheltered than the exposed site. Between POM compartments, there were significant differences in the median deposition depths between D1 and D4 only.
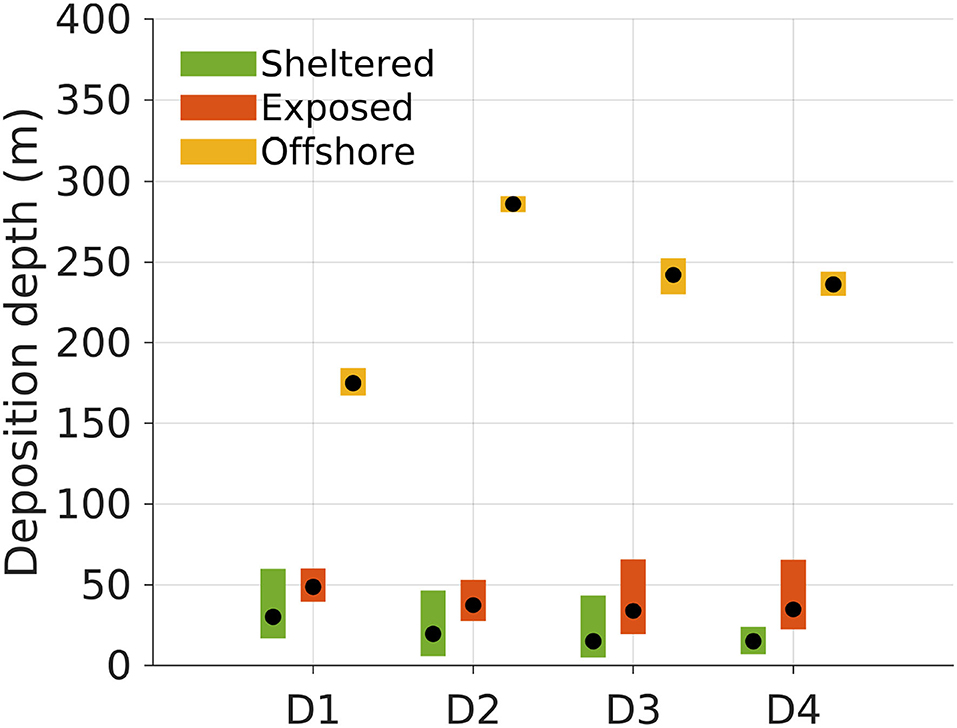
Figure 5. Deposition depths of POM compartments D1 to D4 released from the surface at the three locations (sheltered, 18 m depth; exposed, 40 m depth; offshore, 232 m depth; Figure 1). The black dots indicate the median deposition depth of the POM for each release site and compartment. The colored bars represent the 95% confidence intervals for the median deposition depths based on the simulation results. The confidence intervals were computed by bootstrapping, extracting 10, 000 subsamples from the original deposition field 100, 000 times.
3.3. Time to Settlement of Released POM
The time to settlement of the released POM was estimated based on the median deposition depths δj (Figure 5) and the sinking velocities (Table 1) of POM compartments j = 1, 2, 3, 4:
The fastest sinking POM compartments (D3, D4) deposited within a few hours at all the locations (Table 3). The slower sinking compartments spent, on average (median) up to 3(D2) and 20 days (D1) in suspension.
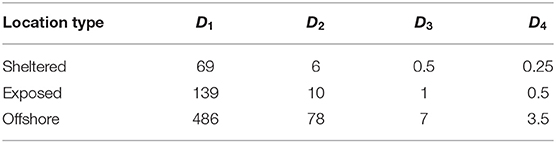
Table 3. Estimated time until settlement (h) of the four POM compartments released from the three sites.
3.4. Organic Loading
The dispersal results were translated into maximum organic loading through (8) and visualized as a function of harvested kelp biomass (t ha−1) and biomass loss [in percentages of the NPP, Equation (7); Figure 6]. The carbon loading at the seafloor was greatest at the sheltered site, in line with the distribution pattern (Figure 3). The partitioning of the biomass between the different POM compartments impacted significantly on the magnitude of the organic carbon loading. Thus, the increase in the maximum carbon loading from scenario A (slow sinking) to B (fast sinking) was 65% for the sheltered location, 58% for the exposed location, and 56% for the offshore location, as POM accumulated over a smaller area.
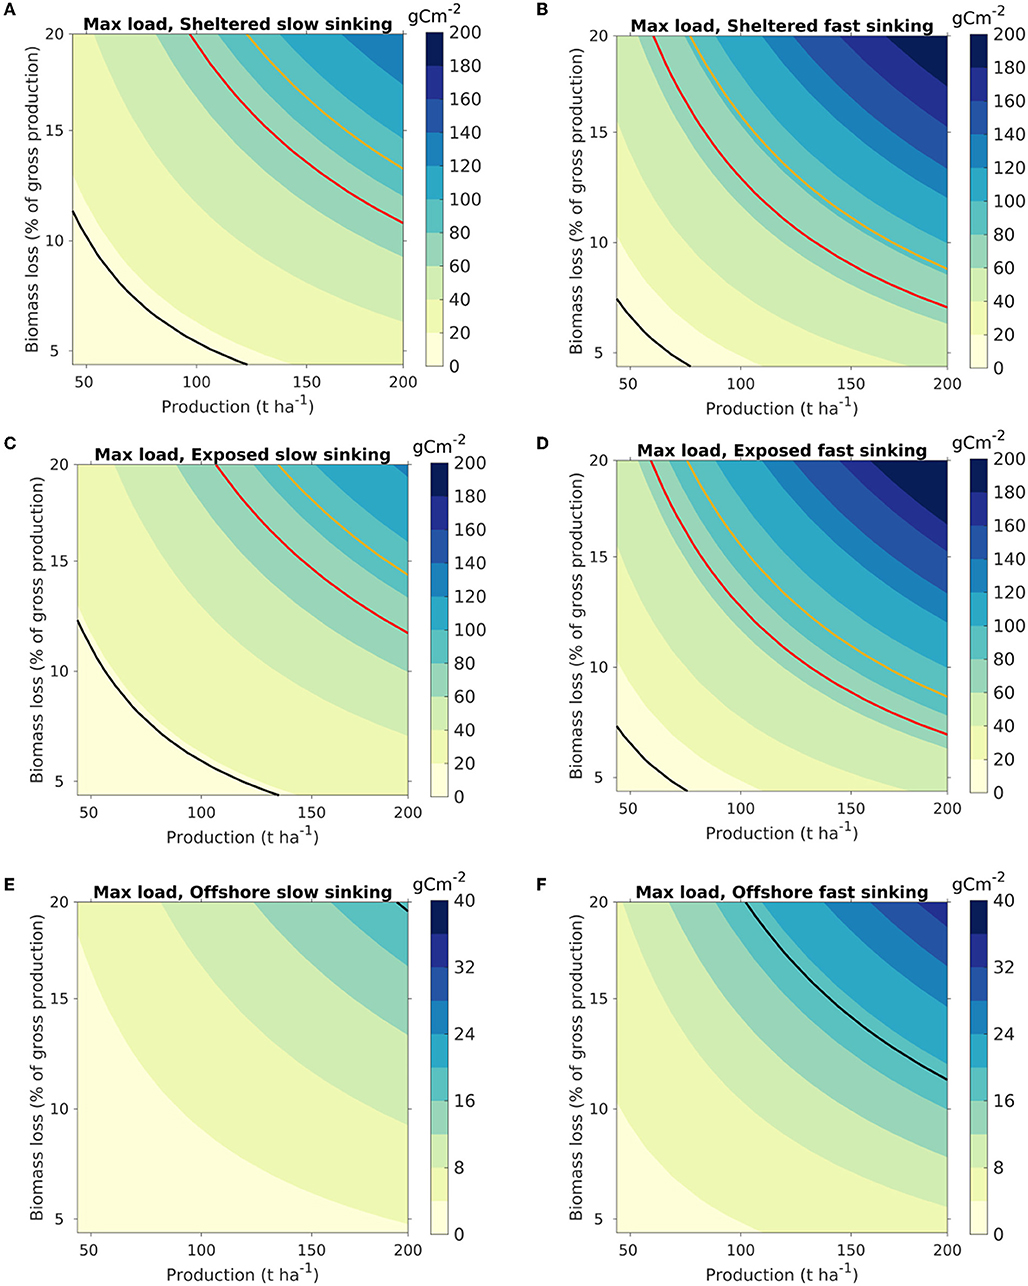
Figure 6. Maximum organic loading on the seafloor from kelp cultivation, visualized as a function of the production density (t WW harvested biomass ha−1) of S. latissima (abscissa) and the biomass loss (ordinate) (Equation 8). The colors indicate the highest loading within the model domain, with release from each of the three locations [sheltered: (A,B); exposed: (C,D); offshore: (E,F)]. The color scaling varies between the release locations. Results are shown for scenarios A [slow sinking POM, (A,C,E)] and B [fast sinking POM; (B,D,F)]. The isocurve in red represents 72 g C m−2, corresponding to estimated net pelagic primary production in the Norwegian Sea (Skogen et al., 2007; Hansen and Samuelsen, 2009). The black and yellow isocurves represent loadings of 19 and 90 g C m−2, equivalent to the loading from an S. latissima production of 100 t WW ha−1 with, respectively, 5 and 20% loss calculated from (Equation 7), assuming direct deposition without horizontal advection of the POM (cf. Equation 7).
The maximum carbon loading relative to the average (= max) carbon loading in a situation where the POM sinks straight down (no horizontal advection) is expressed by the quotient of Equation (8) to (7):
This quotient is independent of the cultivation volume and the fraction of matter deposited. A value below 1 means that the matter is dispersed more than in the passive (no horizontal advection) scenario, while a value above 1 indicates that aggregation of matter contributes to the maximum carbon loading (Figure 2). The average loading rates should be the same, assuming no degradation or consumption. The fractions (rounded to one decimal place) for the Sheltered location were 0.8 and 1.2 for Scenarios A and B, respectively. For the exposed location the fractions were 0.7 and 1.2. For the offshore location, the fractions were 0.1 and 0.2.
4. Discussion
POM is inevitably released from kelp farms during the growth season (Zhang et al., 2012; Fieler et al., 2021) and enters the surrounding environment. How this POM is dispersed, transported and deposited, depends on a number of factors, including the position and exposure level of the farm site. On the seafloor, kelp POM is a food source for the benthic community (Renaud et al., 2015; Queirs et al., 2019) and/or potentially impacts the fauna community negatively (Campbell et al., 2019; Harbour et al., 2021b). A fraction of the carbon in the POM escapes faunal digestion and microbial degradation and is consequently buried in the seafloor. This leads to sequestration of the organic carbon and thus forms a pathway for climate mitigation through removal of carbon initially fixed from atmospheric CO2 during kelp growth (Krause-Jensen and Duarte, 2016; Duarte et al., 2017).
In this article, we have approached the problem of how kelp POM released from different kelp cultivation sites is distributed in time and space by applying a hydrodynamic model. The purpose has been to investigate how some important properties (detritus fragment size and sinking speeds) and site characteristics (water depth, current speeds) impact the foot print of kelp farms and their contribution of organic loading on the seafloor and downstream potential for carbon sequestration. The dispersal results were used to provide a general formulation of the distribution and traveling distance for three scenarios of coastal, exposed and offshore kelp farming, respectively. This enabled predictions of the deposition and maximum organic loading potential (g C m−2 per t WW harvested biomass) for future cultivation scenarios (Broch et al., 2019) as a function of the total biomass harvested and the loss fraction. Previous studies have considered dispersal of kelp detritus from natural populations (Filbee-Dexter et al., 2018).
While a Norwegian region was the setting for this study, similar kelp communities exist in other European temperate regions (Smale et al., 2022), and cultivation of S. latissima presently takes place from Portugal to sub-arctic regions of Norway (Azevedo et al., 2019; Forbord et al., 2020). The results described here are therefore relevant for other regions as well.
4.1. Sinking Speeds and Transport
The deposition area and transport distance from the release point(s) depended substantially on the sinking rates used in the simulations.
The export transport distance and thus the ecological impact area is closely linked to fraction size and particulate sinking rates. Smaller detritus fractions have lower sinking rates and potentially travel further (Wernberg and Filbee-Dexter, 2018). This leads to larger impact areas of kelp farming but with potentially a lower organic loading and following ecological impact (Sweetman et al., 2014). Conversely, larger POM fractions (with greater sinking speeds),will deposit over a smaller area, with potentially greater local effects.
Even the fast sinking POM components (D3,D4) were transported far relative to fecal and feed particles from fin fish farming (Broch et al., 2017). This can be explained by two factors. Firstly, the sinking rates even of D3 and D4 were low relative to those used in deposition studies for fin fish farming. Settling velocities used in Chang et al. (2014) were a mean of 3.2 × 10⁻² ms−1 for fecal and 11.0×10⁻² ms−1 for feed particles). Secondly, the waters around the exposed and offshore release locations were deep relative to typical coastal fin fish farming locations (Chang et al., 2014; Broch et al., 2017).
Sinking speeds ranging 3 orders of magnitude were considered, allowing for interpretation of the results in the context of a wide range of possible distributions of the biomass between different sinking speeds. In particular, sinking speeds for blade fragments of S. latissima have not been properly established. In Wernberg and Filbee-Dexter (2018), the seaweed POM was correlated to the size and mass of L. hyperborea particles. The weight per unit area of frond tissue in cultivated S. latissima seems to be a lot lower than in naturally growing L. hyperborea (Foldal, 2018; Wernberg and Filbee-Dexter, 2018). This indicates that the sinking speeds of S. latissima POM may be lower than for, e.g., L. hyperborea. On the other hand the average density of L. hyperborea blade tissue fragments reported by Wernberg and Filbee-Dexter (2018) was 1064±96kg m−3. Corresponding values for S. latissima blade fragments are 1092±91 (Vettori and Nikora, 2017) and 1120±130 (Norvik, 2017).
Many deposition and transport models employ Lagrangian (i.e., particle based) rather than Eulerian (i.e., concentration fields) approaches (Cromey et al., 2002). One advantage of Eulerian models, used in the present study, is that there is no need to convert from particles representing various parts of the released organic mass to concentration fields. On the other hand, it is possible to track the history of single particles in Lagrangian approaches, and to include many properties of the particles (size, sinking rates, composition) without increasing the computational costs unduly.
There is evidence that the bottom type may impact on the resuspension (Carvajalino-Fernández et al., 2020), though we have not explicitly taken this into consideration here. The effects of resuspension are probably not underestimated since we have used a critical shear velocity for resuspension very close to the parameter used by Kuhrts et al. (2004) for the “fluff” layer of fine matter.
Degradation of kelp POM may take several weeks or even months (de Bettignies et al., 2020b; Smale et al., 2022), with the photosynthetic capacity still partially intact (Frontier et al., 2021). This impacts on the potential for large-scale and long-term transport, and for how long the POM is left on the sea floor has bearing on the degradation rates and the associated bacterial community (Brunet et al., 2021). Therefore, a number of coupled inter-actions between physical transport and biological degradation determine where and in what state kelp POM settles on the sea floor. This should be addressed in more detail in future studies.
4.2. Organic Loading and CO2 Sequestration
The organic loading rates were presented in terms of g C m−2 per t WW harvested biomass. While a somewhat unorthodox unit, it allows for interpretation of the results both in terms of cultivation intensities and for farm-size independent assessments and generalized appraisals. Thus, the maximum organic loading on the seafloor can be visualized as a function of the production density and the biomass loss (Figure 6). For instance, the organic loading from a farm at a sheltered site with an export of fast sinking (“large”) POM producing 150 t WW ha−1 and having a loss rate of 11% of the gross production [defined in this context by Equation (7)] will result in an added organic loading of 60–80 gC m−2 y−1, equivalent to the average net pelagic primary production in the Norwegian sea, estimated at 65–79 gC m−2 y−1 (Skogen et al., 2007; Hansen and Samuelsen, 2009). Thus, the potential for organic input to the sea floor per unit area doubles in this case, assuming that neither kelp nor phytoplankton POM is grazed of remineralized in the water column before depositing on the sea floor. This leads to a conservative estimate for the relative contribution of kelp organic loading, as phytoplankton is largely consumed by secondary producers (e.g., zooplankton) or remineralized in the water column. The present results may be used as a starting point to estimate loading for used in risk management (upper estimates, max loading) until further, more detailed data from large scale operations become available.
Kelp POM deposition on the seafloor also potentially contributes to carbon sequestration through sedimentation and long-term storage of carbon in seafloor sediments or deep water layers (Duarte et al., 2017, 2021). This implies that kelp organic matter is escaping faunal digestion and microbial degradation on the sea floor and is locked away by sedimentation at climatically significant time scales of decades to centuries (IPCC, 2019).
Our simulation results indicate that none of the matter released from any of the 3 locations considered here would reach far and deep enough to move into the North Atlantic thermohaline circulation. A large fraction of the D1 compartment had not deposited by the end of the simulation, and was even transported out of the model domain, leaving deposition in deep waters outside the continental shelf an open question.
The carbon sequestration potential is, ultimately, dependent on how POM released from kelp farming degrades. This, in turn, depends not only on the composition of the matter, but on the size fraction and sinking rates, as well as oxygen, temperature, and the bacterial community (Wernberg and Filbee-Dexter, 2018; Brunet et al., 2021; Filbee-Dexter et al., 2021). As the time in suspension is strongly affected by sinking rates, we see that the degradation of kelp POM in the water column thus depends on the size of the particles; the average suspension time for the slowest sinking POM (model compartment D1) was more than 100 times as long as that of the fastest sinking POM (model compartment D4). This relates well to the difference in sinking speeds applied. However, the model has not included a compartment for burial of POM, so that, in principle, all the deposited matter was available for resuspension. This may have contributed to increasing the average suspension time.
4.3. Conclusions
The issue of transport and deposition is basically simple: The horizontal dispersal distance increases with water depth and decreases with increasing sinking rates. Thus, while a specific model setup has been applied in the present study, the simulation scenarios link general features of the released matter (sinking speeds) to water currents and depth, and the results can thus be applied generally. The results are scalable to any farm size and actual release rates from seaweed farming.
This study underscores the importance of constraining the dispersal and deposition of detritus from kelp cultivation in order to better understand and quantify the associated environmental risks (the effects of organic loading), and to explore the potential for seaweed farming as a climate mitigation solution through sediment carbon sequestration. This is becoming increasingly important with the global increase of the seaweed farming industry, and the urgent needs for decreasing the atmospheric and marine CO2 concentrations.
We suggest that further research includes focus on the size distribution and sinking velocity of POM from seaweed farms, spanning the range of cultivated species and their physical properties and physiological conditions when detached from the farm. Also, the distribution of detritus between size fractions should be further investigated. Finally, the degradation dynamics, and how this interacts with the size spectrum and transport, should be given attention.
Data Availability Statement
The raw data supporting the conclusions of this article will be made available by the authors, without undue reservation.
Author Contributions
OB, KH, and IE conceived and planned the article, contributed to the analysis of the results, and the writing of the article. OB ran the dispersal simulations. All authors contributed to the article and approved the submitted version.
Funding
This research was funded by the Research Council of Norway grant no. 267536 (KELPPRO). Additional resources for OB and IE were provided by the GENIALG (GENetic diversity exploitation for Innovative macro-ALGal biorefinery) project funded by the European Union's Horizon 2020 Framework Program under grant agreement no. 727892 and by the project Seaweed CDR financed by SINTEF's Global Climate Fund. The open access publication fee was financed by SINTEF.
Conflict of Interest
OB and IE were employed by SINTEF Ocean. KH was employed by NIVA.
Publisher's Note
All claims expressed in this article are solely those of the authors and do not necessarily represent those of their affiliated organizations, or those of the publisher, the editors and the reviewers. Any product that may be evaluated in this article, or claim that may be made by its manufacturer, is not guaranteed or endorsed by the publisher.
Acknowledgments
Morten Alver (Norwegian University of Science and Technology) wrote an early version of the kelp detritus transport and deposition module.
References
Aarakawa, A., and Lamb, V. R. (1977). “Computational design of the basic dynamical processes of the UCLA general circulation model,” in General Circulation Models of the Atmosphere, Methods in Computational Physics: Advances in Research and Applications, Vol. 17, ed J. Chang (New York: Elsevier), 173–265.
Aldridge, J., Mooney, K., Dabrowski, T., and Capuzzo, E. (2021). Modelling effects of seaweed aquaculture on phytoplankton and mussel production. application to strangford lough (northern ireland). Aquaculture 53, 736400. doi: 10.1016/j.aquaculture.2021.736400
Azevedo, I. C., Duarte, P. M., Marinho, G. S., Neumann, F., and Sousa-Pinto, I. (2019). Growth of saccharina latissima (laminariales, phaeophyceae) cultivated offshore under exposed conditions. Phycologia 58, 504–515. doi: 10.1080/00318884.2019.1625610
Beldring, S., Engeland, K., Roald, L. A., Sælthun, N. R., and Voksø, A. (2003). Estimation of parameters in a distributed precipitation-runoff model for Norway. Hydrol. Earth. Systems Sci., 7, 304–3016. doi: 10.5194/hess-7-304-2003
Broch, O. J., Alver, M. O., Bekkby, T., Gundersen, H., Forbord, S., Handå, A., et al. (2019). The kelp cultivation potential in coastal and offshore regions of norway. Front. Marine Sci. 5, 529. doi: 10.3389/fmars.2018.00529
Broch, O. J., Daae, R. L., Ellingsen, I. H., Nepstad, R., Bendiksen, E. Å., Reed, J. L., et al. (2017). Spatiotemporal dispersal and deposition of fish farm wastes: a model study from central norway. Front. Mar. Sci. 4, 199. doi: 10.3389/fmars.2017.00199
Broch, O. J., Klebert, P., Michelsen, F. A., and Alver, M. O. (2020). Multiscale modelling of cage effects on the transport of effluents from open aquaculture systems. PLoS ONE 15, e0228502. doi: 10.1371/journal.pone.0228502
Brunet, M., de Bettignies, F., Le Duff, N., Tanguy, G., Davoult, D., Leblanc, C., et al. (2021). Accumulation of detached kelp biomass in a subtidal temperate coastal ecosystem induces succession of epiphytic and sediment bacterial communities. Environ. Microbiol. 23, 1638–1655. doi: 10.1111/1462-2920.15389
Campbell, I., Macleod, A., Sahlmann, C., Neves, L., Funderud, J., verland, M., et al. (2019). The environmental risks associated with the development of seaweed farming in europe - prioritizing key knowledge gaps. Front. Marine Sci. 6, 107. doi: 10.3389/fmars.2019.00107
Carroll, M. L., Cochrane, S., Fieler, R., Velvin, R., and White, P. (2003). Organic enrichment of sediments from salmon farming in Norway: environmental factors, management practices, and monitoring techniques. Aquaculture 226, 165–180. doi: 10.1016/S0044-8486(03)00475-7
Carvajalino-Fernández, M. A., Sævik, P. N., Johnsen, I. A., Albretsen, J., and Keeley, N. B. (2020). Simulating particle organic matter dispersal beneath Atlantic salmon fish farms using different resuspension approaches. Mar. Pol. Bull. 161, 111685. doi: 10.1016/j.marpolbul.2020.111685
Chang, B. D., Page, F. H., Losier, R. J., and McCurdy, E. P. (2014). Organic enrichment at salmon farms in the Bay of Fundy, Canada: DEPOMOD predictions versus observed sediment sulfide concentrations. Aquacult. Environ. Interact. 5, 185–208. doi: 10.3354/aei00104
Cromey, C. J., Nickell, T. D., and Black, K. D. (2002). Depomod modelling the deposition and biological effects of waste solids from marine cage farms. Aquaculture 214, 211–239. doi: 10.1016/S0044-8486(02)00368-X
de Bettignies, F., Dauby, P., Lepoint, G., Riera, P., Bocher, E., Bohner, O., et al. (2020a). Temporal succession of a macrofaunal community associated with kelp frament accumulations in an in situ experiment. Mar. Ecol. Prog. Ser 656, 109–121. doi: 10.3354/meps13391
de Bettignies, F., Dauby, P., Thomas, F., Gobet, A., Delage, L., Bohner, O., et al. (2020b). Degradation dynamics and processes associated with the accumulation of laminaria hyperborea (phaeophyceae) kelp fragments: an in situ experimental approach. J. Phycol. 56, 1481–1492. doi: 10.1111/jpy.13041
Dee, D. P., Uppala, S. M., Simmons, A. J., Berrisford, P., Poli, P., Kobayashi, S., et al. (2011). The era-interim reanalysis: configuration and performance of the data assimilation system. Quart. J. R. Meteorol. Soc. 137, 553–597. doi: 10.1002/qj.828
Duarte, C. M., Bruhn, A., and Krause-Jensen, D. (2021). A seaweed aquaculture imperative to meet global sustainability targets. Nat. Sustain. doi: 10.1038/s41893-021-00773-9
Duarte, C. M., Wu, J., Xiao, X., Bruhn, A., and Krause-Jensen, D. (2017). Can seaweed farming play a role in climate change mitigation and adaption? Front. Mar. Sci. 4, 1–8. doi: 10.3389/fmars.2017.00100
Duggins, D. O., Simenstad, C. A., and Estes, J. A. (1989). Magnification of secondary production by kelp detritus in coastal marine ecosystems. Science 245, 170–173. doi: 10.1126/science.245.4914.170
FAO (2020). The State of World Fisheries and Aquaculture. Sustainability in Action. Technical Report, FAO of the UN, Rome.
Fieler, R., Greenacre, M., Matsson, S., Neves, L., Forbord, S., and Hancke, K. (2021). Erosion dynamics of cultivated kelp, saccharina latissima, and implications for environmental management and carbon sequestration. Front. Marine Sci. 8, 1573. doi: 10.3389/fmars.2021.632725
Filbee-Dexter, K., Feehan, C., Smale, D., Krumhansl, K., Augustine, S., de Bettignies, F., et al. (2021). Ocean temperature controls kelp decomposition and carbon sink potential. Res. Square. 32, 2215–2232. doi: 10.21203/rs.3.rs-38503/v1
Filbee-Dexter, K., Pedersen, M., Fredriksen, S., Norderhaug, K., Rinde, E.T K, Albretsen, J., et al. (2020). Carbon export is facilitated by sea urchins tranforming kelp detritus. Oecologia 192, 213–225. doi: 10.1007/s00442-019-04571-1
Filbee-Dexter, K., Wernberg, T., Norderhaug, K. M., Ramirez-Llodra, E., and Pedersen, M. F. (2018). Movement of pulsed resourcer subsidies from kelp forests to deep fjords. Oecologia 187, 291–304. doi: 10.1007/s00442-018-4121-7
Foldal, S. (2018). Morfologiske Relasjonar Til Dyrka Saccharina Latissima Ved Tre Stasjonar Langs Norskekysten (Master's thesis), Norwegian University of Science and Technology, Trondheim, Norway.
Forbord, S., Matsson, S., Brodahl, G., Bluhm, B., Broch, O., Hand, A., et al. (2020). Latitudinal, seasonal and depth-dependent variation in growth, chemical composition and biofouling of cultivated sugar kelp (saccharina latissima) along the norwegian coast. J. Appl. Phycol. 32, 2215–2232. doi: 10.1007/s10811-020-02038-y
Frontier, N., de Bettignies, F., Foggo, A., and Davoult, D. (2021). Sustained productivity and respiration of degrading kelp detritus in the shallow benthos: detached or broken, but not dead. Marine Environ. Res. 166, 105277. doi: 10.1016/j.marenvres.2021.105277
Hadley, S., Wild-Allen, K., Johnson, C., and Macleod, C. (2018). Investigation of broad scale implementation of integrated multitrophic aquaculture using a 3d model of an estuary. Marine Pollut. Bull. 133, 448–459. doi: 10.1016/j.marpolbul.2018.05.045
Handå, A., Forbord, S., Wang, X., Broch, O. J., Dahle, S. W., Strseth, T. R., et al. (2013). Seasonal- and depth-dependent growth of cultivated kelp (saccharina latissima) in close proximity to salmon (salmo salar) aquaculture in norway. Aquaculture 414–415, 191–201. doi: 10.1016/J.AQUACULTURE.2013.08.006
Hansen, C., and Samuelsen, A. (2009). Influence of horizontal model grid resolution on the simulated primary production in an embedded primary production model in the norwegian sea. J. Marine Syst. 75, 236–244. doi: 10.1016/j.jmarsys.2008.10.004
Harbour, R. P., Smith, C. R., Fernandes, T. F., and Sweetman, A. K. (2021a). Trophic ecology surrounding kelp and wood falls in deep norwegian fjords. Deep Sea Res. Part I Oceanograph. Res. Papers 173, 103553. doi: 10.1016/j.dsr.2021.103553
Harbour, R. P., Smith, C. R., Simon-Nutbrown, C., Cecchetto, M., Youn, E., Coral, C., et al. (2021b). Biodiversity, community structure and ecosystem function on kelp and wood falls in the norwegian deep sea. Mar. Ecol. Prog. Ser. 657, 73–91. doi: 10.3354/meps13541
Harrold, C., Light, K., and Lisin, S. (1998). Organic enrichment of submarine-canyon and continental-shelf benthic communities by macroalgal drift imported from nearshore kelp forests. Limnol. Oceanography 43, 669–678.
Harsson, B. G., and Preiss, G. (2012). Norwegian baseline, maritime boundaries and the UN convention of the law of the sea. Arct. Rev. Law. Polit. 3, 108–109.
IPCC (2019). IPCC SPecial REport on the Ocean and Cryosphere in a Changing Climate. eds H.-O. Prtner, D. C. Roberts, V. Masson-Delmotte, P. Zhai, M. Tignor, E. Poloczanska, et al.
Krause-Jensen, D., and Duarte, C. (2016). Substantial role of macroalgae in marine carbon sequestration. Nat. Geosci. 9, NGEO2790. doi: 10.1038/ngeo2790
Krumhansl, K. A., and Scheibling, R. E. (2012). Production and fate of kelp detritus. Mar. Ecol. Prog. Ser. 467, 281–301. doi: 10.3354/MEPS09940
Kuhrts, C., Fennel, W., and Seifert, T. (2004). Model studies of transport of sedimentary material in the western baltic. J. Marine Syst. 52, 167–190. doi: 10.1016/J.JMARSYS.2004.03.005
Lehahn, Y., Ingle, K. N., and Golberg, A. (2016). Global potential of offshore and shallow waters macroalgal biorefineries to provide for food, chemicals and energy: feasibility and sustainability. Algal Res. 17, 150–160. doi: 10.1016/j.algal.2016.03.031
Norvik, C. (2017). Design of Artificial Seaweeds for Assessment of Hydrodynamic Properties of Seaweed Farms (Master's thesis), Norwegian University of Science and Technology, Trondheim, Norway.
Ortega, A., Geraldi, N. R., Alam, I., Kamau, A. A., Acinas, S. G., Logares, R., et al. (2019). Important contribution of macroalgae to oceanic carbon sequestration. Nat. Geosci. 12, 748–754. doi: 10.1038/s41561-019-0421-8
Parke, M. (1948). Studies on British Laminariaceae I. Growth in Laminaria saccharina (L.) Lamour. J. Mar. Biol. Ass. UK 27, 651–709.
Pedersen, M. F., Filbee-Dexter, K., Frisk, N. L., S'arossy, Z., and Weinberg, T. (2021). Carbon sequestration potential increased by incomplete anaerobic decomposition of kelp detritus. Mar. Ecol. Prog. Ser. 660, 53–67. doi: 10.3354/meps13613
Pedersen, M. F., Filbee-Dexter, K., Norderhaug, K. M., Fredriksen, S., Frisk, N. L., Fagerli, C. W., et al. (2020). Detrital carbon production and export in high latitude kelp forests. Oecologia 192, 227–239. doi: 10.1007/s00442-019-04573-z
Queirs, A. M., Stephens, N., Widdicombe, S., Tait, K., McCoy, S. J., Ingels, J., et al. (2019). Connected macroalgal-sediment systems: blue carbon and food webs in the deep coastal ocean. Ecol. Monographs 89, e01366. doi: 10.1002/ecm.1366
Renaud, P. E., Lkken, T. S., Jrgensen, L. L., Berge, J., and Johnson, B. J. (2015). Macroalgal detritus and food-web subsidies along an arctic fjord depth-gradient. Front. Marine Sci. 2, 31. doi: 10.3389/fmars.2015.00031
Sjtun, K. (1993). Seasonal lamina growth in two age groups of Laminaria saccharina (L.) Lamour. in Western Norway. Botanica Marina 36, 433–441.
Skardhamar, J., and Svendsen, H. (2005). Circulation and shelf-ocean interactions off North Norway. Cont. Shelf. Res. 25, 1541–1560. doi: 10.1016/j.csr.2005.04.007
Skogen, M. D., Budgell, W. P., and Rey, F. (2007). Interannual variability in Nordic seas primary production. ICES J. Marine Sci. 64, 889–898. doi: 10.1093/icesjms/fsm063
Slagstad, D., and McClimans, T. A. (2005). Modelling the ecosystem dynamics of the Barents sea including the marginal ice zone: I. Physical and chemical oceanography. J. Mar. Sys. 58, 1–18. doi: 10.1016/j.jmarsys.2005.05.005
Smale, D. A., Pessarrodona, A., King, N., and Moore, P. J. (2022). Examining the production, export, and immediate fate of kelp detritus on open-coast subtidal reefs in the northeast atlantic. Limnol. Oceanography. 9999, 1–14.
Sundfjord, A., Ellingsen, I., Sagstad, D., and Svendsen, H. (2008). Vertical mixing in the marginal ize zone of the northern Barents Sea - results from numerical model experiments. Deep Sea Res. II 55, 2154–2168. doi: 10.1016/j.dsr2.2008.05.027
Sweetman, A. K., Norling, K., Gunderstad, C., Haugland, B. T., and Dale, T. (2014). Benthic ecosystem functioning beneath fish farms in different hydrodynamic environments. Limnol. Oceanography 59, 1139–1151. doi: 10.4319/lo.2014.59.4.1139
Thyng, K. M., Greene, C. A., Hetland, R. D., Zimmerle, H. M., and DiMarco, S. F. (2016). True colors of oceanography: guidelines for effective and accurate colormap selection. Oceanography 29, 9–13. doi: 10.5670/oceanog.2016.66
van der Molen, J., Ruardij, P., Moone, K., Kerrison, P., O'Connor, N. E., Gorman, E., et al. (2018). Modelling potential produciton of macroalgae farms in UK and Dutch coastal waters. Biogeosciences 15, 1123–1147. doi: 10.5194/bg-15-1123-2018
Vettori, D., and Nikora, V. (2017). Morphological and mechanical properties of blades of saccharina latissima. Estuarine Coastal Shelf Sci. 196, 1–9. doi: 10.1016/j.ecss.2017.06.033
Visch, W., Kononets, M., Hall, P. O., Nylund, G. M., and Pavia, H. (2020). Environmental impact of kelp (saccharina latissima) aquaculture. Marine Pollut. Bull. 155, 110962. doi: 10.1016/j.marpolbul.2020.110962
Walls, A., Kennedy, R., Edwards, M., and Johnson, M. (2017). Impact of kelp cultivation on the ecological status of benthic habitats and zostera marina seagrass biomass. Marine Pollut. Bull. 123, 19–27. doi: 10.1016/j.marpolbul.2017.07.048
Warner, J. C., Sherwood, C. R., Signell, R. P., Harris, C. K., and Arango, H. G. (2008). Development of a three-dimensional, regional, coupled wave, current, and sediment-transport model. Comput. Geosci. 34, 1284–1306. doi: 10.1016/j.cageo.2008.02.012
Wassmann, P., Slagstad, D., Riser, C. W., and Reigstad, M. (2006). Modelling the ecosystem dynamics of the Barents Sea including the marginal ice zone II. Carbon flux and interannual variability. J. Mar. Sys. 59, 1–24. doi: 10.1016/j.jmarsys.2005.05.006
Wernberg, T., and Filbee-Dexter, K. (2018). Grazers extend blue carbon transfer by slowing sinking speeds of kelp detritus. Sci. Rep. 8, 17180. doi: 10.1038/s41598-018-34721-z
Zhang, J., Fang, J., Wang, W., Du, M., Gao, Y., and Zhang, M. (2012). Growth and loss of mariculture kelp Saccharina japonica in Sungo Bay, China. J. Appl. Phycol. 24, 1209–1216. doi: 10.1007/s10811-011-9762-4
Keywords: seaweed aquaculture, ocean model, organic loading, carbon export, sedimentation—dispersion model, carbon sequestration, kelp
Citation: Broch OJ, Hancke K and Ellingsen IH (2022) Dispersal and Deposition of Detritus From Kelp Cultivation. Front. Mar. Sci. 9:840531. doi: 10.3389/fmars.2022.840531
Received: 21 December 2021; Accepted: 31 January 2022;
Published: 22 February 2022.
Edited by:
Jinghui Fang, Chinese Academy of Fishery Sciences (CAFS), ChinaReviewed by:
Dominique Davoult, Sorbonne Universités, FranceAndrew Kvassnes Sweetman, Heriot-Watt University, United Kingdom
Copyright © 2022 Broch, Hancke and Ellingsen. This is an open-access article distributed under the terms of the Creative Commons Attribution License (CC BY). The use, distribution or reproduction in other forums is permitted, provided the original author(s) and the copyright owner(s) are credited and that the original publication in this journal is cited, in accordance with accepted academic practice. No use, distribution or reproduction is permitted which does not comply with these terms.
*Correspondence: Ole Jacob Broch, ole.jacob.broch@sintef.no