Multi-Decadal High-Resolution Data Reveal the Cryptic Vertical Movement Patterns of a Large Marine Predator Along the Californian Coast
 Samantha Andrzejaczek1*
  Taylor K. Chapple1,2 Salvador J. Jorgensen3,4 Scot D. Anderson3 Michael Castleton1 Paul E. Kanive3,5 Timothy D. White1
  Barbara A. Block1
- 1Hopkins Marine Station, Stanford University, Pacific Grove, CA, United States
- 2Coastal Oregon Marine Experiment Station, Oregon State University, Newport, OR, United States
- 3Monterey Bay Aquarium, Monterey, CA, United States
- 4Institute of Marine Sciences, University of California, Santa Cruz, Santa Cruz, CA, United States
- 5Department of Ecology, Montana State University, Bozeman, MT, United States
Over the last two decades, satellite tagging of adult and sub-adult white sharks Carcharodon carcharias off the west coast of North America has revealed a predictable onshore-offshore migratory cycle. Our current understanding of the vertical movements exhibited by white sharks while in their coastal foraging phase in the California Current, however, remains limited. Here, we used recovered datasets from 31 archival satellite tags to quantify vertical habitat use. Tags were deployed on individuals between 2000 and 2018 and recorded depth and temperature data at continuous 1–120 s intervals before being recovered up to a year after deployments. Four satellite-tagged individuals were concurrently tagged with acoustic tags, providing precise location data when detected by acoustic receivers that allowed us to explore how reported vertical habitat use varied spatially. While in the coastal shelf waters, white sharks moved at a mean depth ± SD of 14.3 ± 4.0 m and occupied significantly deeper depths during the day than the night. High individual, temporal and spatial variation was evident in vertical movements, while consistent diel and lunar effects emphasized the importance of light-level driving vertical behavior around hunting sites. The vertical movement behaviors reported here provide knowledge of how white sharks may directly and indirectly interact with their mammalian prey in a dynamic three-dimensional system during their capital foraging phase. Temporal patterns in vertical behavior, for instance, indicated that surface waters during early morning hours are the riskiest place for prey. Combining these novel findings with higher-resolution biologging techniques in future studies will allow us to further contextualize fine-scale vertical movement behaviors of white sharks and examine the specific foraging events that could not yet be isolated in the tagging data.
Introduction
Electronic tagging has revealed that many species of marine megafauna are migratory and exhibit site fidelity, returning to the same site for foraging and/or reproduction purposes. The California Current System, for instance, is a known biological hotspot where several predatory bird, marine mammal, and fish species return to predictable locations after long-distance (>1,000 km) migrations (Block et al., 2011). Here, adult and sub-adult white sharks (Carcharodon carcharias) forage on marine mammals that aggregate at rookeries within cool, nutrient rich waters during the coastal phase of their annual migration (Ainley et al., 1981; LeBoeuf et al., 1982; Long et al., 1996). This phase typically occurs during autumn and early winter months and represents a period of capital foraging, where sharks bulk up their lipid stores before heading to oligotrophic offshore waters, where they spend the majority of the year (Jorgensen et al., 2009; Del Raye et al., 2013). Alongside direct effects (e.g., bites and/or predation attempts), foraging white sharks may also impact coastal populations of prey species through indirect effects, such as risk effects, whereby prey alter their behavior to reduce the likelihood of direct interactions occurring (Lima and Dill, 1990). In aquatic environments, the risk of predation varies across both horizontal and vertical axes, depending on the respective movement behaviors of the predator, influencing prey behavior across three dimensions (e.g., Lester et al., 2020; Beltran et al., 2021). Despite the decades of field-based research into the movement, life history and predatory behaviors of white sharks in California (e.g., Klimley, 1994; Goldman and Anderson, 1999; Boustany et al., 2002; Weng et al., 2007a; Jorgensen et al., 2009, 2019; Chapple et al., 2016), comprehensive investigation into the fine-scale vertical movement behaviors during their critical coastal foraging phase remains limited.
Fine-scale movements and hunting behaviors of white sharks on the Californian coast have traditionally been explored through discrete observational studies (e.g., Klimley et al., 1992) or active acoustic tracking (e.g., Goldman and Anderson, 1999; Klimley et al., 2001, 2002). These studies have provided insights into how white sharks may hunt around aggregation sites. While searching for prey, white sharks are hypothesized to swim near the bottom of coastal sites to remain concealed from surface-dwelling prey while maintaining vision with surface waters (Strong, 1996; Goldman and Anderson, 1999). During the daytime, it is hypothesized that sharks can maintain visual contact with the surface from depths of at least 30 m, and initiate attacks from such depths. Coastal white sharks have also been recorded swimming in an oscillatory pattern, where they continuously move up and down through the water column, perhaps to search for sensory cues of prey (olfactory, visual, electrosensory), thermoregulate and/or conserve energy (Klimley et al., 2002). The short duration and discontinuous nature of these past studies, however, limits applicability at larger spatial and temporal scales where other variables, such as water temperature (Andrzejaczek et al., 2018a), prey availability (Mourier et al., 2016) and ontogeny (Afonso and Hazin, 2015), are likely to influence movement patterns. This knowledge will not only help us better understand how white sharks may directly and indirectly impact their prey in a dynamic three-dimensional system, but also how white sharks may overlap vertically with human-use activities, such as fishing and recreational ocean users.
Investigating vertical movement patterns at these larger scales requires techniques that can remotely and continuously track movements for longer periods (i.e., months). Satellite tags deployed on white sharks in California over the last two decades may offer insights into cryptic vertical movement behaviors at larger temporal and spatial scales. To date, acoustic tags and pop-up satellite archival transmitting tags (PSATs) have been attached to white sharks for periods of months-years, revealing a highly predictable migratory cycle, where sharks aggregate on the coast near pinniped rookeries from late summer (August in the northern hemisphere) and undergo long-distance migrations to offshore pelagic habitats in winter (Boustany et al., 2002; Weng et al., 2007a; Domeier and Nasby-Lucas, 2008; Jorgensen et al., 2009). PSATs used in these studies transmit a summary of recorded data through satellites following release from a tagged individual, and allow not only the horizontal tracks of individuals to be reconstructed, but also have the capacity to record additional variables, such as pressure and temperature, enabling insight into the sub-surface movement behaviors of sharks (e.g., Jorgensen et al., 2012a; Andrzejaczek et al., 2018a; Braun et al., 2018). In the event where PSATs are physically recovered, a full archival dataset can be downloaded, consisting of continuous time-series of high-resolution depth and temperature data. Although recoveries of these tags are rare, they have provided detailed insights into seasonal patterns of vertical habitat use of other elasmobranch species, such as salmon sharks (Lamna ditropis) (Coffey et al., 2017) and oceanic whitetip sharks (Carcharhinus longimanus) (Andrzejaczek et al., 2018a) and more recently, have been used to explore vertical movements at hourly-diel scales for oceanic manta rays (Mobula birostris) (Andrzejaczek et al., 2021). For white sharks, high-resolution archival data could be leveraged to make new inferences about cryptic movements during their coastal foraging phase, and explore existing hypotheses about their hunting behaviors.
Here, we use archival datasets from recovered PSAT tags deployed on sub-adult and adult white sharks from 2000 to 2018 to investigate high-resolution vertical movement patterns on the central and northern coast of California. We explore vertical movement behaviors that have been associated with hunting behaviors, such as movements associated with seabed depths and oscillatory diving. Specifically, we aim to understand how patterns vary temporally (i.e., among diel phases, lunar phases, and months of the year) and between individuals of different ontogenetic stages, and discuss the processes that may be underlying these patterns. We also supplement the dataset with existing acoustic and photo-ID data to explore how vertical movements vary spatially.
Materials and Methods
Data Collection
PSATs (PAT versions 2.0, 3.0, 4.0, MiniPAT and Mk10-PAT; Wildlife Computers, Redmond, Washington, United States) and individually coded acoustic transmitter tags (hereafter “acoustic tags”; V16-4H; Innovasea, Halifax, Nova Scotia) were deployed on white sharks at aggregation sites in central California (Año Nuevo Island, South Farallon Island, Point Reyes and Tomales Point; Figure 1) between September and February from 2000 to 2018 (Table 1) using previously described methods (Jorgensen et al., 2009). Briefly, free-swimming sharks were attracted to research vessels using a seal-shaped decoy and a small amount of olfactory attractant. Surface photography and underwater footage was used to obtain individual photo-identification images and sex, with sex determined by the absence (female) or presence (male) of claspers (Chapple et al., 2011). Total length was visually estimated as sharks swam alongside a research vessel of known length, and individuals were classified as sub-adults at > 2.4 m total length (TL), and adults at > 4.5 m TL for females (Francis, 1996) and > 3.8 m TL for males (Pratt, 1996). A 3–4 m tagging pole was used to inset a titanium dart tethered tag (see Wilson et al., 2015 for tether information) beneath the shark’s dorsal skin. Where possible (given tag supply and favorable shark behavior), both acoustic and satellite tags were deployed on the same individuals (i.e., individuals were double-tagged).
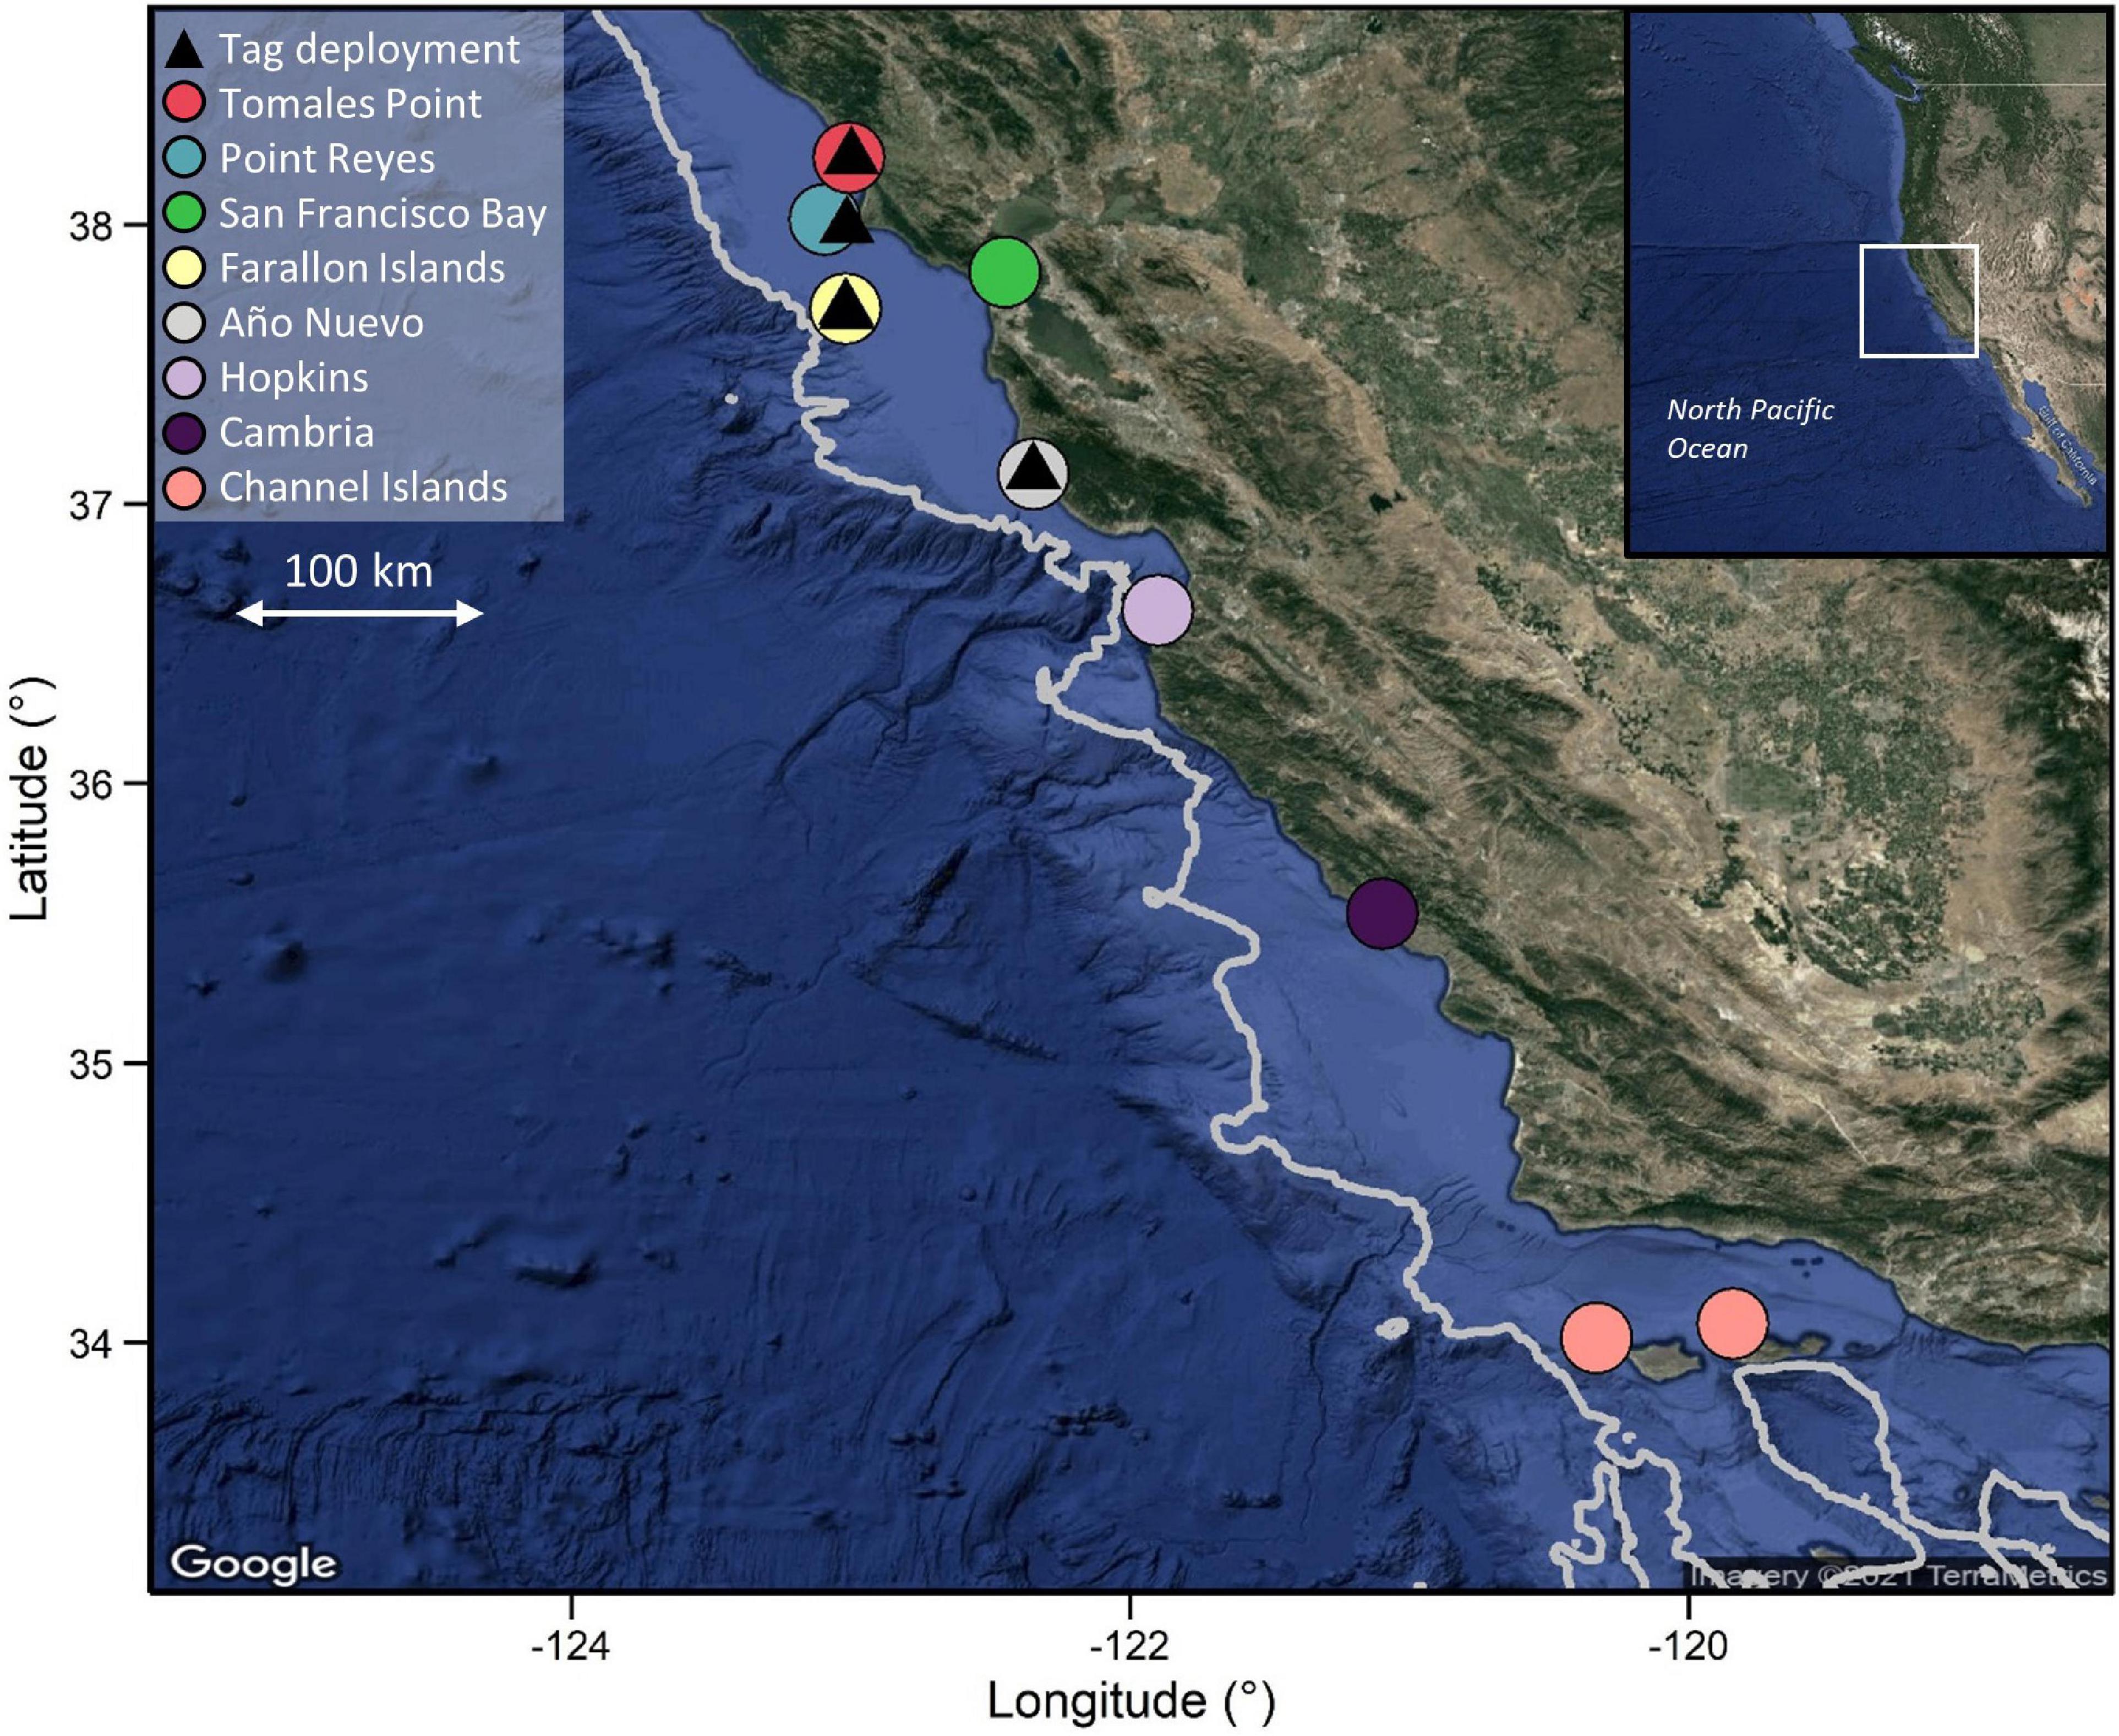
Figure 1. PSAT deployment locations on the Northern Californian coast and locations of acoustic receivers. Depth contour line represents the 1,000 m depth contour. Note that scale varies among maps. Bathymetry data were extracted from the ETOPO1 database using marmap in R.
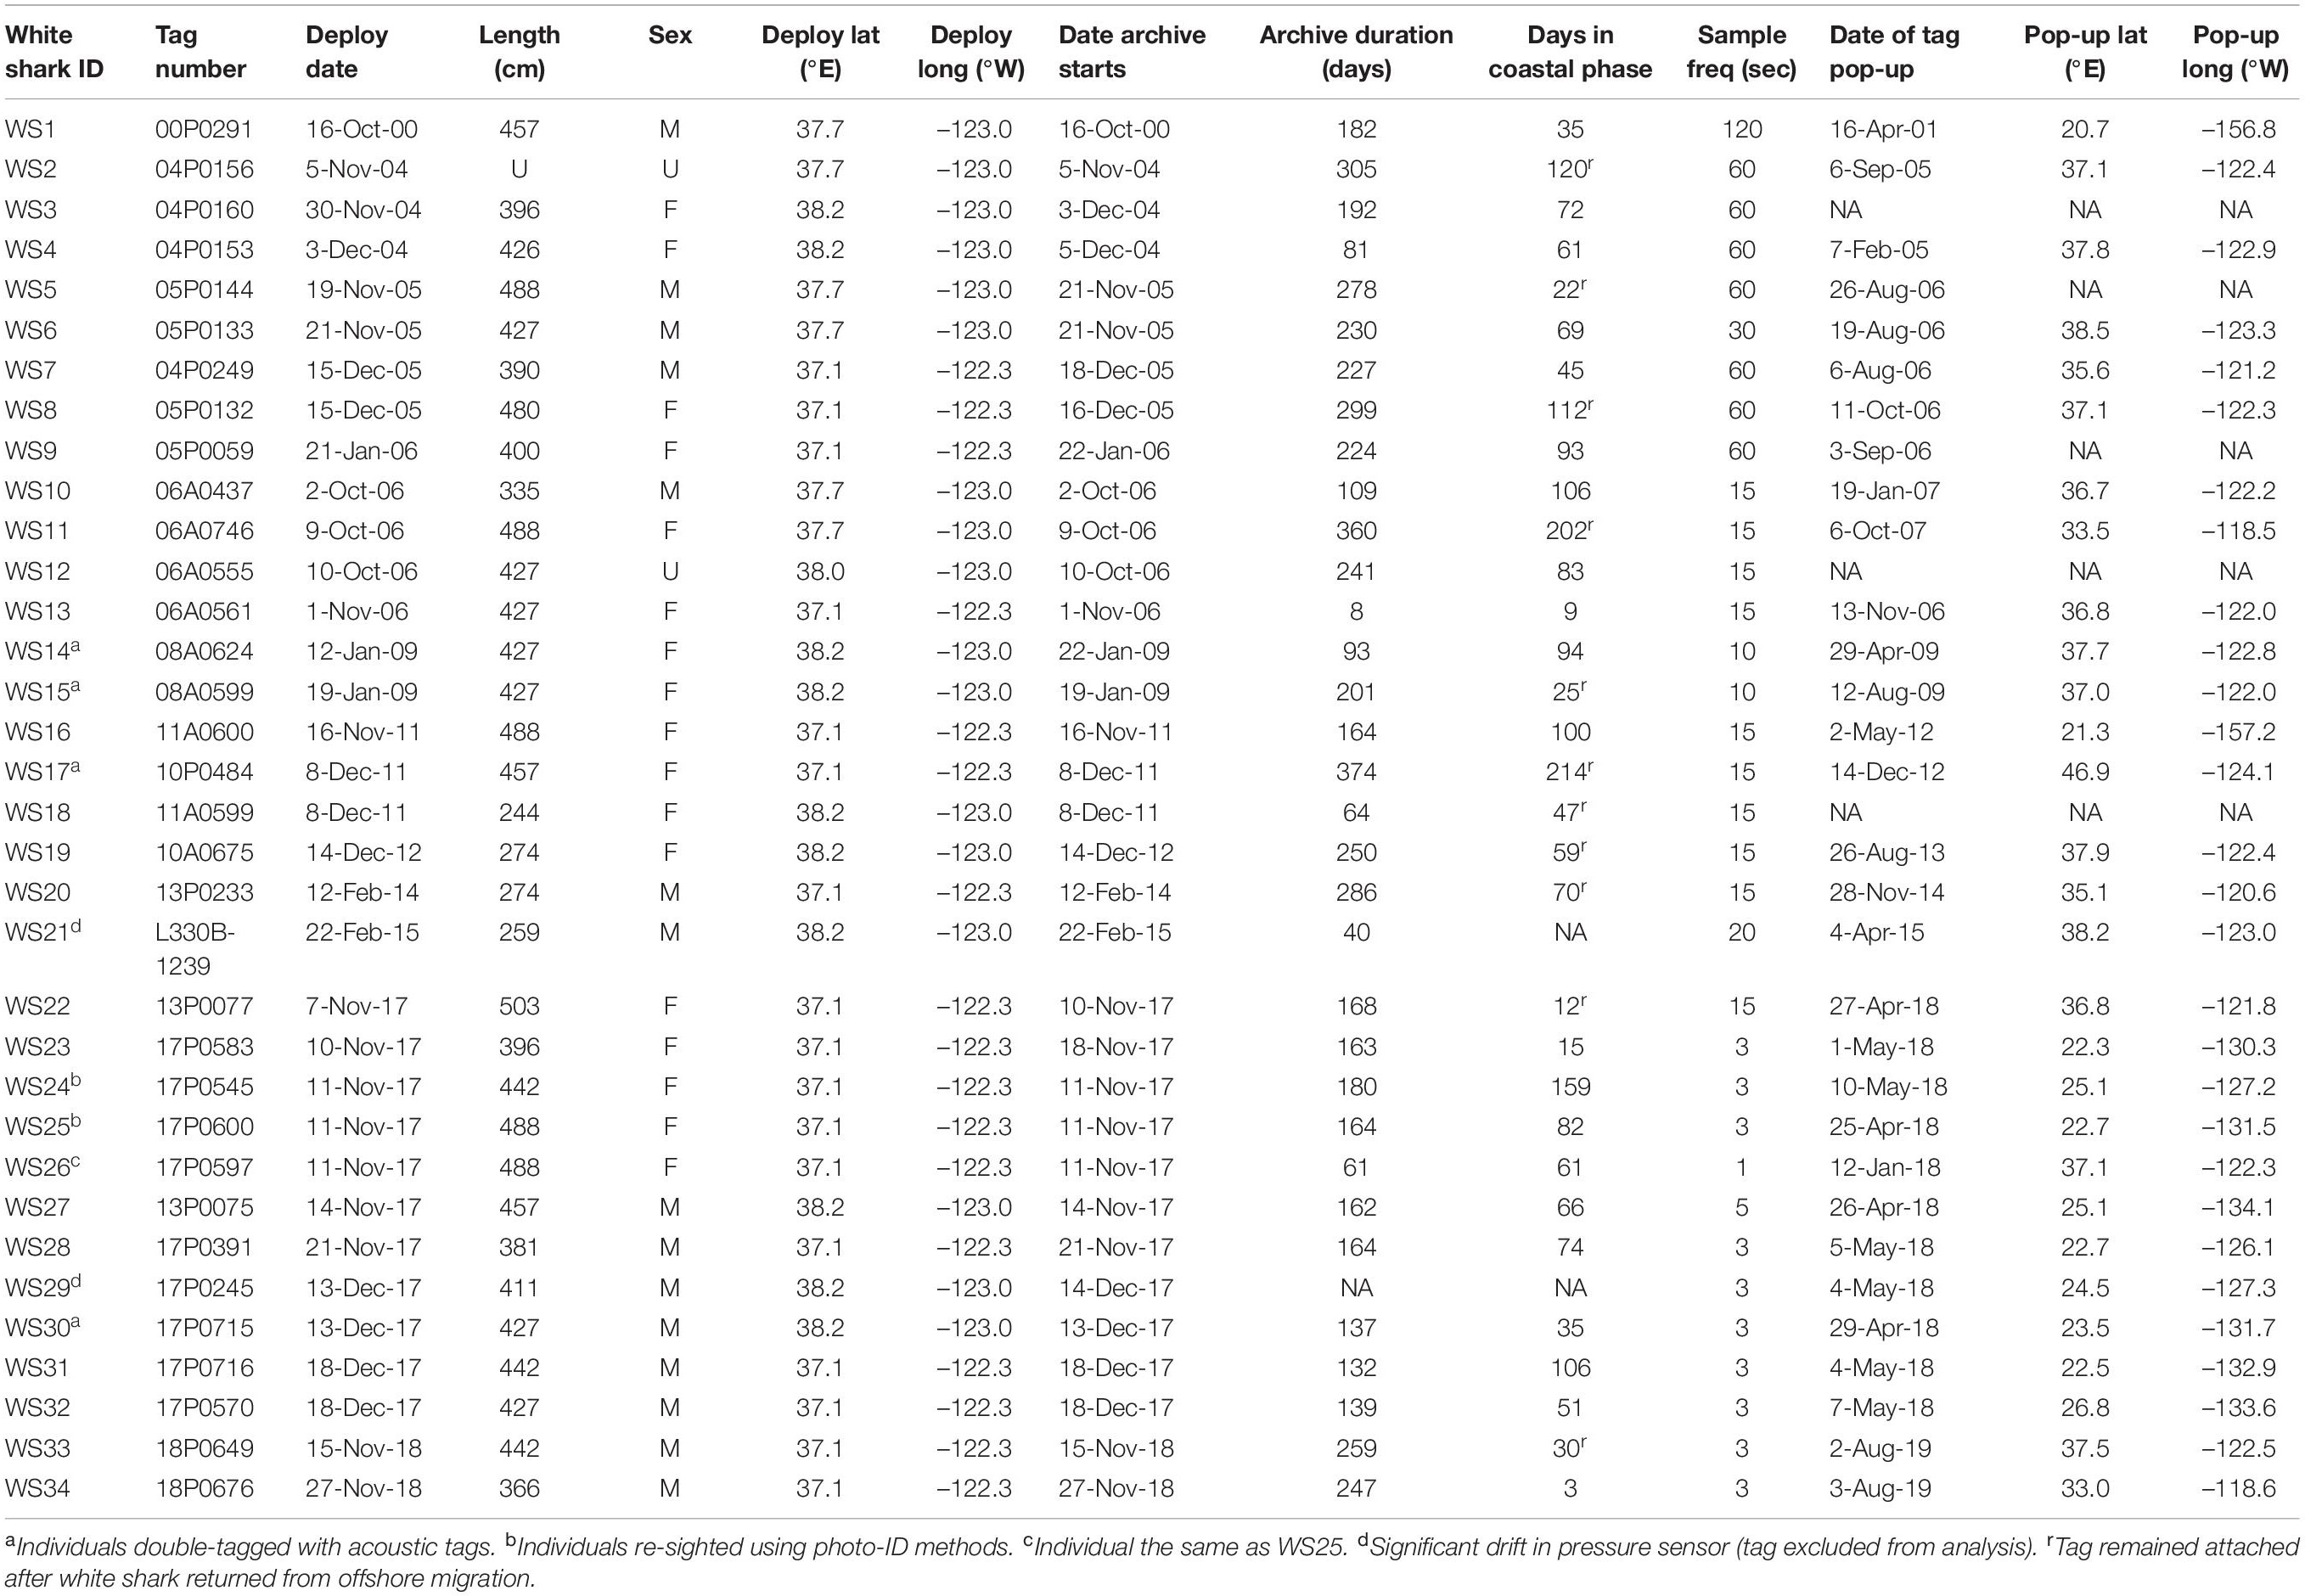
Table 1. Recovered tag deployment details for white sharks tagged in northern California from 2000 to 2018.
PSAT tags were programmed to sample ambient light levels, ambient temperature and pressure at 1–120 s intervals (Table 1) and to detach after periods ranging from 30 to 365 days. Tags would also detach if a constant depth reading (signifying mortality or shedding) was recorded for 3–4 days (depending on the year of deployment). Only tags that were physically recovered following detachment, enabling download of the full archival dataset, were included in this study. Likewise, data from acoustic tags were only used from double-tagged individuals where the PSAT tag was recovered. Detection data from acoustically tagged individuals were downloaded, at a minimum, annually from receivers placed along the California coast between 33.5 and 41.5°N, including at each of the aggregation sites where tags were deployed (Jorgensen et al., 2009; Figure 1). The number of receivers at each site was temporally variable, ranging from an average of one receiver per year at Tomales Point to > 20 per year in San Francisco Bay, where receivers are maintained by several other organizations in the case of the latter.
All methods were carried out in accordance with relevant guidelines and regulations, and all experimental protocols were approved under Stanford University animal care protocol 10,765 and under approved permits from the California Department of Fish and Wildlife, National Oceanic and Atmospheric Administration, National Park Service and Monterey Bay National Marine Sanctuary.
Data Processing
R 4.0 (R Core Team, 2020) was used for all data processing and analyses, except where stated otherwise.
Track Reconstruction
PSAT data were decoded using the manufacturer’s software (Wildlife Computers DAP Processor 3.0). Data were firstly trimmed to the attachment period, with detachment from an individual identified by the depth time-series recording a constant near-zero depth for > 12 h, shortly followed by the initiation of Argos data transmissions. Most-probable tracks were then estimated using the tag manufacturer’s software that utilizes a hidden Markov model (Pedersen et al., 2011; WC-GPE3, Wildlife Computers), and considers transmitted light level, temperature and depth data alongside sea surface temperature (SST; NOAA OI SST V2 High Resolution) and bathymetric constraints (ETOPO1-Bedrock). This method calculates a posterior probability distribution that estimates two maximum likelihood position estimates per day (Skomal et al., 2017). The diffusion parameter was set to 3 ms–1 (Block et al., 2011) to govern the allowable distance moved per day.
Processing Depth and Temperature Data
A two-step process using the most-probable tracks and the high-resolution depth data was used to trim the archival time-series to the coastal phase of the white shark migration. To isolate coastal activity, a large geographic boundary was first used to constrain the tracks periods along the California Current System of the NE Pacific coast (Supplementary Figure 1), with a large enough boundary to incorporate the errors associated with light-based geolocation (Lisovski et al., 2020). Secondly, to obtain more precise start and end dates of this coastal phase, the time-series data was then queried to find the first date at which white sharks had entered the “travel” phase of their westward migration, indicated by consecutive days with dives to depths > 100 m interspersed with a high proportion of time in surface waters (<5 m) (Jorgensen et al., 2012a). For individuals where tags remained attached following their offshore migration, the query was reversed to find the last date at which the shark was in the “travel” phase. The calculated dates were then used to obtain the final trimmed coastal time-series dataset.
Depth and temperature time-series data were summarized into hourly time windows, with computed variables including median, mean, minimum, maximum and standard deviation. The proportion of time spent in distinct depth ranges each hour was also calculated. For sharks with a sampling frequency of 5 s or faster (n = 11; Table 1), vertical velocity (VV) was calculated by taking the difference in depth between successive points, and dividing by the sampling frequency to obtain VV at a 1 s frequency. VV was then used to split the depth record into vertical swimming phases (i.e., < 0 = descending, 0 = level swimming, > 0 = ascending). The proportion of time spent moving vertically (ascending and descending), termed the “diving ratio,” was also calculated by determining the percentage of time vertically moving within an hour (Andrzejaczek et al., 2018b).
Double-Tagged Sharks
To investigate site-specific vertical behavior, acoustic and PSAT datasets were paired where deployment periods overlapped (n = 4; Table 1). > 1 acoustic detection per 12-h period at a site was used to link a tagged individual with a site, and a continuous span of time spent at a site was defined where this occurred over consecutive 12-h periods. The photo-ID database was also queried to find dates where photo-IDs of tagged sharks overlapped with deployment periods, providing an additional means to link individuals to aggregation sites.
Environmental Parameters
The R package suncalc was used to obtain daily lunar illumination data, and to determine times of sunrise and sunset (Thieurmel and Elmarhraoui, 2019) and subsequently split the data into diel phases. Daily average sea surface temperature (SST) was estimated by averaging the temperature in the uppermost 5 m of the water column for each day (Andrzejaczek et al., 2018a). For days that white sharks did not enter this depth range, the estimate from the previous day was used (n = 47 days). Monthly SST anomaly, an indicator of El Niño, was extracted from https://www.cpc.ncep.noaa.gov/products/analysis_monitoring/ensostuff/detrend.nino34.ascii.txt. Anomalies referenced from a 30-year base period were calculated for the Niño 3.4 region (5°N—5°S, 120°–170°W). Values on this scale range from negative (cooling; La Niña) to positive (warming; El Niño).
Statistical Analyses
Generalized Additive Mixed Models
A suite of Generalized Additive Mixed Models (GAMMs) with Gaussian error distributions were constructed using the mgcv package in R (Wood, 2017) to test the response of biologically relevant vertical movement metrics to temporal and environmental variables. Calculated response metrics were (1) % time in the top 5 m, (2) % time in the 15–30 m depth bin and (3) diving ratio, and were summarized for each hour of data. Response metric (1) was calculated as a metric of surface use, (2) as a rough bin to cover the mean maximum depth of aggregation sites assumed to represent swimming along the seafloor, and (3) as a proxy for vertical or oscillatory activity. Median depth was originally also modeled, however, due to lack of model fit both before and after transformation, was not included in the final analysis. Response metrics (1) and (2) were modeled separately for sex to ease model interpretation, while response metric (3) could not be split due to reduced sample size of individuals with higher resolution tags (n = 3 females and 7 males) and instead included “sex” as a categorical explanatory variable. Response metrics (1) and (2) were both logit transformed prior to analysis so that predicted values were not negative, and did not exceed one, as well as to normalize data. The continuous variables considered for all models were time of day (hour of day), fraction of the moon illuminated (0–1), daily average SST and monthly SST anomaly. Month and age class (adult and sub-adult) were also included as categorical factors. All models included shark ID as a random effect to account for individual variation in movement patterns. Temporal auto-correlation was tested on the initial fit of each model, revealing a steady decline of serial correlation with increasing lag from time t. The correlation at lag = 1 was subsequently used to specify the correlation structure of the data (Zuur et al., 2009) and added as a final term to each model using the corAR1 function in R.
A full subsets approach was used to model every combination of variables possible. Models within 2 AICc units of each other were considered to be equally ranked. When the difference in AICc values (ΔAICc) between top candidate models was < 2, the model containing the lowest number of explanatory variables (i.e., the most parsimonious) was selected as the appropriate model for the data.
Multivariate Analyses
Principal components analysis (PCA) was applied separately to the summarized hourly depth data of two double-tagged sharks who displayed relatively high visitation to sites with acoustic receivers (WS15 and WS17; > 12 days at sites). Scaled values of median depth, maximum depth, interquartile range in depth and proportion of time in the top 5 m were used in the PCA analyses to investigate how vertical movements varied among sites for each of these sharks.
Results
Data Overview
We recovered 34 datasets from PSAT tags deployed on white sharks at aggregation sites on the central coast of California from 2000 to 2019. Tags were retrieved from locations on the US west coast (from Washington to the Channel Islands; n = 21), in Hawaii (n = 4) and in waters offshore (n = 9) (Table 1). Tags were either recovered by the research team or were returned after being found by members of the public. A total of 31 individual datasets were used in data processing and analyses, with two not used due to sensor issues, and only one dataset used from a single individual with two satellite tags with overlapping deployment periods (WS25 and WS26; Table 1). Of the 31 datasets, 16 were from sharks visually identified as females, 13 from males, and two from sharks of unknown sex (Table 1). Sharks ranged in estimated lengths from 2.5 to 5 m (median ∼4.3 m; Table 1). The mean total deployment duration of tags was 193 ± 96 days (range 12–391 days), with time in the coastal phase during tag deployment averaging 73 ± 51 days (range 3–214 days; Table 1). A majority of the coastal phase occurred over the months of November, December and January (67.4 ± 29.5%; Supplementary Table 1).
While in their coastal phase, tagged white sharks occupied a mean depth of 14.3 ± 4.0 m and a median depth ± interquartile range of 11.0 ± 4.5 m, with relatively high variation between individual sharks (Figures 2, 3). Given the non-Gaussian distribution of the data, median depth was used to summarize diel depth use, with sharks occupying a significantly deeper median depth during the day than the night (day: 12.4 ± 5.8 m; night: 10.0 ± 4.7 m; Wilcoxon paired rank sum test: V = 6,50,978, p < 0.001, 95% confidence interval: –2.5, –2.0; Figure 2). Males also occupied slightly, but significantly, deeper depths than females (male: 11.7 ± 7.7 m; female: 10.6 ± 8.1 m; Wilcoxon rank sum test: W = 3,95,418, p < 0.001, 95% confidence interval: –2.6, –1.5; Figure 3), and adults occupied slightly, but significantly, deeper depths than subadults (adult: 11.7 ± 9.4 m; subadult: 9.9 ± 5.9 m; Wilcoxon rank sum test: W = 5,85,535, p < 0.001, 95% confidence interval: 0.70, 1.7; Figure 3). Depth use was skewed to the top 25 m of the water column, with 87.4 ± 7.6% of the time spent in this zone and a majority of this spent in the 10–25 m depth bin for both diel periods (Figure 2). White sharks recorded a mean temperature of 12.9 ± 1.2°C, and an average SST of 13.2 ± 1.4°C. Higher resolution data from 10 white sharks revealed individuals were moving vertically for 70.7 ± 3.7% of the time at a mean vertical velocity of 0.1 ± 0.01 ms–1 and maximum rates of 4.1 and 6.0 ms–1 for descent and ascent, respectively.
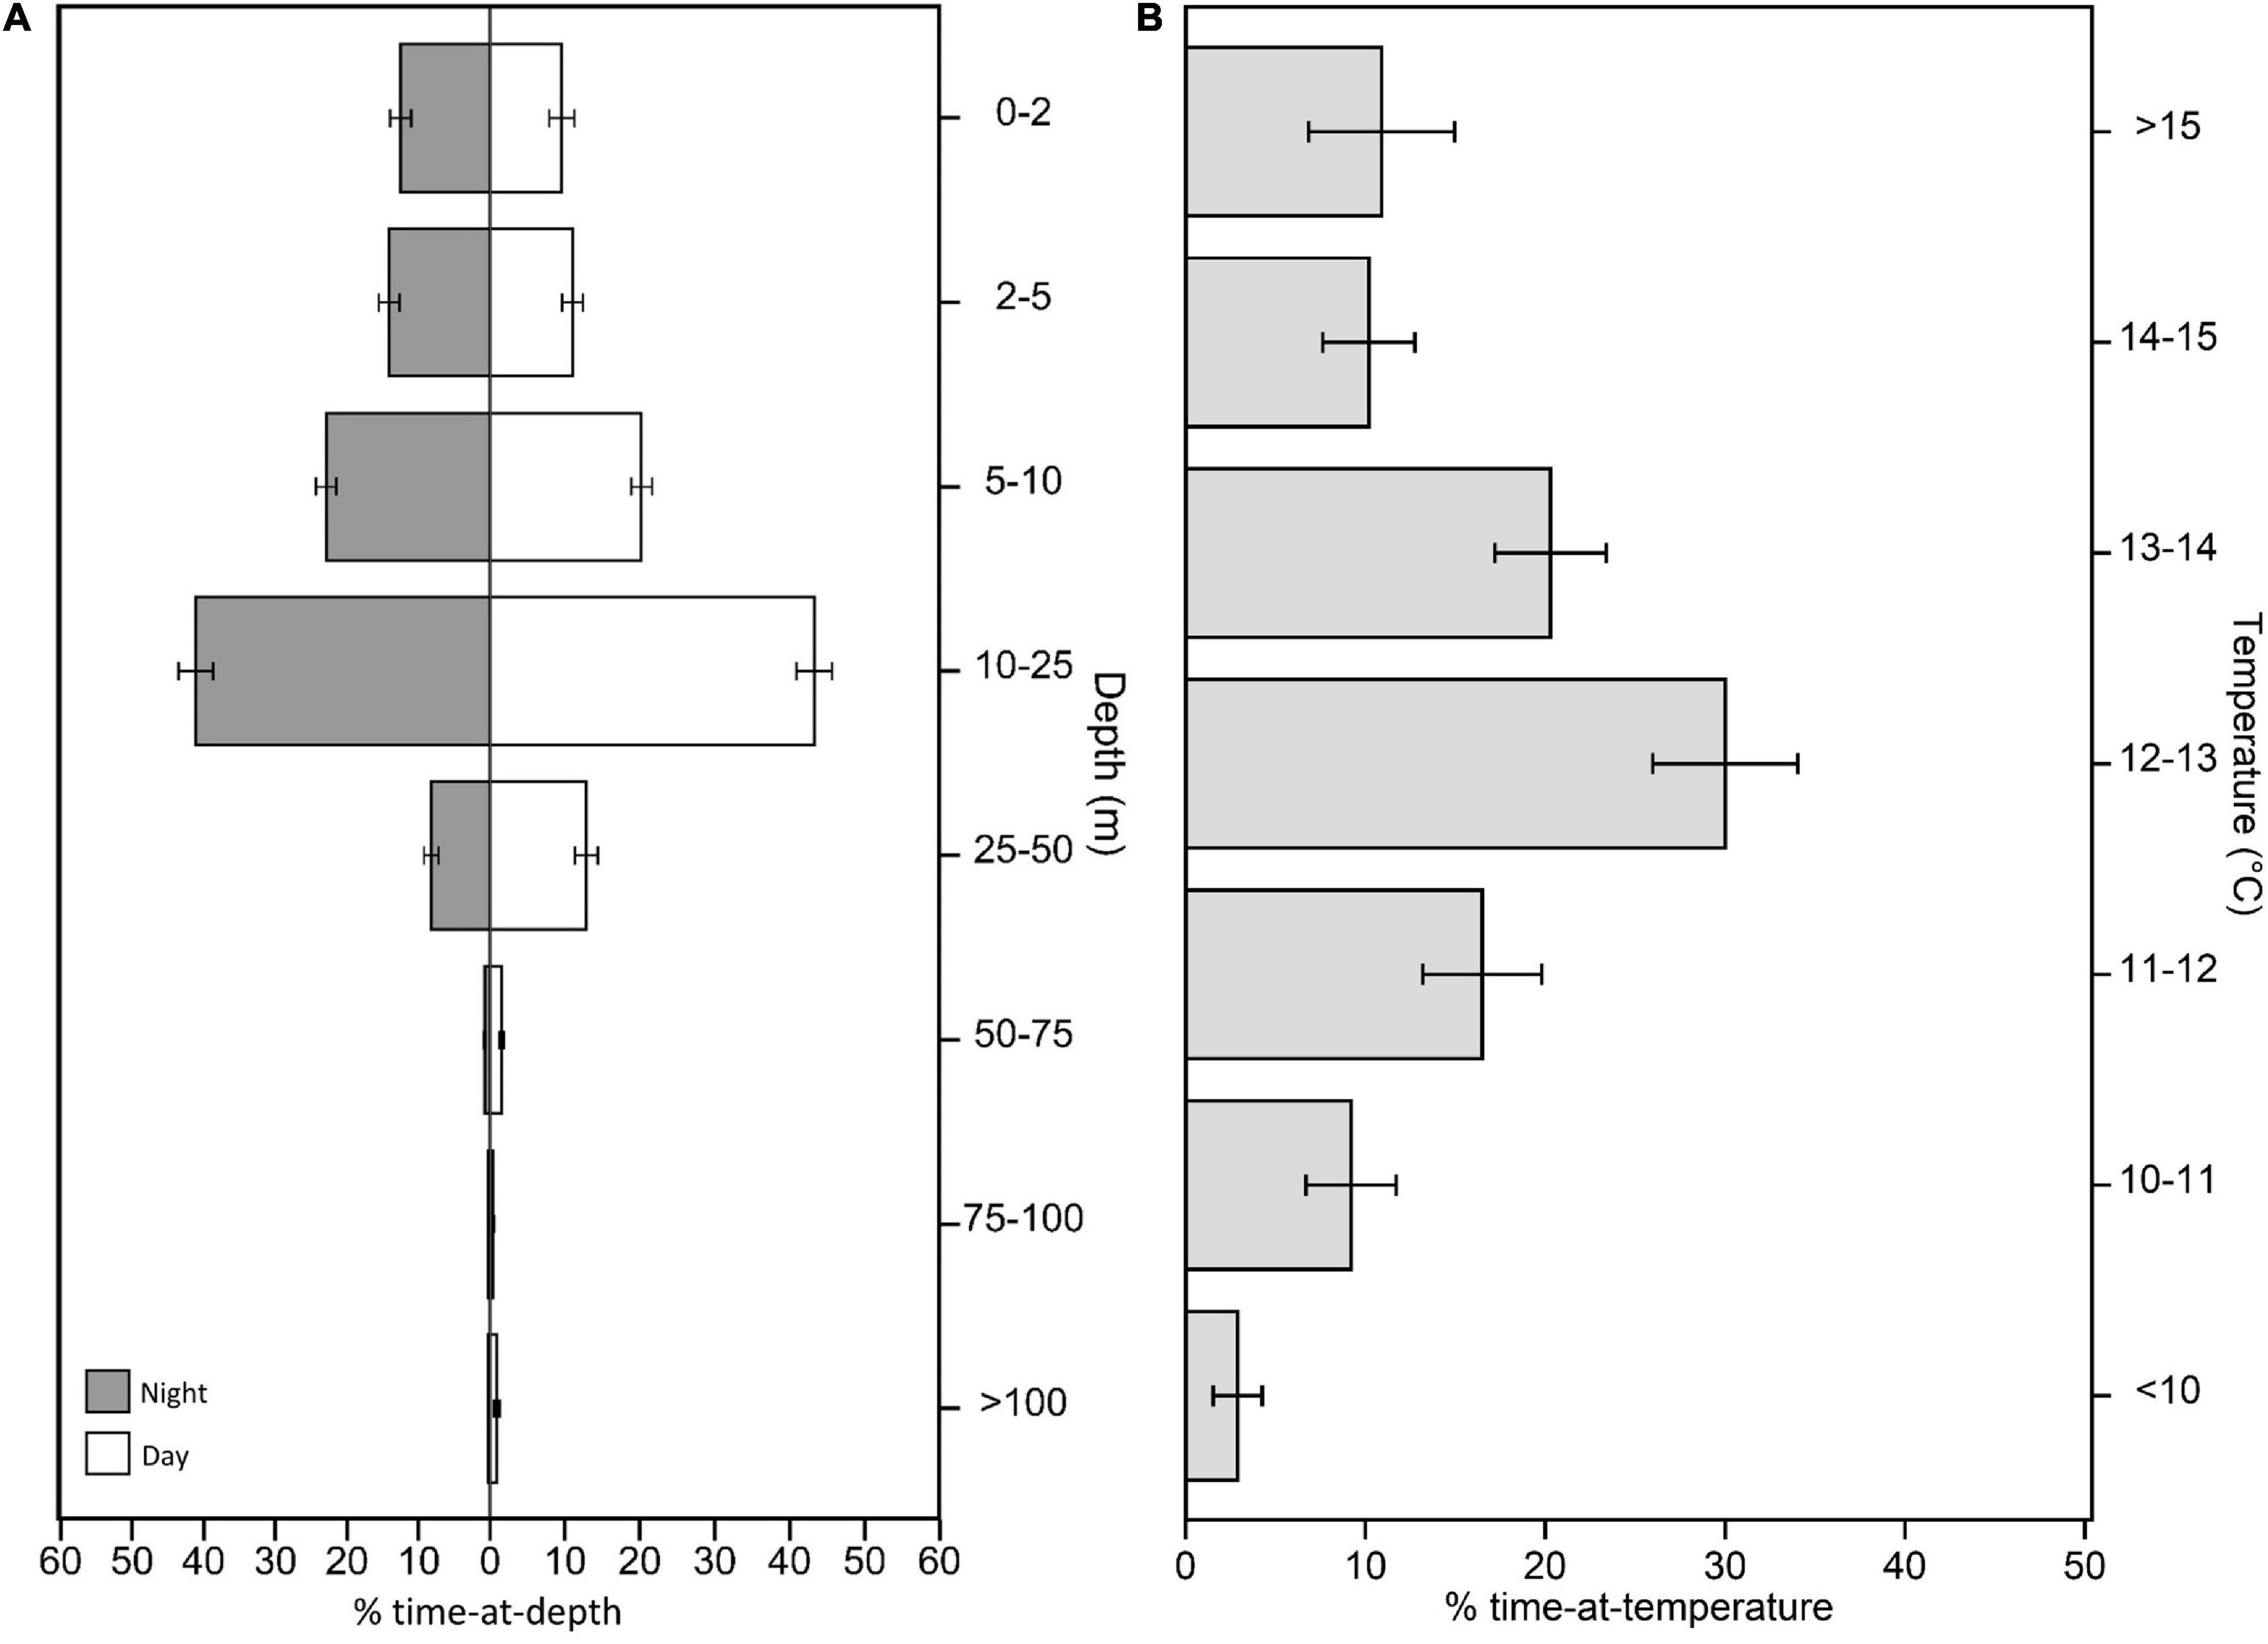
Figure 2. Summarized time-series data from PSATs recovered from 32 individual white sharks Carcharodon carcharias. Summaries are from data restricted to the coastal phase of the white shark migration. (A) Percent time-at-depth for night and day-time periods. (B) Percent time-at-temperature. Note that for (A), bin size is not equal between categories.
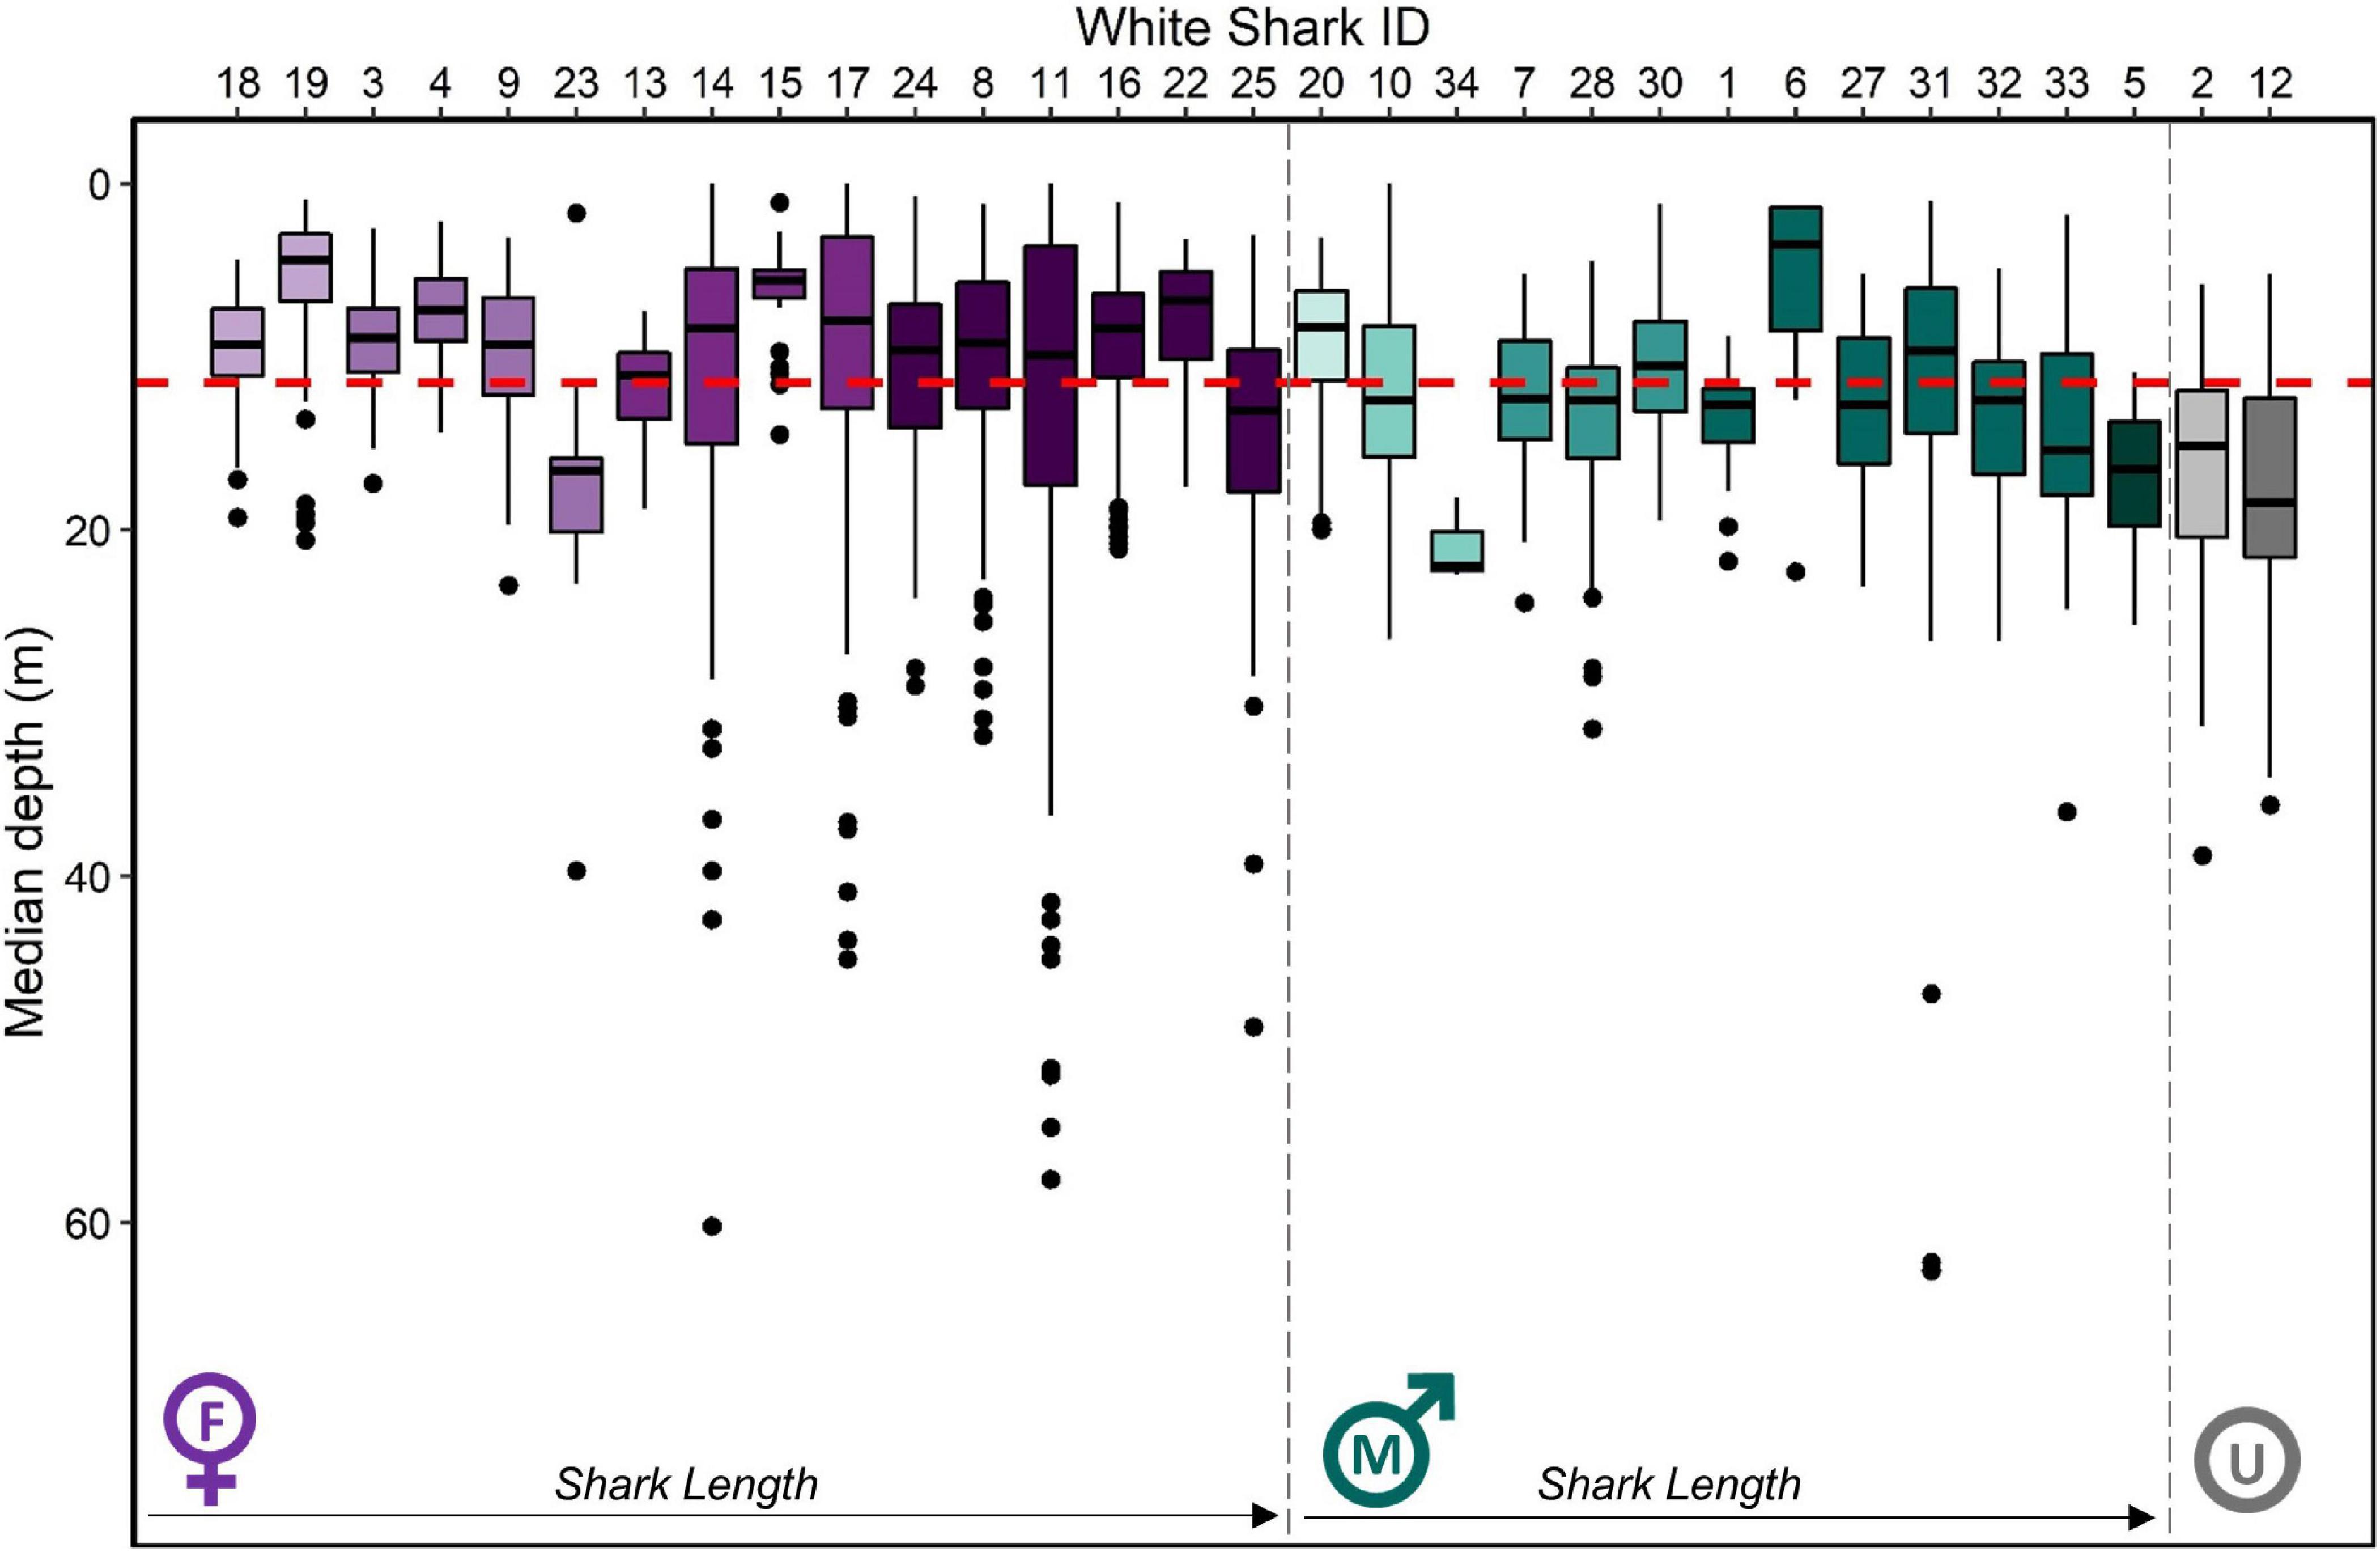
Figure 3. Median depth (m) by individual white shark Carcharodon carcharias in the coastal phase of their migration in the NE Pacific. Boxplots are ordered firstly by sex (female = purple, male = green, unknown = gray) then by size (small to large from left to right), with darker shades indicating larger individuals. The red dashed line indicates the average median depth of all individuals (11.7 ± 8.4 m), while the average median depth for female and male individuals is 10.6 ± 9.1 m and 11.7 ± 6.4 m, respectively.
Temporal Patterns
GAMMs revealed temporal patterns in all modeled vertical movement metrics (Table 2 and Figure 4). Deviance explained for the selected models ranged from 11 to 22.1%, with the individual ID (the random effect) explaining more than half of this when modeled alone (Table 2 and Figure 4). For a list of all model subsets considered in the selection process see Supplementary Material.
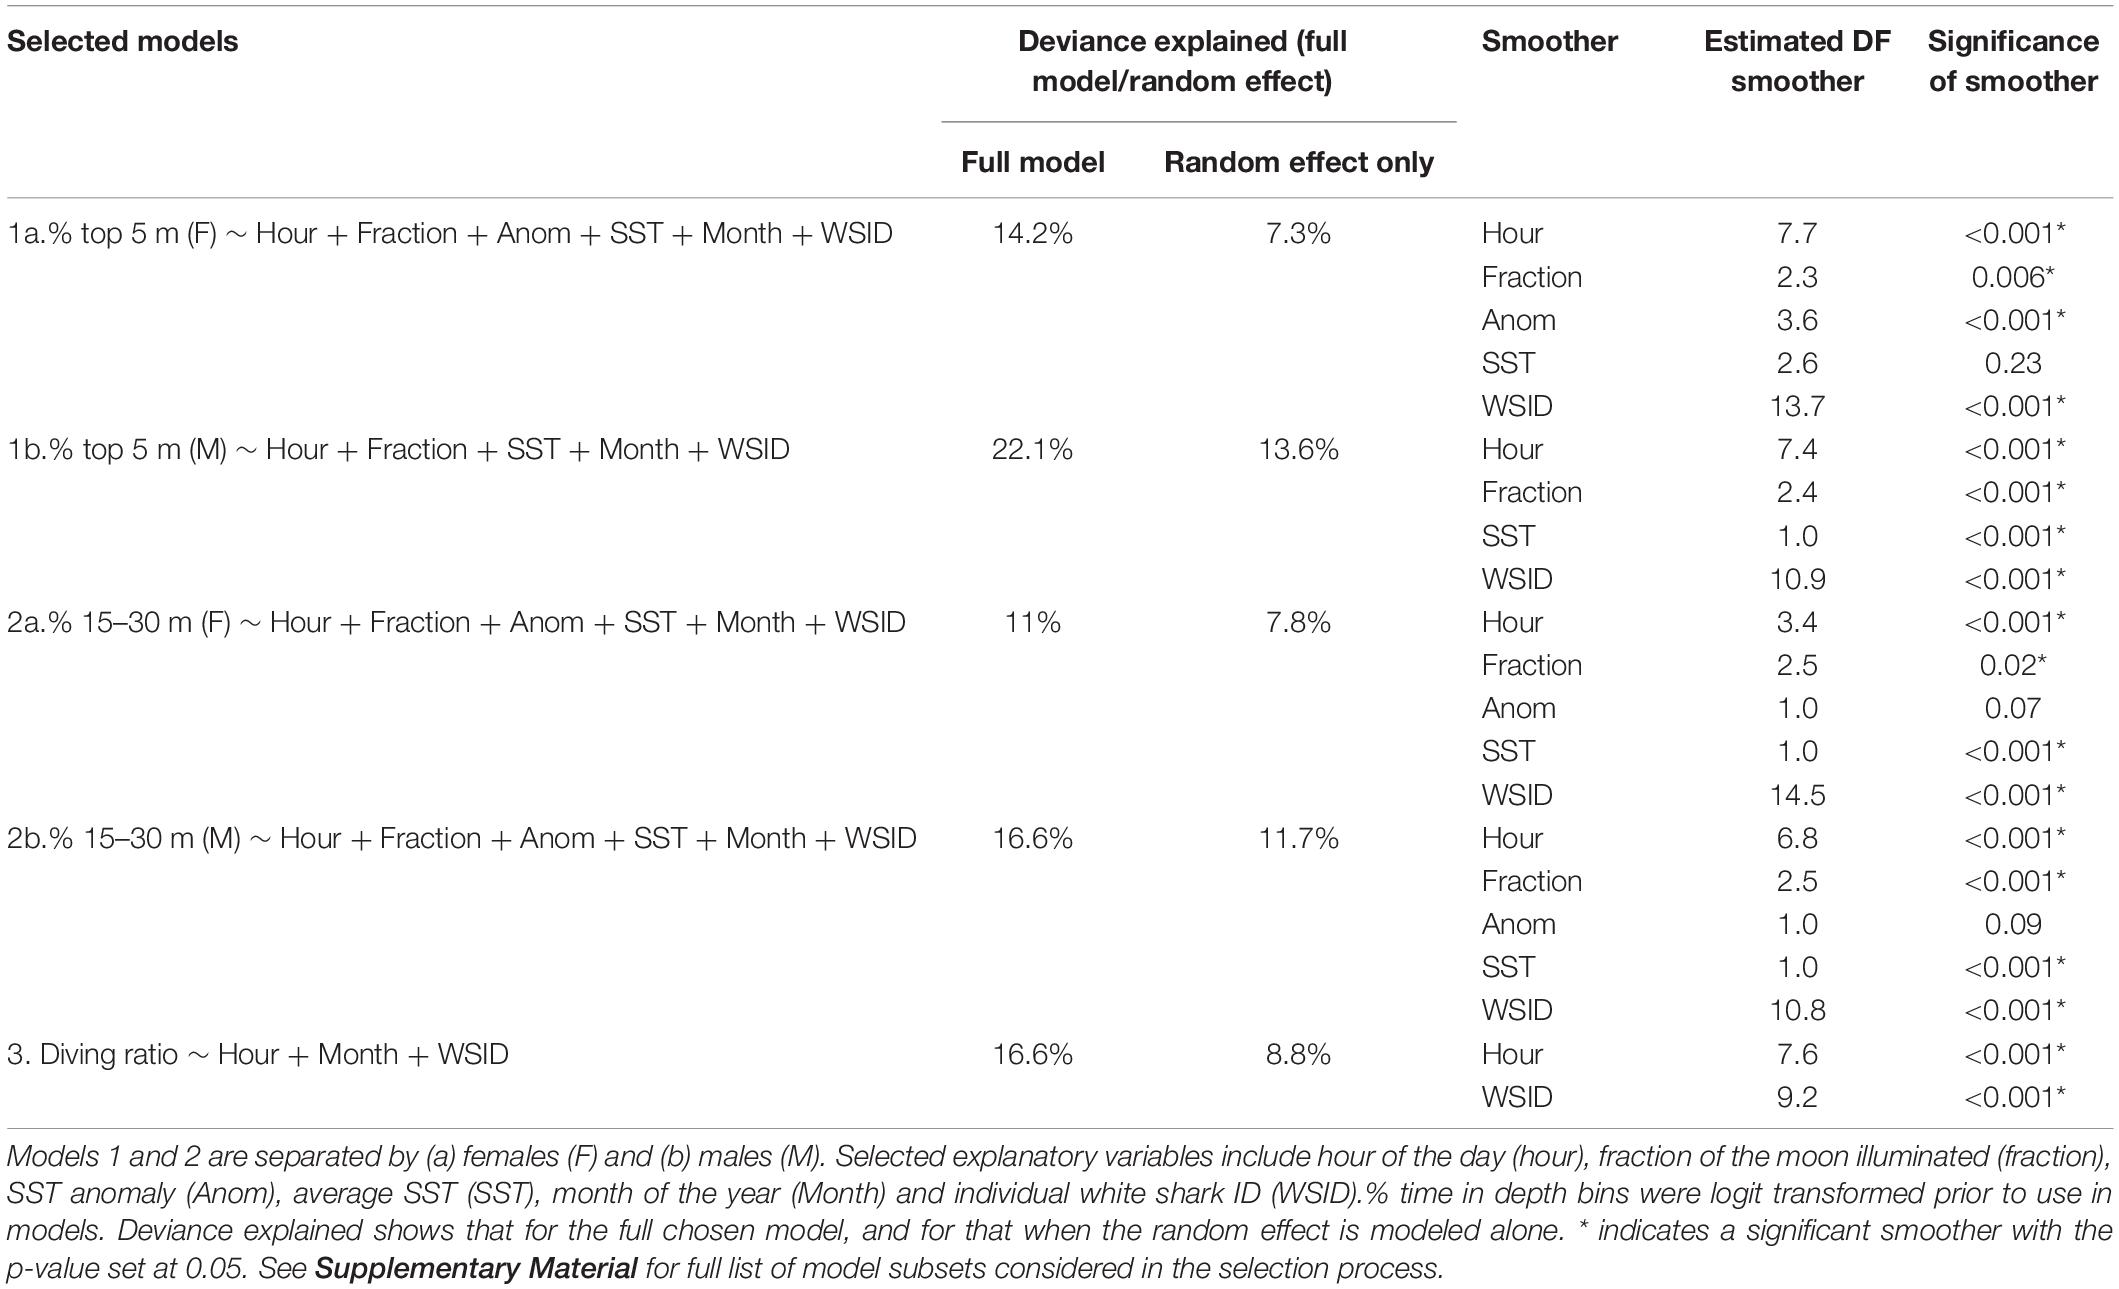
Table 2. Summary of the GAMMs selected by the model selection process (for full set of models included in the model selection process, see Supplementary File A).
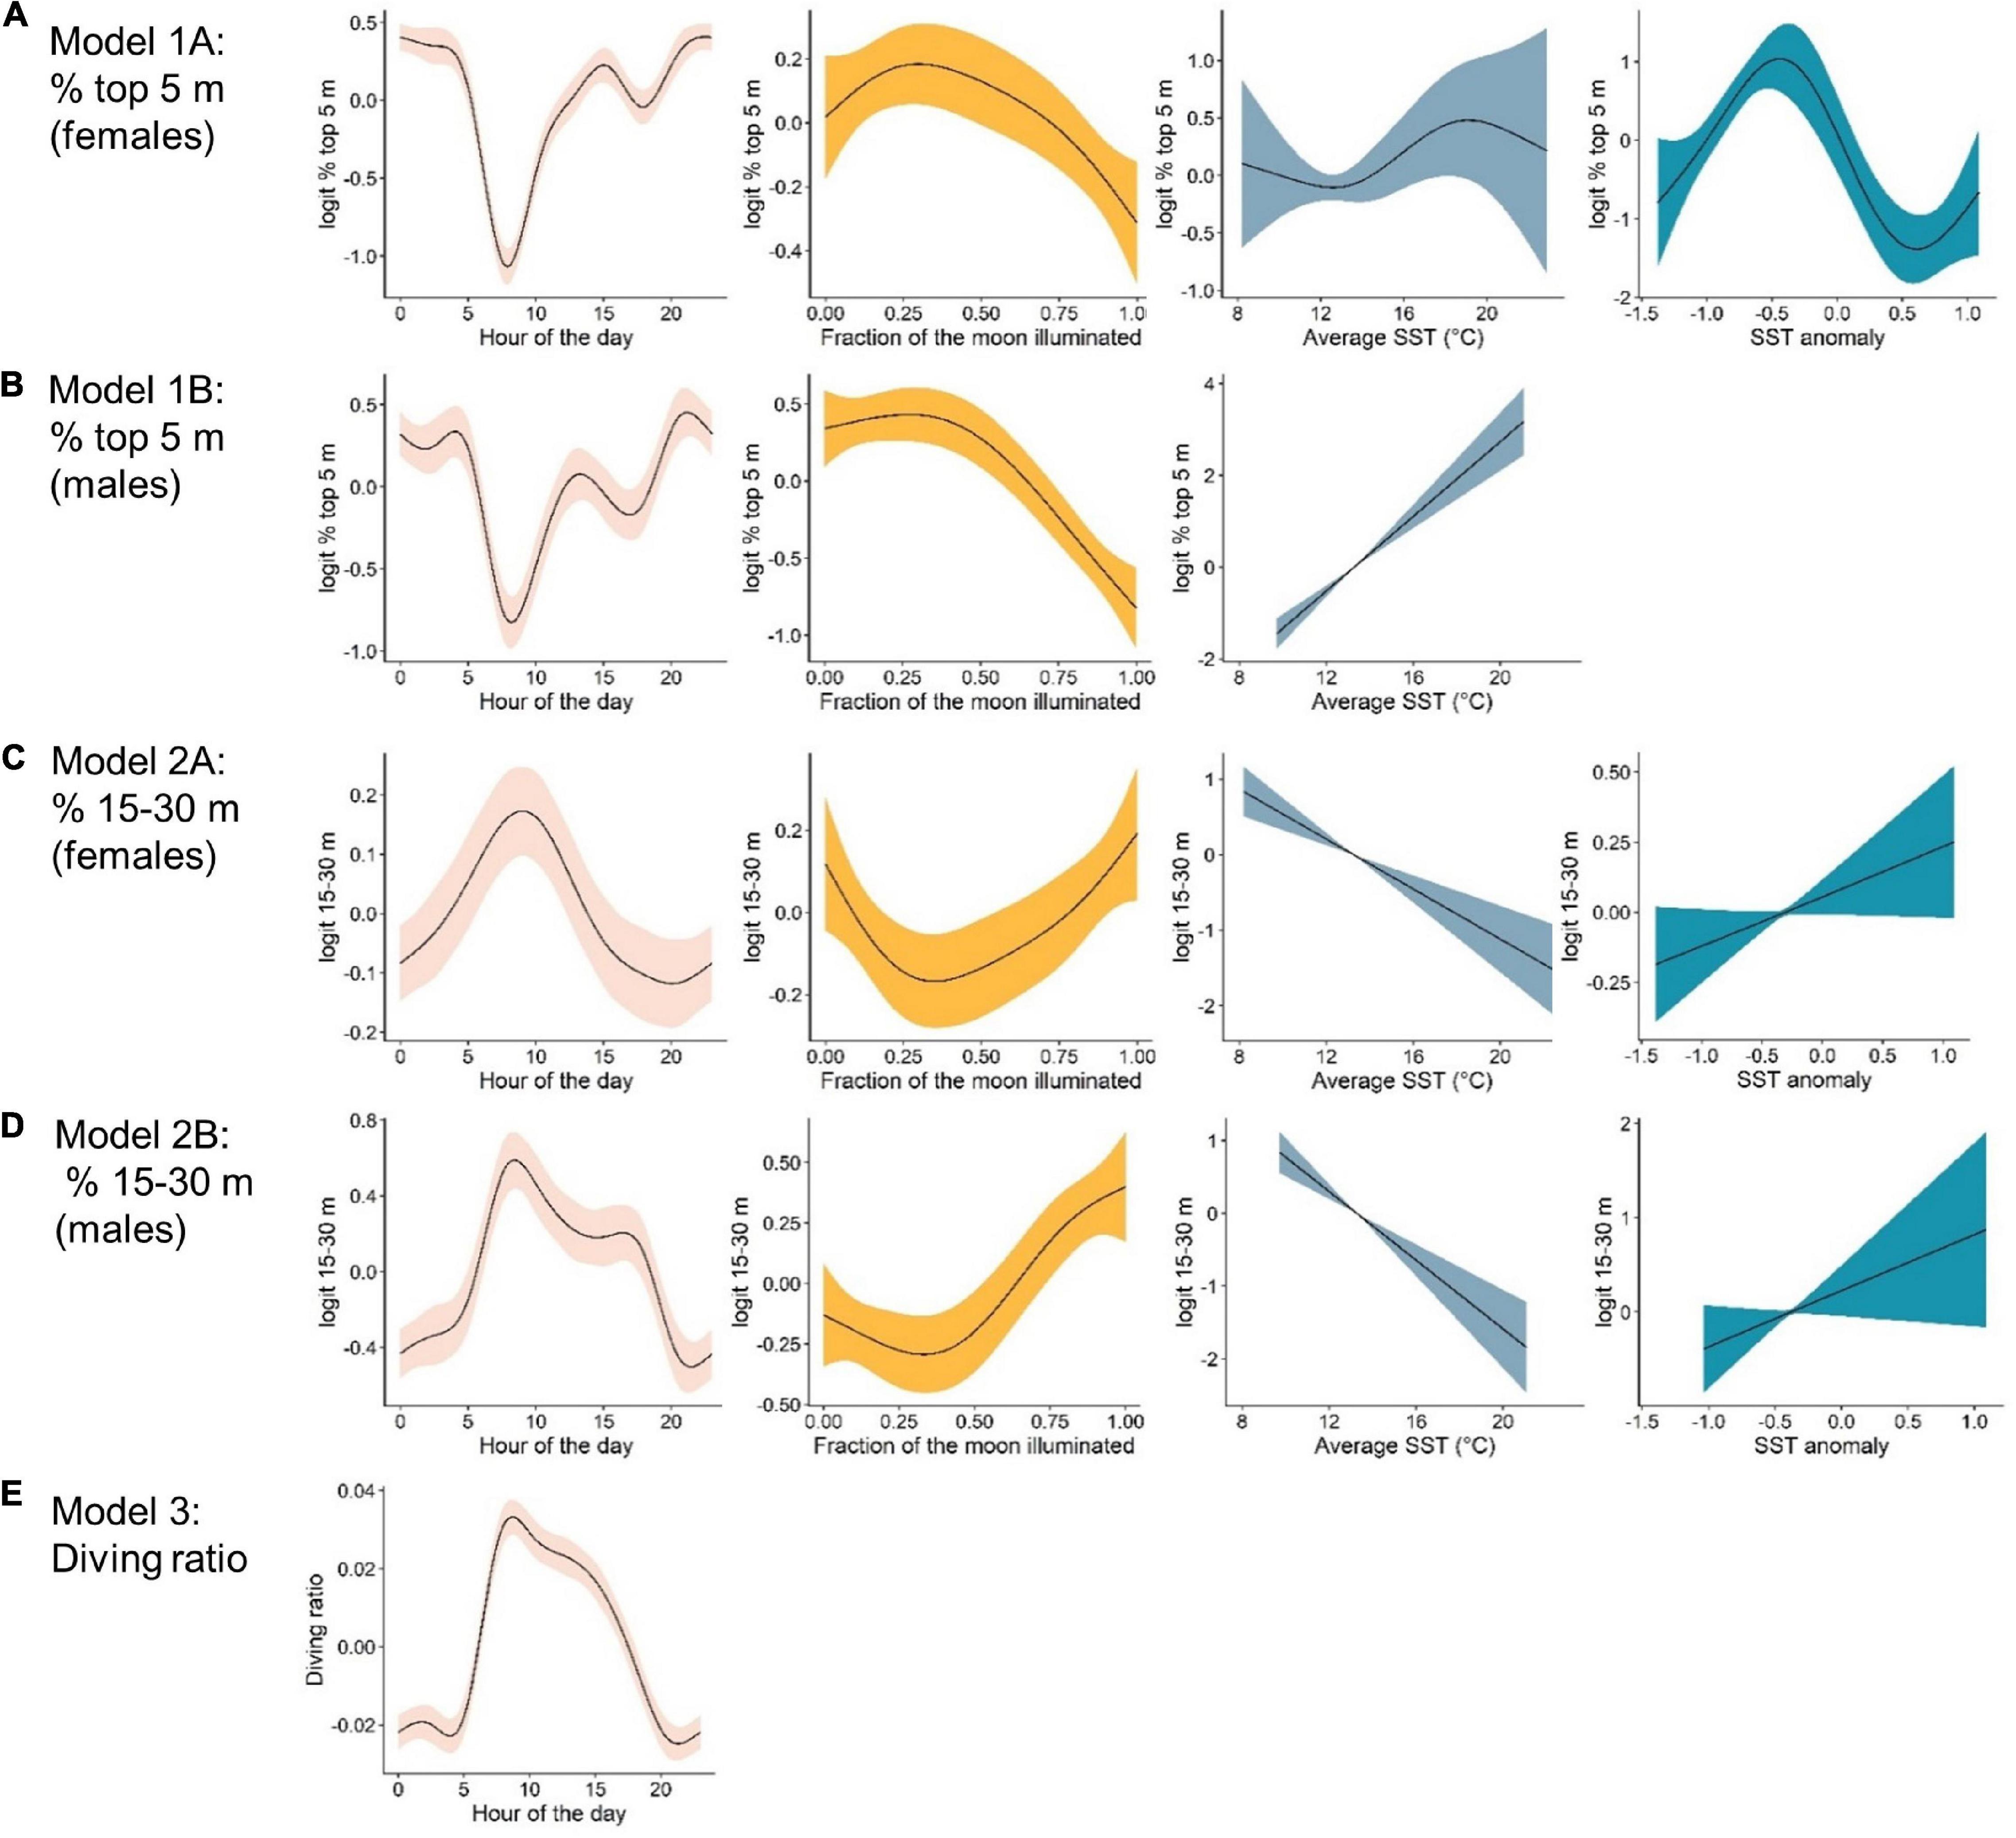
Figure 4. Marginal effects plots from top-ranked generalized additive mixed models indicating the effects, from left to right, of: hour of the day, lunar illumination, average sea surface temperature °C (SST) and SST anomaly, on vertical movement metrics. The response variable for each model are as follows: (A) % time in the top 5 m by females. (B) % time in the top 5 m by males. (C) % time in the 15–30 m depth bin by females. (D) % time in the 15–30 m depth bin by males, and (E) the diving ratio. Note that scales on the y-axes differ between plots.
% Top 5 m
The probability of being in surface waters (the top 5 m) was highest during the night as well as the new moon period (i.e., lowest lunar illumination) for both females and males (Figures 4A,B). The models revealed a decreasing probability of use of the top 5 m toward early morning and with increasing lunar illumination. Females displayed a variable relationship with SST anomaly, with highest probability of surface use during negative anomalies (i.e., La Niña) and lowest during positive anomalies (i.e., El Niño, Figure 4A). Surface use was also predicted to be highest for females in August, September and October, and lowest in December and January (Supplementary Figure 2). Although selected in the final model, the smoother for average SST was not significant for females. For males, surface use was predicted to increase with increasing SST (Figure 4B), and was highest in March and April and lowest in September and October (Supplementary Figure 2). We note that only one tagged male (WS31) was present on the coast in March and April.
% 15–30 m
The probability of being in waters 15–30 m deep was highest during the early morning and a full moon for both females and males (Figures 4C,D). Probability decreased into nighttime hours and decreasing lunar illumination. Use of the 15–30 m bin also decreased with increasing SST (Figures 4C,D). Although selected in the final models, the smoother for SST anomaly was not significant for females or males (Table 2). For females, use of the 15–30 m depth bin was lowest in April and highest in June, August, September and December (Supplementary Figure 2). For males, lowest use occurred in March and April, and highest in September, October and December (Supplementary Figure 2).
Diving Ratio
Hour of the day was the only continuous variable selected in the final model for diving ratio (i.e., vertical activity; Figure 4E). Diving ratio was predicted to be highest in the early morning, remaining high throughout the day and dropping before sunset until sunrise. Diving ratio was predicted to be highest in January, July and December and lowest in March, April and August (Supplementary Figure 2), though we note only one individual was present on the coast in July.
Site-Specific Vertical Movement Patterns
Double-Tag Data
Four sharks were also acoustically tagged with deployment periods overlapping with recovered PSATs (WS14, WS15, WS17, and WS30; Table 3). Fine-scale presence (i.e., minimum two detections within consecutive 12 h periods) were recorded at Tomales, Point Reyes and Año Nuevo, with a maximum consecutive period of 16 days at one site recorded (WS30 at Año Nuevo). WS17, a 4.6 m adult female, was double-tagged at Año Nuevo in December 2011, moved offshore in March, returned via the Channel Islands where it was detected in September, moving back up northward along the coast via Cambria in October before being detected once again at Año Nuevo in October and November 2012. WS15 entered San Francisco Bay for a period of 9 h where it was detected 287 times across 16 different receivers. Detections in San Francisco Bay by WS15 were accompanied by an increase in ambient temperature from 11.4 ± 1.0 to 14.3 ± 0.3°C and an increase in median depth use from 7.4 ± 6.1 to 14.2 ± 10.5 m (Supplementary Figure 3). Notably, this shark was acoustically detected in San Francisco Bay in four consecutive years (2007–2010), with the first day of detection in a given year occurring in July or August.
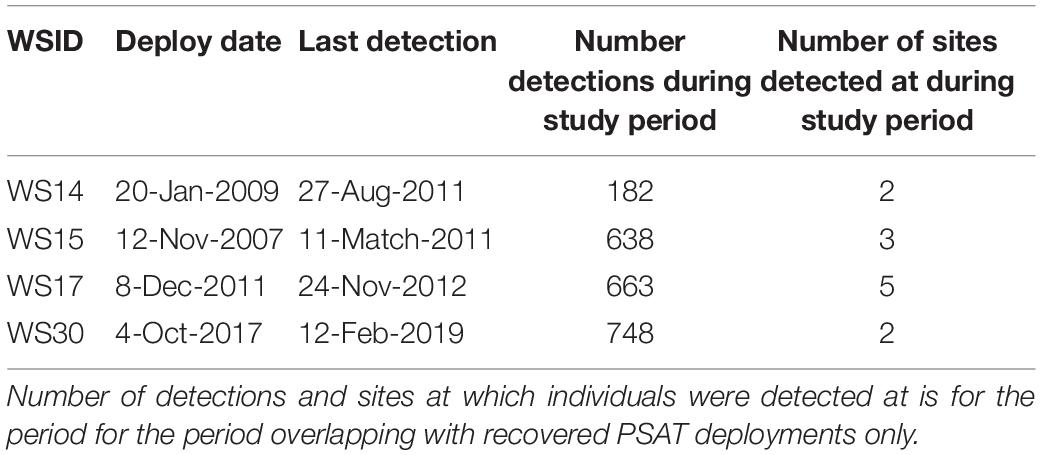
Table 3. Acoustic tag data summary for double-tagged sharks.
White sharks continued to exhibit oscillatory swimming behavior at all sites at which they were detected (Supplementary Figure 3), however, depth distributions varied with site. Relatively shallow distributions were recorded at Tomales (median depth ± IQR = 5.0 ± 3.0 m; Figure 5A), deeper distributions in San Francisco Bay (14.7 ± 5.7 m; Figure 5A) and Cambria (16.1 ± 8.4 m; Figure 5A), shallow but variable distributions at the Channel Islands (9.0 ± 17.9 m; Figure 5A, and Supplementary Figure 4), and deeper and highly variable at Point Reyes (12.6 ± 37.1 m) (Figure 5A). Median depth use at Año Nuevo was close to that of that of the entire dataset (11.0 ± 8.7 m; Figure 5A).
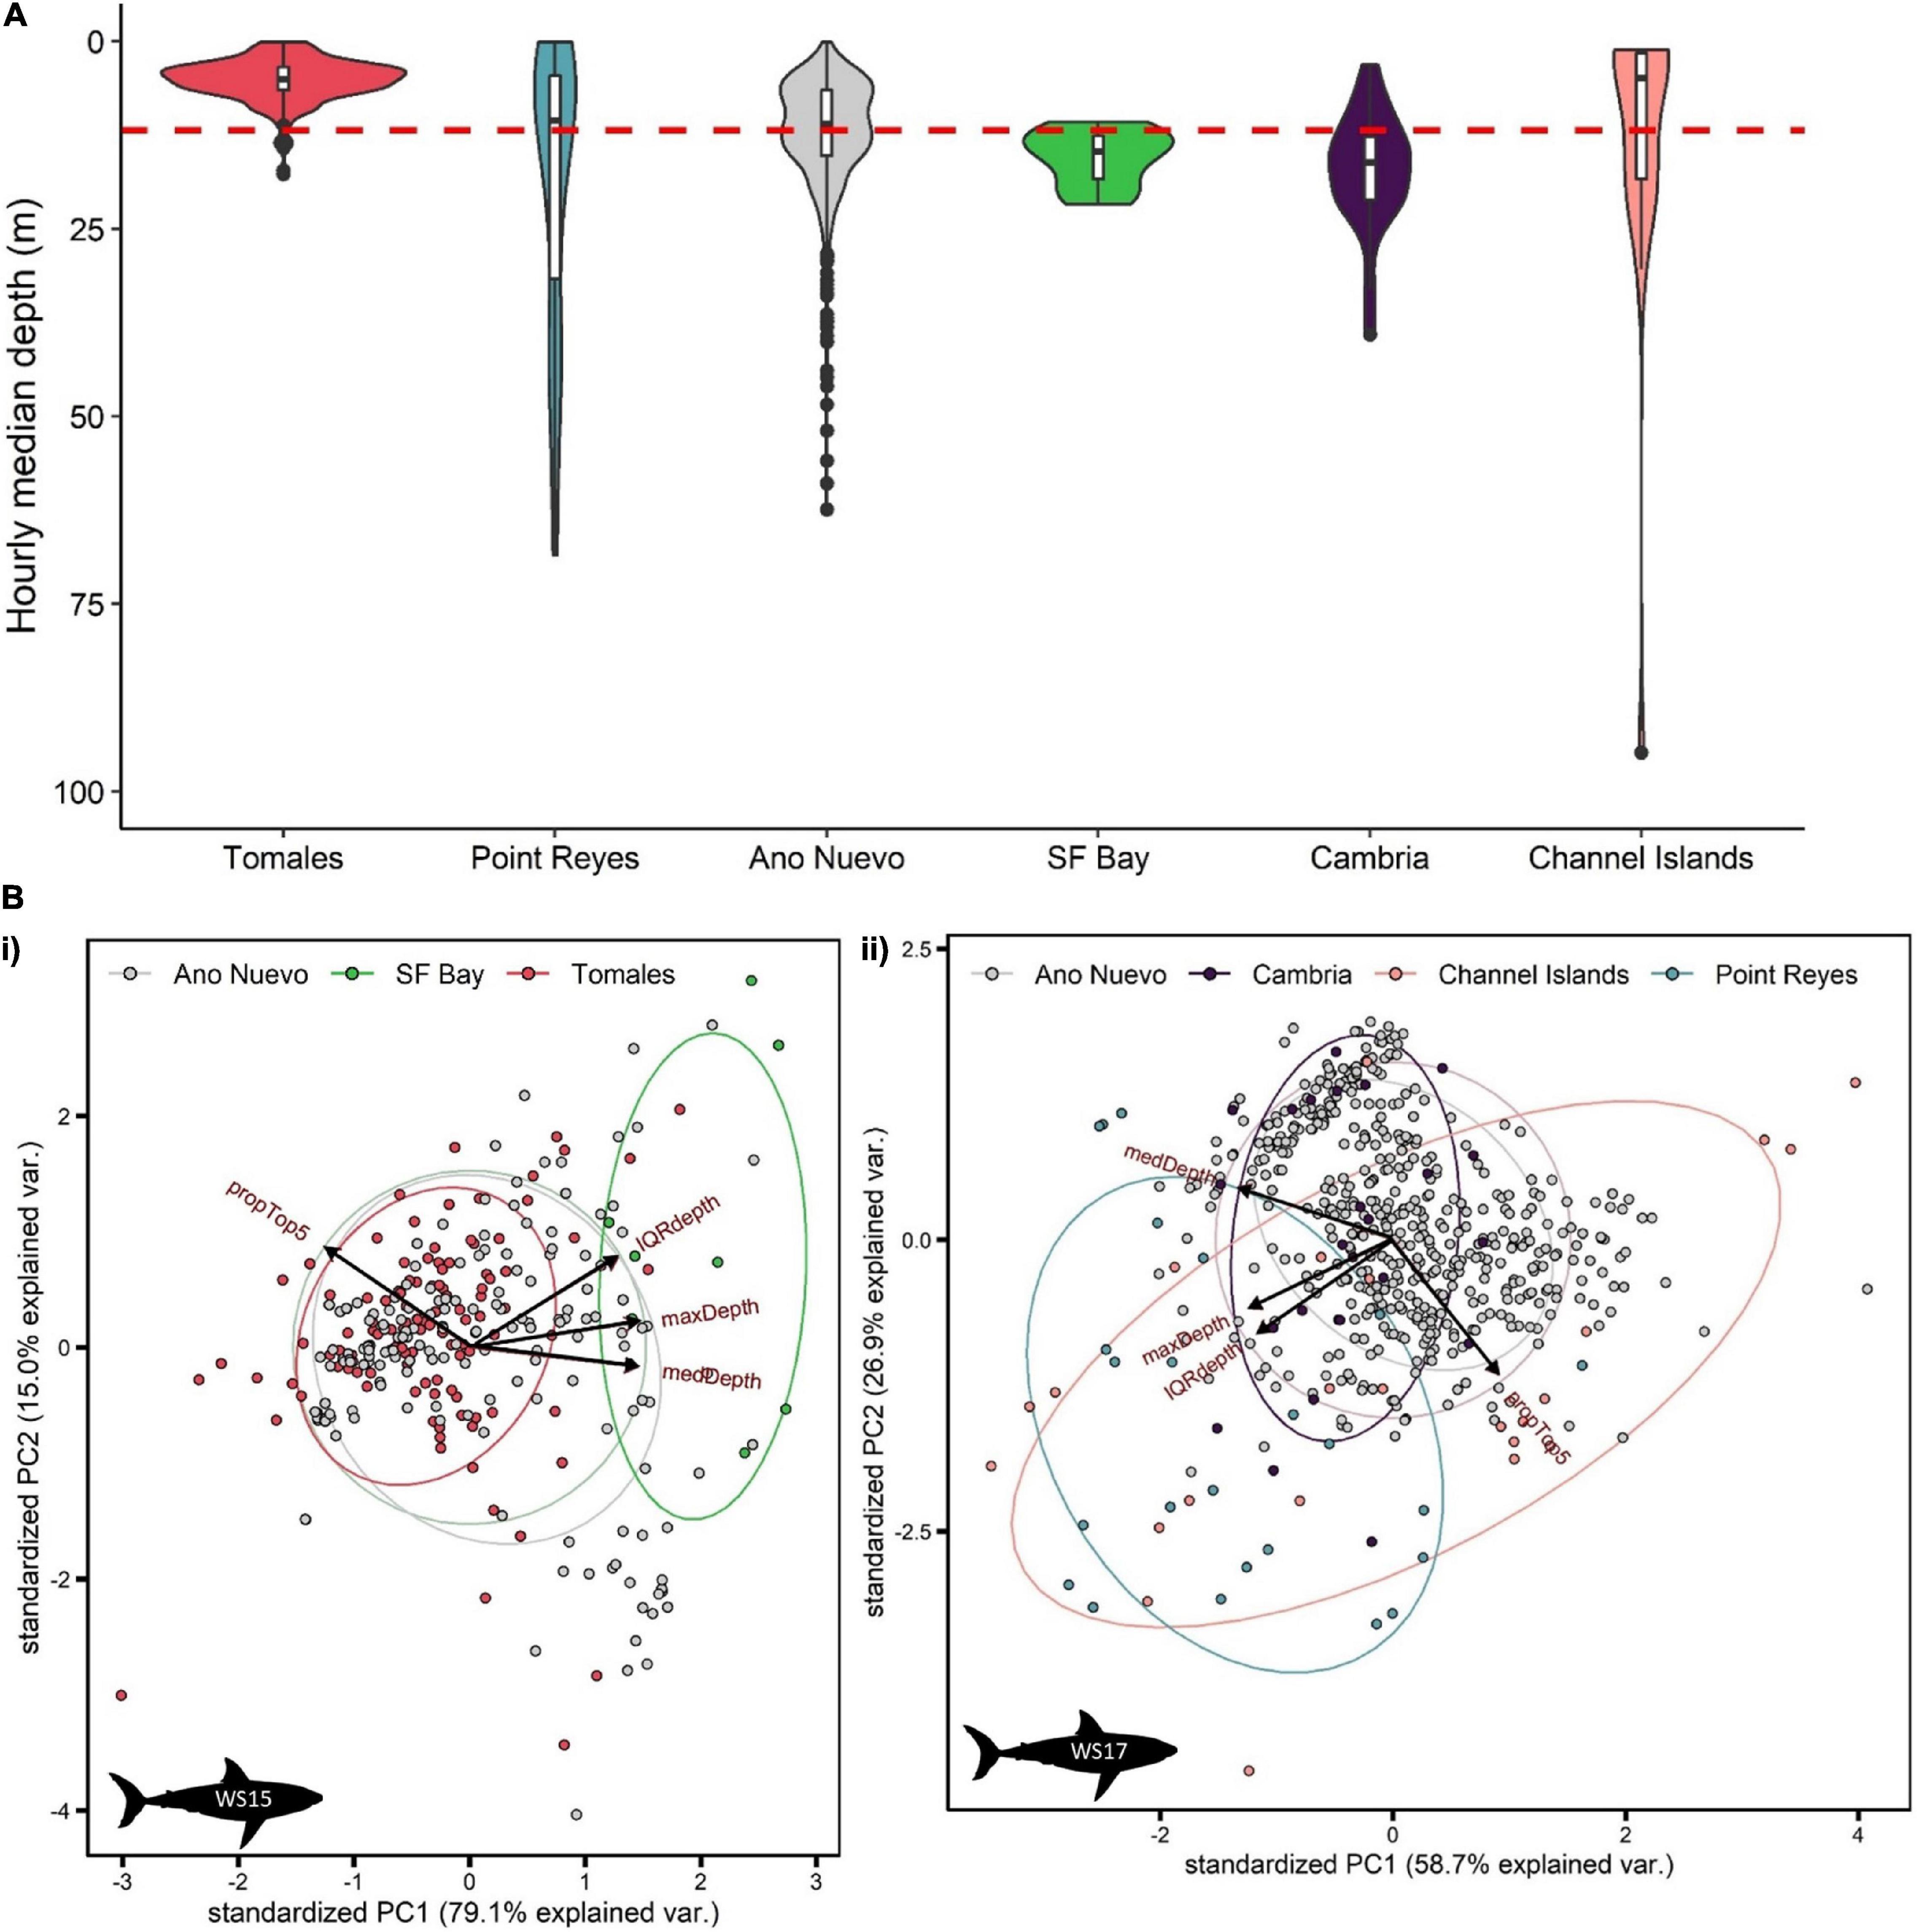
Figure 5. Summarized depth data from PSATS recovered from double-tagged white sharks Carcharodon carcharias in the coastal phase of their migration in the NE Pacific. Site-specific vertical behaviors were determined by date-time matching time-series data with acoustic detection data. Individual sharks were matched to a site either by recording > 1 detection per day at a site, or by a photo-identification match. (A) Violin plot of hourly median depth by site (n = 84 days). The red dashed line indicates the average median depth of all site-specific data (11.8 ± 11.3 m). (B) Principal component analysis of hourly summarized depth data for two sharks (i) WS15 (n = 298 h) and (ii) WS17 (n = 556 h). Input variables were % use top 5 m, maximum depth, median depth and interquartile range in depth. Points are colored by site.
Principal components analysis (PCA) was applied separately to the summarized hourly depth data of two double-tagged sharks which displayed relatively high visitation to sites with acoustic receivers (WS15 and WS17; > 12 days at sites). 94.1 and 85.6% of the variation in vertical movement behaviors could be explained by the first two components for WS15 and WS17, respectively (Figure 5B). For both, PC1 had the highest correlation with maximum and median depth (> 50% for each variable) and PC2 with IQR and % time in the top 5 (> 70% for top 5 m, > 50% IQR). Sites came out in relatively clear clusters, with greater median, maximum and IQR in depth characterizing San Francisco Bay (Figure 5Bi), greater maximum and IQR in depth Point Reyes, and higher surface use the Channel Islands (Figure 5Bii). Año Nuevo was clustered in the middle (∼0,0) for both individuals (Figure 5B).
The Channel Islands
The most-probable tracks from WS11 and WS17, both mature female individuals, revealed they returned to the coast from their offshore migrations via the Channel Islands in June 2007 and July 2012, respectively. The tag from WS11 popped off at Santa Catalina Island in October, while WS17 moved north from the Channel Islands in early October as evident from subsequent acoustic detections at Cambria followed by Año Nuevo. For these two sharks, vertical movements at the Channel Islands were characterized by continuous, deep (> 100 m) oscillatory movements interspersed with periods of surface swimming (Supplementary Figure 4). Diel periodicity was evident in the time-series data, with the deepest oscillations occurring during the morning, and high surface use at night (Supplementary Figure 4). Depth and temperature profiles recorded highly stratified waters, with warm SSTs (> 18°C) and ambient temperatures < 12°C at depths greater than 100 m (Supplementary Figure 4).
Photo-ID Data
Two white sharks were identified by the research team using photo-ID at Año Nuevo during their respective PSAT deployments; WS24 was observed on the 12th Dec 2017 and WS25 on the 7th December 2017. The timing of departure and arrival to the aggregation site by the research vessel was matched to the vertical time-series of each shark to examine behaviors when the vessel that uses attractant scent was present (Supplementary Figure 5). Sharks initially displayed deeper distributions with dives to and from the surface in the first few hours of boat arrival, followed by continuous periods of surface swimming coinciding with the time of photo-ID. Upon departure of the boat from the site, vertical movements increased in depth, and surface swimming stopped (Supplementary Figure 5).
Discussion
In this study, we utilized a large, high-resolution dataset obtained from recovered PSAT tags to examine the vertical habitat use of adult and sub-adult white sharks during the capital foraging phase of their annual migration in the California Current System. Our data revealed broad commonalities in vertical patterns associated with diel timing and lunar phase, while exposing differences across sites selected by white sharks, as well as broader individual-level variation. The comprehensive dataset and analyses enabled detailed investigation of white shark vertical and thermal habitat use, as well as exploration of the processes that may be driving these patterns, and assessment of their ecological and anthropogenic implications.
Patterns and Drivers of Vertical Movements
Diel and lunar trends in white shark vertical movement patterns during their coastal phase suggest that ambient light affects the hunting behaviors of these visual predators. Sharks reduced surface water use and increased use of depths that correlate with that of the seabed around aggregation sites during the early morning, a strategy that would help sharks remain cryptic while searching for surface-oriented prey (Strong, 1996; Goldman and Anderson, 1999). Vertical activity (or “oscillatory diving”) was also highest during this period, a behavior that could be used to search for prey while reducing the energy costs associated with locomotion (Klimley et al., 2002; Watanabe et al., 2019b; Andrzejaczek et al., 2020). Previous work using tri-axial and swim speed sensors on white sharks at the Neptune Islands found oscillatory dives were characterized by slow swim speeds and drift descents, a pattern thought to be a “sit-and-wait” strategy for this perpetually swimming predator, allowing it to increase encounter rates with fast-swimming pinniped prey while reducing swimming costs (Watanabe et al., 2019b). Conversely, at night, white sharks in this study displayed shallower distributions and reduced vertical movement activity, possibly continuing to hunt under the cover of darkness (Klimley et al., 2001; Francis et al., 2012; Watanabe et al., 2019a), though with reduced vertical scope to search for prey. Deeper distributions were correlated with higher lunar illumination, a pattern previously recorded for white sharks in other regions and for other ontogenetic groups (Weng et al., 2007b; Nasby-Lucas et al., 2009; Winton et al., 2021), and may represent sharks following an optimal isolume near foraging sites. Whether these variable vertical movement modes correspond with foraging success throughout the diel cycle remains unquantified, largely due to the difficulties of observing predation attempts during the night. The deployment of tags with high-resolution sensors, such as accelerometers, may help us to better fill this knowledge gap in the near future (e.g., Jorgensen et al., 2015).
Size class and sex had subtle effects on vertical movement patterns. Adult white sharks displayed slightly deeper distributions than sub-adults, however, no other significant trends in vertical movement between these ontogenetic classes were found. As smaller size classes (< 300 cm) have more recently shifted from a predominately piscivorous to marine mammal-based diet, differences in movement patterns may be expected as they adjust to new foraging strategies (Goldman and Anderson, 1999; Domeier et al., 2012). The weak difference here, however, is likely biased by the fact that sub-adult sharks in this study were tagged at marine mammal aggregation sites, and therefore had likely already recruited into the adult population. Lunar and diel effect were consistent among male and female sharks, though the effect of month and average SST varied between sexes, and females had marginally deeper distributions than males. Acoustic data show that males arrive on the coast earlier than females (Chapple et al., 2016), coinciding with the months that recorded the lowest surface use for each group. Notably, differences in vertical habitat use and spatial distribution also vary between males and females during the offshore phase of their migration (Jorgensen et al., 2012a). Although the processes driving such variation remain cryptic, similar trends with lunar and diel phase while in the coastal phase suggest hunting strategy remains consistent among sexes.
Documented differences in vertical movements between male and female white sharks found here may also be driven by the unique migration patterns of two adults. We had full archival records from two mature females that both displayed unique behaviors from males, spending several months in the vicinity of the Channel Islands in southern California. At this site, average SSTs were approximately 5°C warmer than the overall coastal mean, and tagged sharks displayed higher surface use, as well as deeper diving behavior, than at other coastal sites. Patterns of vertical movement between these two individual sharks were remarkably consistent, despite being 5 years apart, and may be driven by these adults migrating to these warmer waters for parturition (Klimley, 1985; Jorgensen et al., 2012b). This period is consistent with the peak abundance of neonates in the area (late summer-fall; Klimley, 1985), and warmer temperatures may facilitate higher survival of pups (Klimley, 1985), while deep diving behavior by adults may prevent body temperature heating above optimum (Andrzejaczek et al., 2018a). Given the large pinniped populations also present at this locality (Lowry et al., 2020) however, we cannot discount the possibility that white sharks were using the Channel Islands exclusively as a foraging site.
Although consistent trends were reported in the modeling process, it is important to acknowledge that a high amount of variability (>77%) in the recorded vertical movement patterns remained unexplained by the final GAMMS. Such low levels of explained deviance are relatively common in telemetry studies (e.g., Peel et al., 2019; Spaet et al., 2020), and here, are likely due to physical and biological variables that could not be quantified at the appropriate resolution due to the errors associated with light-based geolocation. Errors can be significant (Lisovski et al., 2020) and may prohibit the measurement of environmental data at local scales (e.g., bathymetry, tides, wind, swell, turbidity, chlorophyll, dissolved oxygen content). In eastern Australia, for instance, occurrence models for acoustically tagged juvenile white sharks significantly improved when receiver location was added to the models, likely due to this factor capturing location-specific habitat characteristics that weren’t otherwise measured (Spaet et al., 2020). For example, swell height and water clarity have been previously associated with greater attack frequency, perhaps by reducing the available haul-out area for pinniped prey and their detection of stalking white sharks, respectively (Pyle et al., 1996), which may translate into changes in vertical movement patterns. In our study, average SST and monthly SST anomaly were the only environmental variables included in the model and had a weak or no relationship with vertical movements. Reduction in use of depth bins associated with seabed depths of aggregation sites with increased SSTs may be associated with white sharks being in warmer, offshore regions, however, errors in geolocations again prevent us from exploring this pattern in more detail. In addition, white sharks are likely to be switching between different movement states (i.e., resident/foraging and transient) while in their coastal phase and will not always be hunting for prey, resulting in modifications to their vertical movement behaviors.
Data from four double-tagged sharks and photo-ID provided further evidence that site-specific behaviors may be responsible for at least some of the unexplained variation in our study. Bathymetry may be a strong driver of differences between sites, with Tomales having a much shallower seabed than the other sites, limiting median hourly depths to the top 20 m, while steeper and deeper habitat present at the Channel Islands enabled deeper maximum hourly median depths (up to 142 m). Similarly, bathymetry is likely one of the primary factors driving differences among white shark vertical distributions on a more regional scale, such as between aggregations here in central and northern California, and aggregations at Guadalupe Island, where a much greater proportion of time was spent in waters greater than 50 m in the deeper waters of the latter (Domeier et al., 2012). Such differences in available vertical habitat could influence both the way in which sharks hunt for prey, and the strategies taken up by prey to avoid predation (e.g., by diving to much greater depths). Vertical movement metrics recorded at Año Nuevo were consistent with the overall dataset mean, which is to be expected given this is one of the main aggregation sites and where we predict many of the tagged sharks spent considerable amounts of time. At this site, research efforts may have also introduced variability into the data, with vessel presence likely resulting in more surface-oriented behavior than is typical of white sharks here, a phenomenon that we expect will occur in other instances where bait is introduced into white shark habitat, such as through fishing activities or tourism (i.e., cage diving operations). Another notable behavior was from one subadult female shark entering San Francisco Bay for a period of 9 h, a movement that was repeated in four consecutive years at approximately the time sharks are arriving back on the coast following their offshore migrations (July–August). White sharks have relatively large olfactory bulbs (Yopak et al., 2015) that have been hypothesized to aid in navigation (Jacobs, 2012; Yopak et al., 2015), and we therefore speculate that either a unique olfactory or oceanographic signal from the Bay area may act as a “homing signal” for this shark. Other factors that may have influenced differences among sites include site-specific oceanography, prey availability and behavior, and movement state (i.e., resident or transient).
Implications
The potential for white sharks to adjust their vertical behaviors to successfully forage on pinniped prey may have implications at a broader ecosystem level, whereby prey populations aiming to reduce their risk of predation alter their own behavior (Brown et al., 1999). Surface waters (i.e., the top 5 m) around white shark aggregation sites in California during early morning hours were predicted to be the riskiest place for pinniped prey, which may have led to the development of behavioral strategies in pinniped populations (e.g., modified vertical distributions, grouping behavior, and/or the timing of offshore departures) that reduce encounter rates with sharks. Juvenile and adult female northern elephant seals Mirounga angustirostris, for example, largely avoid entering the surface zone, and instead use the bathymetry of the seabed to navigate toward the edge of continental shelf when seasonally migrating offshore (Le Boeuf and Crocker, 1996). In contrast, mature male elephant seals enter surface waters repeatedly around aggregation sites during the breeding season, and pups learn to swim in this high-risk zone, which may lead to higher rates of predation for these ontogenetic groups (Le Boeuf and Crocker, 1996). California sea lions Zalophus californianus also transit through this hunting zone frequently, moving into continental shelf waters or offshore to forage for days at a time before returning to haul-out onshore (Melin et al., 2000; McHuron et al., 2018). For this latter taxa, groups of individuals have been observed to perform fast and simultaneous proposing movements at the surface on both departure and return movements to coastal aggregation sites, which may reduce individual predation risk following the selfish herd theory (Laroche et al., 2008; De Vos and O’Riain, 2010). We further predict that pinnipeds may vary the timing of movement (i.e., diel and seasonally) through coastal aggregation waters as a response to shark hunting tactics, as has been observed by adult Cape fur seals Arctocephalus pusillus pusillus in South Africa (Laroche et al., 2008). A key next step in the California Current system will be to investigate spatial and temporal overlap among these predators (white sharks) and prey (pinniped), especially as such predator-induced shifts in prey movement may impede access to preferred foraging and/or breeding conditions, consequently impacting reproductive opportunities and growth.
From a management context, our understanding of white shark vertical movements will benefit the development of education- and monitoring-based approaches aimed at reducing risk of harmful shark-human interactions (Gibbs and Warren, 2015; Winton et al., 2021), as well as evaluating the susceptibility of white sharks to fishing gears that vary on a vertical gradient (e.g., Wright et al., 2021). Currently, per capita rates of unprovoked bites on humans in the northeastern Pacific Ocean remain relatively low (Curtis et al., 2012; Ferretti et al., 2015). Increasing recreational ocean use (Ferretti et al., 2015) paired with shifts in potential range (Tanaka et al., 2021) and abundance (Kanive et al., 2021) of white sharks, however, may influence these interactions. An understanding of how and when white sharks use surface waters on the coast may improve our ability to proactively develop risk avoidance behaviors and reduce the probability of these rare events occurring (Winton et al., 2021). For example, understanding which hours of the day white sharks are more likely to occupy surface waters may inform swimmers as to the safest times to use the ocean. Similar to white sharks in Cape Cod (Winton et al., 2021), surface use behavior on the California coast was highest at night, a period when beach visitation rates are typically the lowest. However, this may not correlate with periods of active hunting. An important next step in this process will therefore be to confirm how the surface use of white sharks translates to discrete behaviors when foraging and transiting, so that we can further refine our understanding of when and where these predators are likely to be foraging. Aerial monitoring methods (i.e., drones, blimps), previously shown to be effective for real-time shark detection and alerting in Australia (Butcher et al., 2019; Adams et al., 2020), provide one such means to quantify surface-based behaviors by white sharks. However, as median depths reported here for adult and subadults are typically deeper than we expect average detection range of a drone, we predict these aerial methods are unlikely to be as useful in the California region for these larger white sharks. Alternatively, and as discussed above, high-resolution biologging tags that record activity levels of individuals could be used. By describing the coastal behaviors of these animals at this fine-scale, we will be better equipped to manage both human-shark interaction risks and white shark populations in a dynamic, shifting global climate.
Data Availability Statement
Tagging data up until 2009 is a part of the publicly available TOPP dataset. All other raw data supporting the conclusions of this article will be made available by the authors, without undue reservation.
Ethics Statement
The animal study was reviewed and approved by the Stanford University animal care protocol 10765.
Author Contributions
SA and BB conceived the study. SA, TC, SJ, SDA, PK, TW, and BB performed fieldwork and data collection. SA and MC processed and analyzed the data. SA, TC, SJ, PK, and BB interpreted the data. SA led the writing of the manuscript. All authors read and approved the final manuscript.
Funding
Funding for this research was provided by the Moore, Packard and Monterey Bay Aquarium Research Foundations. We thank Discovery Communications, NOAA IOOS and CeNCOOS for providing funds for tags in 2017 and 2018. Additional funds were available from Rolex Award for Enterprise and individual philanthropic supporters of the Stanford white shark program. We thank the Schmidt Ocean Institute for providing the research vessel Falkor and enabling recovery of tags offshore.
Conflict of Interest
The authors declare that the research was conducted in the absence of any commercial or financial relationships that could be construed as a potential conflict of interest.
Publisher’s Note
All claims expressed in this article are solely those of the authors and do not necessarily represent those of their affiliated organizations, or those of the publisher, the editors and the reviewers. Any product that may be evaluated in this article, or claim that may be made by its manufacturer, is not guaranteed or endorsed by the publisher.
Acknowledgments
We thank the white shark research program volunteers as well as Stanford graduate and undergraduate students, postdoctoral researchers, and Block lab staff that provided unwavering support for the program across the two decades of tagging research, including T. Reimer, J. Cornelius, N. Arnoldi, S. Van Sommeran, E. Estess, K. Weng, and A. Boustany. We thank James Ganong and Alan Swithenbank for their efforts in maintaining the TOPP database and processing and archiving of data. We thank M. Goodman for statistical advice. We thank Tom O’Leary for donating time and vessel opportunities for shark observation and electronic tagging at Año Nuevo. We thank the crew and captains of RSV Dereck and M. Bayliss, and S. Rhodes and P. Conroy of the Norcal at the Farallones. We would also like to thank David Wells, Michael Domeier, and Luis Cardona for providing constructive comments that improved the manuscript.
Supplementary Material
The Supplementary Material for this article can be found online at: https://www.frontiersin.org/articles/10.3389/fmars.2022.835576/full#supplementary-material
Supplementary Data Sheet 2 | Full list of model subsets considered in the model selection process. Each tab includes the subsets considered for each unique model, with ‘a’ and ‘b’ being for females and males respectively. The highlighted row indicates the selected model.
References
Adams, K. R., Gibbs, L., Knott, N. A., Broad, A., Hing, M., Taylor, M. D., et al. (2020). Coexisting with sharks: a novel, socially acceptable and non-lethal shark mitigation approach. Sci. Rep. 10:17497. doi: 10.1038/s41598-020-74270-y
Afonso, A. S., and Hazin, F. H. (2015). Vertical movement patterns and ontogenetic niche expansion in the tiger shark, Galeocerdo cuvier. PLoS One 10:e116720. doi: 10.1371/journal.pone.0116720
Ainley, A. D., Strong, C. S., Huber, T. J., Lewis, T. J., and Morrell, S. H. (1981). Predation by sharks on pinnipeds at the Farallon Islands. U.S. Fish Bull. 78, 941–945.
Andrzejaczek, S., Gleiss, A. C., Jordan, L. K. B., Pattiaratchi, C. B., Howey, L. A., Brooks, E. J., et al. (2018a). Temperature and the vertical movements of oceanic whitetip sharks, Carcharhinus longimanus. Sci. Rep. 8:8351. doi: 10.1038/s41598-018-26485-3
Andrzejaczek, S., Gleiss, A. C., Pattiaratchi, C. B., and Meekan, M. G. (2018b). First insights into the fine-scale movements of the sandbar shark, Carcharhinus plumbeus. Front. Mar. Sci. 5:483. doi: 10.3389/fmars.2018.00483
Andrzejaczek, S., Gleiss, A. C., Lear, K. O., Pattiaratchi, C., Chapple, T. K., and Meekan, M. G. (2020). Depth-dependent dive kinematics suggest cost-efficient foraging strategies by tiger sharks. R. Soc. Open Sci. 7:200789. doi: 10.1098/rsos.200789
Andrzejaczek, S., Schallert, R. J., Forsberg, K., Arnoldi, N. S., Cabanillas-Torpoco, M., Purizaca, W., et al. (2021). Reverse diel vertical movements of oceanic manta rays off the northern coast of Peru and implications for conservation. Ecol. Solut. Evid. 2:e12051. doi: 10.1002/2688-8319.12051
Beltran, R. S., Kendall-Bar, J. M., Pirotta, E., Adachi, T., Naito, Y., Takahashi, A., et al. (2021). Lightscapes of fear: how mesopredators balance starvation and predation in the open ocean. Sci. Adv. 7:eabd9818. doi: 10.1126/sciadv.abd9818
Block, B. A., Jonsen, I. D., Jorgensen, S. J., Winship, A. J., Shaffer, S. A., Bograd, S. J., et al. (2011). Tracking apex marine predator movements in a dynamic ocean. Nature 475, 86–90. doi: 10.1038/nature10082
Boustany, A. M., Davis, S. F., Pyle, P., Anderson, S. D., Boeuf, B. J., and Block, B. A. (2002). Expanded niche for white sharks. Nature 415:415235b. doi: 10.1038/415035b
Braun, C. D., Skomal, G. B., and Thorrold, S. R. (2018). Integrating archival tag data and a high-resolution oceanographic model to estimate basking shark (Cetorhinus maximus) movements in the Western Atlantic. Front. Mar. Sci. 5:25. doi: 10.3389/fmars.2018.00025
Brown, J. S., Laundré, J. W., and Gurung, M. (1999). The ecology of fear: optimal foraging, game theory, and trophic interactions. J. Mammal. 80, 385–399. doi: 10.2307/1383287
Butcher, P. A., Piddocke, T. P., Colefax, A. P., Hoade, B., Peddemors, V. M., Borg, L., et al. (2019). Beach safety: can drones provide a platform for sighting sharks? Wild. Res. 46, 701–712. doi: 10.1071/WR18119
Chapple, T. K., Chambert, T., Kanive, P. E., Jorgensen, S. J., Rotella, J. J., Anderson, S. D., et al. (2016). A novel application of multi-event modeling to estimate class segregation in a highly migratory oceanic vertebrate. Ecology 97, 3494–3502. doi: 10.1002/ecy.1589
Chapple, T. K., Jorgensen, S. J., Anderson, S. D., Kanive, P. E., Klimley, A. P., Botsford, L. W., et al. (2011). A first estimate of white shark, Carcharodon carcharias, abundance off Central California. Biol. Lett. 7, 581–583. doi: 10.1098/rsbl.2011.0124
Coffey, D. M., Carlisle, A. B., Hazen, E. L., and Block, B. A. (2017). Oceanographic drivers of the vertical distribution of a highly migratory, endothermic shark. Sci. Rep. 7:10434. doi: 10.1038/s41598-017-11059-6
Curtis, T. H., Bruce, B. D., Cliff, G., Dudley, S. F. J., Klimley, A. P., Kock, A., et al. (2012). “Responding to the risk of white shark attack: updated statistics, prevention, control methods, and recommendations,” in Global Perspectives on the Biology and Life History of the White Shark, ed. M. L. Domeier (Boca Raton, FL: CRC Press), 477–509.
De Vos, A., and O’Riain, M. J. (2010). Sharks shape the geometry of a selfish seal herd: experimental evidence from seal decoys. Biol. Lett. 6, 48–50. doi: 10.1098/rsbl.2009.0628
Del Raye, G., Jorgensen, S. J., Krumhansl, K., Ezcurra, J. M., and Block, B. A. (2013). Travelling light: white sharks (Carcharodon carcharias) rely on body lipid stores to power ocean-basin scale migration. Proc. R. Soc. B Biol. Sci. 280:20130836. doi: 10.1098/rspb.2013.0836
Domeier, M. L., and Nasby-Lucas, N. (2008). Migration patterns of white sharks Carcharodon carcharias tagged at Guadalupe Island, Mexico, and identification of an eastern Pacific shared offshore foraging area. Mar. Ecol. Prog. Ser. 370, 221–237. doi: 10.3354/meps07628
Domeier, M. L., Nasby-Lucas, N., and Lam, C. H. (2012). “Fine-scale habitat use by white sharks at Guadalupe Island, Mexico,” in Global Perspectives on the Biology and Life History of the White Shark, ed. M. L. Domeier (Boca Raton, FL: CRC Press), 121–132. doi: 10.1111/jfb.12828
Ferretti, F., Jorgensen, S., Chapple, T. K., De Leo, G., and Micheli, F. (2015). Reconciling predator conservation with public safety. Front. Ecol. Environ. 13:412–417. doi: 10.1890/150109
Francis, M. P. (1996). “Observations on a pregnant white shark with a review of reproductive biology,” in Great White Sharks: The Biology of Carcharodon Carcharias, eds A. P. Klimley and D. G. Ainley (San Diego, CA: Academic Press), 157–172.
Francis, M. P., Duffy, C. A. J., Bonfil, R., and Manning, M. J. (2012). “The third dimension – vertical habitat use by white sharks, Carcharodon carcharias, in New Zealand and in oceanic and tropical waters of the southwest Pacific Ocean,” in Global Perspectives on the Biology and Life History of the Great White Shark, ed. M. L. Domeier (Boca Raton, FL: CRC Press).
Gibbs, L., and Warren, A. (2015). Transforming shark hazard policy: learning from ocean-users and shark encounter in Western Australia. Mar. Policy 58, 116–124. doi: 10.1016/j.marpol.2015.04.014
Goldman, K. J., and Anderson, S. D. (1999). Space utilization and swimming depth of white sharks, Carcharodon carcharias, at the South Farallon Islands, Central California. Environ. Biol. Fish. 56, 351–364. doi: 10.1023/a:1007520931105
Jacobs, L. F. (2012). From chemotaxis to the cognitive map: the function of olfaction. Proc. Natl. Acad. Sci. U.S.A. 109(Suppl. 1):10693. doi: 10.1073/pnas.1201880109
Jorgensen, S. J., Anderson, S., Ferretti, F., Tietz, J. R., Chapple, T., Kanive, P., et al. (2019). Killer whales redistribute white shark foraging pressure on seals. Sci. Rep. 9:6153. doi: 10.1038/s41598-019-39356-2
Jorgensen, S. J., Arnoldi, N. S., Estess, E. E., Chapple, T. K., Rückert, M., Anderson, S. D., et al. (2012a). Eating or meeting? Cluster analysis reveals intricacies of white shark (Carcharodon carcharias) migration and offshore behavior. PLoS One 7:e47819. doi: 10.1371/journal.pone.0047819
Jorgensen, S. J., Chapple, T. K., Anderson, S., Hoyos, M., Reeb, C., and Block, B. A. (2012b). “Connectivity among white shark coastal aggregation areas in the northeastern Pacific,” in Global Perspectives on the Biology and Life History of the White Shark, ed. M. L. Domeier (Boca Raton, FL: CRC Press), 159–168. doi: 10.1093/jhered/esv034
Jorgensen, S. J., Gleiss, A. C., Kanive, P. E., Chapple, T. K., Anderson, S. D., Ezcurra, J. M., et al. (2015). In the belly of the beast: resolving stomach tag data to link temperature, acceleration and feeding in white sharks (Carcharodon carcharias). Anim. Biotelem. 3, 1–10. doi: 10.1186/s40317-015-0071-6
Jorgensen, S. J., Reeb, C. A., Chapple, T. K., Anderson, S., Perle, C., Van Sommeran, S. R., et al. (2009). Philopatry and migration of Pacific white sharks. Proc. R. Soc. B Biol. Sci. 9, 679–688. doi: 10.1098/rspb.2009.1155
Kanive, P. E., Rotella, J. J., Chapple, T. K., Anderson, S. D., White, T. D., Block, B. A., et al. (2021). Estimates of regional annual abundance and population growth rates of white sharks off central California. Biol. Conserv. 257:109104. doi: 10.1016/j.biocon.2021.109104
Klimley, A. P. (1985). The areal distribution and autoecology of the white shark, Carcharodon carcharias, off the west coast of North America. Mem. South. Califor. Acad. Sci. 9, 15–40.
Klimley, A. P., Anderson, S. D., Pyle, P., and Henderson, R. P. (1992). Spatiotemporal patterns of white shark (Carcharodon carcharias) predation at the south farallon Islands, California. Copeia 1992, 680–690. doi: 10.2307/1446143
Klimley, A. P., Beavers, S. C., Curtis, T. H., and Jorgensen, S. J. (2002). Movements and swimming behavior of three species of sharks in La Jolla Canyon, California. Environ. Biol. Fish. 63, 117–135. doi: 10.1023/A:1014200301213
Klimley, A. P., Le Boeuf, B. J., Cantara, K. M., Richert, J. E., Davis, S. F., Van Sommeran, S., et al. (2001). The hunting strategy of white sharks (Carcharodon carcharias) near a seal colony. Mar. Biol. 138, 617–636. doi: 10.1007/s002270000489
Laroche, R. K., Kock, A. A., Dill, L. M., and Oosthuizen, W. H. (2008). Running the gauntlet: a predator–prey game between sharks and two age classes of seals. Anim. Behav. 76, 1901–1917. doi: 10.1016/j.anbehav.2008.06.025
Le Boeuf, B. J., and Crocker, D. E. (1996). “Diving behavior of elephant seals: implications for predator avoidance,” in Great White Shark: The Biology of Carcharodon Carcharias, ed. A. P. Klimley (San Diego, CA: Academic Press).
LeBoeuf, B. J., Riedman, R. M., and Keyes, R. S. (1982). White shark predation on pinnipeds in California coastal waters. Fish. Bull. 80, 891–895.
Lester, E. K., Langlois, T. J., Simpson, S. D., McCormick, M. I., and Meekan, M. G. (2020). The hemisphere of fear: the presence of sharks influences the three dimensional behaviour of large mesopredators in a coral reef ecosystem. Oikos 129, 731–739. doi: 10.1111/oik.06844
Lima, S. L., and Dill, L. M. (1990). Behavioral decisions made under the risk of predation: a review and prospectus. Canad. J. Zool. 68, 619–640. doi: 10.1139/z90-092
Lisovski, S., Bauer, S., Briedis, M., Davidson, S. C., Dhanjal-Adams, K. L., Hallworth, M. T., et al. (2020). Light-level geolocator analyses: a user’s guide. J. Anim. Ecol. 89, 221–236. doi: 10.1111/1365-2656.13036
Long, D. J., Hanni, K. D., Pyle, P., Roletto, J., Jones, R. E., and Bandar, R. (1996). “White shark predation on four pinniped species in central California waters: Geographic and temporal patterns inferred from wounded carcasses,” in Great White Sharks: The Biology of Carcharodon Carcharias, eds A. P. Klimley and D. G. Ainley (San Diego, CA: Academic Press).
Lowry, M. S., Jaime, E. M., Nehasil, S. E., Betcher, A., and Condit, R. (2020). Winter Surveys at the Channel Islands and Point Conception Reveal Population Growth of Northern Elephant Seals and Residence Counts of Other Pinnipeds, NOAA Technical Memorandum NMFS-SWFSC-627. Washington, DC: U.S. Department of Commerce, National Oceanic and Atmospheric Administration.
McHuron, E. A., Block, B. A., and Costa, D. P. (2018). Movements and dive behavior of juvenile California sea lions from Año Nuevo Island. Mar. Mam. Sci. 34, 238–249. doi: 10.1111/mms.12449
Melin, S. R., Delong, R. L., Thomason, J. R., and Vanblaricom, G. R. (2000). Attendance patterns of California sea lion (Zalophus californianus) females and pups during the non-breeding season at San Miguel Island. Mar. Mam. Sci. 16, 169–185. doi: 10.1111/j.1748-7692.2000.tb00911.x
Mourier, J., Maynard, J., Parravicini, V., Ballesta, L., Clua, E., Domeier, M. L., et al. (2016). Extreme inverted trophic pyramid of reef sharks supported by spawning groupers. Curr. Biol. 26, 2011–2016. doi: 10.1016/j.cub.2016.05.058
Nasby-Lucas, N., Dewar, H., Lam, C. H., Goldman, K. J., and Domeier, M. L. (2009). White shark offshore habitat: a behavioral and environmental characterization of the eastern pacific shared offshore foraging area. PLoS One 4:e8163. doi: 10.1371/journal.pone.0008163
Pedersen, M. W., Patterson, T. A., Thygesen, U. H., and Madsen, H. (2011). Estimating animal behavior and residency from movement data. Oikos 120, 1281–1290. doi: 10.1111/j.1600-0706.2011.19044.x
Peel, L. R., Stevens, G. M. W., Daly, R., Keating Daly, C. A., Lea, J. S. E., Clarke, C. R., et al. (2019). Movement and residency patterns of reef manta rays Mobula alfredi in the Amirante Islands, Seychelles. Mar. Ecol. Progr. Ser. 621, 169–184. doi: 10.3354/meps12995
Pratt, H. L. (1996). “Reproduction in the male white shark,” in Great White Sharks: The Biology of Carcharodon Carcharias, eds A. P. Klimley and D. G. Ainley (San Diego, CA: Academic Press), 131–138. doi: 10.1016/b978-012415031-7/50014-8
Pyle, P., Anderson, S. D., Klimley, A. P., and Henderson, R. P. (1996). “Environmental factors affecting the occurrence and behavior of white sharks at the Farallon Islands, California,” in Great White Sharks: The Biology of Carcharodon Carcharias, eds A. P. Klimley and D. G. Ainley (San Diego, CA: Academic Press), 281–291.
R Core Team (2020). R: A Language and Environment for Statistical Computing, ed. R.F.f.S. Computing (Vienna: R Core Team).
Skomal, G. B., Braun, C. D., Chisholm, J. H., and Thorrold, S. R. (2017). Movements of the white shark Carcharodon carcharias in the North Atlantic Ocean. Mar. Ecol. Progr. Ser. 580, 1–16. doi: 10.3354/meps12306
Spaet, J. L. Y., Manica, A., Brand, C. P., Gallen, C., and Butcher, P. A. (2020). Environmental conditions are poor predictors of immature white shark Carcharodon carcharias occurrences on coastal beaches of eastern Australia. Mar. Ecol. Progr. Ser. 653, 167–179. doi: 10.3354/meps13488
Strong, W. R. Jr. (1996). “Shape discrimination and visual predatory tactics in white sharks,” in Great White Sharks: The Biology of Carcharodon Carcharias, eds A. P. Klimley and A. D. Ainley (New York, NY: Academic Press), 229–240. doi: 10.1016/b978-012415031-7/50022-7
Tanaka, K. R., Van Houtan, K. S., Mailander, E., Dias, B. S., Galginaitis, C., O’Sullivan, J., et al. (2021). North Pacific warming shifts the juvenile range of a marine apex predator. Sci. Rep. 11:3373. doi: 10.1038/s41598-021-82424-9
Thieurmel, B., and Elmarhraoui, A. (2019). suncalc: Compute Sun Position, Sunlight Phases, Moon Position and Lunar Phase [Online]. Available online at: https://CRAN.R-project.org/package=suncalc (accessed September 10, 2020).
Watanabe, Y. Y., Payne, N. L., Semmens, J. M., Fox, A., and Huveneers, C. (2019b). Swimming strategies and energetics of endothermic white sharks during foraging. J. Exp. Biol. 222:jeb185603. doi: 10.1242/jeb.185603
Watanabe, Y. Y., Payne, N. L., Semmens, J. M., Fox, A., and Huveneers, C. (2019a). Hunting behaviour of white sharks recorded by animal-borne accelerometers and cameras. Mar. Ecol. Progr. Ser. 621, 221–227. doi: 10.3354/meps12981
Weng, K. C., Boustany, A. M., Pyle, P., Anderson, S. D., Brown, A., and Block, B. A. (2007a). Migration and habitat of white sharks (Carcharodon carcharias) in the eastern Pacific Ocean. Mar. Biol. 152, 877–894. doi: 10.1007/s00227-007-0739-4
Weng, K. C., O’Sullivan, J. B., Lowe, C. G., Winkler, C. E., Dewar, H., and Block, B. A. (2007b). Movements, behavior and habitat preferences of juvenile white sharks Carcharodon carcharias in the eastern Pacific. Mar. Ecol. Progr. Ser. 338, 211–224. doi: 10.3354/meps338211
Wilson, S. G., Jonsen, I. D., Schallert, R. J., Ganong, J. E., Castleton, M. R., Spares, A. D., et al. (2015). Tracking the fidelity of Atlantic bluefin tuna released in Canadian waters to the Gulf of Mexico spawning grounds. Canad. J. Fisher. Aquatic Sci. 72, 1700–1717. doi: 10.1139/cjfas-2015-0110
Winton, M. V., Sulikowski, J., and Skomal, G. B. (2021). Fine-scale vertical habitat use of white sharks at an emerging aggregation site and implications for public safety. Wildlife Res. 48, 345–360. doi: 10.1071/WR20029
Wright, S. R., Righton, D., Naulaerts, J., Schallert, R. J., Griffiths, C. A., Chapple, T., et al. (2021). Yellowfin tuna behavioural ecology and catchability in the south atlantic: the right place at the right time (and Depth). Front. Mar. Sci. 8:616. doi: 10.3389/fmars.2021.664593
Yopak, K. E., Lisney, T. J., and Collin, S. P. (2015). Not all sharks are “swimming noses”: variation in olfactory bulb size in cartilaginous fishes. Brain Struct. Funct. 220, 1127–1143. doi: 10.1007/s00429-014-0705-0
Keywords: biologging, California Current System, diving behavior, marine megafauna, movement ecology, satellite tagging, telemetry, white shark
Citation: Andrzejaczek S, Chapple TK, Jorgensen SJ, Anderson SD, Castleton M, Kanive PE, White TD and Block BA (2022) Multi-Decadal High-Resolution Data Reveal the Cryptic Vertical Movement Patterns of a Large Marine Predator Along the Californian Coast. Front. Mar. Sci. 9:835576. doi: 10.3389/fmars.2022.835576
Received: 14 December 2021; Accepted: 25 January 2022;
Published: 25 February 2022.
Edited by:
David Wells, Texas A&M University at Galveston, United StatesReviewed by:
Michael Domeier, Marine Conservation Science Institute (MCSI), United StatesLuis Cardona, University of Barcelona, Spain
Copyright © 2022 Andrzejaczek, Chapple, Jorgensen, Anderson, Castleton, Kanive, White and Block. This is an open-access article distributed under the terms of the Creative Commons Attribution License (CC BY). The use, distribution or reproduction in other forums is permitted, provided the original author(s) and the copyright owner(s) are credited and that the original publication in this journal is cited, in accordance with accepted academic practice. No use, distribution or reproduction is permitted which does not comply with these terms.
*Correspondence: Samantha Andrzejaczek, sandrzejaczek@gmail.com