Spatial Distribution, Temporal Changes, and Knowledge Gaps in Basking Shark (Cetorhinus maximus) Sightings in the California Current Ecosystem
 Alexandra G. McInturf1,2,3*
  Barbara Muhling4,5
  Joseph J. Bizzarro6,7
  Nann A. Fangue1 David A. Ebert8,9 Damien Caillaud10*
  Heidi Dewar5
- 1Department of Wildlife, Fish and Conservation Biology, University of California, Davis, Davis, CA, United States
- 2Animal Behavior Graduate Group, University of California, Davis, Davis, CA United States
- 3Coastal Oregon Marine Experiment Station, Oregon State University, Newport, OR, United States
- 4Institute of Marine Sciences, University of California, Santa Cruz, Santa Cruz, CA, United States
- 5NOAA Southwest Fisheries Science Center, San Diego, CA, United States
- 6Cooperative Institute for Marine Ecosystems and Climate, University of California, Santa Cruz, Santa Cruz, CA, United States
- 7Fisheries Ecology Division, NOAA Southwest Fisheries Science Center, Santa Cruz, CA, United States
- 8Pacific Shark Research Center, Moss Landing Marine Laboratories, Moss Landing, CA, United States
- 9South African Institute for Aquatic Biodiversity, Grahamstown, South Africa
- 10Department of Anthropology, University of California, Davis, Davis, CA, United States
Among the largest fish species, the basking shark (Cetorhinus maximus) is found circumglobally in temperate and tropical waters. Though historical documents have recorded their presence in the California Current Ecosystem (CCE), basking sharks are now only rarely observed in this part of their range. We compiled recent and historical data from systematic surveys (1962–1997) and other sources (1973–2018) to (i) examine temporal patterns of basking shark sightings in the CCE, and (ii) determine the spatial, temporal, and environmental drivers that have affected basking shark presence and distribution here for the last 50 years. We first calculated variation in basking shark sightings and school size over time. We then generated species distribution models using the systematic survey data and evaluated the performance of these models against the more recent non-systematic sightings data. The sightings records indicated that the number of shark sightings was variable across years, but the number and probability of sightings declined in the mid-1980s. The systematic survey data showed up to nearly 4,000 sharks sighted per year until the 1990s, after which there were no sightings reported. In parallel, there was more than a 50% decline in school size from the 1960s to the 1980s (57.2 to 24.0 individuals per group). During the subsequent decades in the non-systematic data (>1990), less than 60 sharks were sighted per year. There were no schools larger than 10 reported, and the mean school size in the last decade (2010s) was 3.53 individuals per group. Low sea surface temperature and high chlorophyll a concentration increased sightings probability, and prevailing climatic oscillations (El Nino-Southern Oscillation index, North Pacific Gyre Oscillation, Pacific Decadal Oscillation) were also correlated with basking shark presence. Lastly, we observed a significant shift in the seasonality of sightings, from the fall and spring during the systematic survey period to the summer months after the 2000s. We conclude by offering suggestions for future research and conservation efforts; specifically, coordinating the documentation of fisheries mortalities and sightings throughout the Pacific basin would facilitate more robust population estimates and identify sources of mortality. Additionally, monitoring shark fin markets and developing region-specific genetic markers would help ensure that convention on international trade in endangered species (CITES) regulations are being followed.
Introduction
Natural ecosystems are increasingly impacted by human activity, leading to losses in biodiversity and population declines of many species worldwide. Of particular concern is the decline of marine top predators, including a number of shark species (Estes et al., 2011; Pacoureau et al., 2021). The projected impacts of predator loss are numerous and diverse, and many are species-specific. Ecological consequences include trophic cascades, mesopredator release, and potential declines in commercially important teleost species and their prey (Heithaus et al., 2008; Polovina and Woodworth-Jefcoats, 2013). Unfortunately, identifying potential trends in shark population size can be challenging, as studies that quantify these trends are often restricted to localized fisheries-independent surveys, or more commonly, broader fishery-dependent analyses of catch per unit effort (e.g., Simpfendorfer et al., 2002; Lucifora et al., 2005; Drymon et al., 2011; Polovina and Woodworth-Jefcoats, 2013; Peterson et al., 2017). For large mobile species that have limited interactions with fisheries, frequently occupy offshore areas, and are difficult to survey, there is a lack of data that renders the underlying mechanisms and magnitude of potential declines challenging to determine.
The basking shark (Cetorhinus maximus) is among the species for which data gaps limit analysis of population trends. It is the world’s second largest fish and one of three filter-feeding shark species. Though many aspects of its biology remain unknown, it is thought to be a long-lived organism with a low rate of population growth (i.e., generation time of ∼20–30 years; McFarlane et al., 2009). Circumglobally distributed in temperate and tropical regions, basking sharks are capable of large-scale migrations, traversing entire ocean basins beyond the legal protection of one single country (Gore et al., 2008; Braun et al., 2018; Dewar et al., 2018). During certain months, individuals aggregate in shallow coastal hotspots, many of which are characterized by high frontal activity or merging water masses (e.g., Sims and Quayle, 1998; Skomal et al., 2004; Miller et al., 2015; Crowe et al., 2018). In these locations, sharks can be observed feeding at the surface, often on calanoid copepods (Calanus spp.), along visible tidal lines that mark the front boundary (Baduini, 1995; Sims and Quayle, 1998; Miller et al., 2015). Basking shark coastal hotspots have been recorded primarily in the northern hemisphere and in New Zealand (Francis and Duffy, 2002; Finucci et al., 2021), though their seasonality varies by location. In regions in the Northern Atlantic, the Eastern Coast of North America, and in New Zealand, hotspots consistently form in late April through early September (i.e., Sims et al., 2003; Speedie et al., 2009; Lieber et al., 2013, 2020; Siders et al., 2013; Hoogenboom et al., 2015; Gore et al., 2018; Finucci et al., 2021). Conversely, in the Eastern North Pacific (ENP), hotspots were observed in the mid-20th century during summer months along the southern coast of British Columbia in Canada, but during winter months in California’s Morro and Monterey Bays (Squire, 1967, 1990; McFarlane et al., 2009). As a result, sharks in this region were thought to represent a single ENP population that ranged from Alaska between March and October, to as far south as Baja California from October through May (Squire, 1990; McFarlane et al., 2009; Dewar et al., 2018). However, historical and recent observations suggest that this seasonality may have changed. Fishermen in the early 1900s noted shark presence in central California year-round (Squire, 1967), yet starting in the 1990s, basking sharks have been primarily observed in June, July and August (Baduini, 1995; Dewar et al., 2018). Factors driving shifts in occurrence have not been determined.
Historically, their seasonal aggregation behavior made basking sharks a periodic target for direct commercial fisheries in temperate waters. Particularly in the early 20th century, they were fished for their liver oil, fins, and meat. In the Atlantic, Ireland’s Achill Island fishery alone captured over 1,000 basking sharks annually from 1951 to 1955 and continued to operate through 1965 (Went and Súilleabháin, 1967). Minor sport and commercial fisheries in central California also emerged to target basking sharks in the early twentieth century. Starting in 1924, an average of 25 sharks were landed each season (September – May), with a maximum of 100 sharks landed in a single year until the fishery ended in 1938 (Phillips, 1948), partly because of a decline in shark availability. The fishery re-emerged in 1946, with roughly 300 sharks landed in the first year (Phillips, 1948; Roedel and Ripley, 1950; Thomas, 2004; McFarlane et al., 2009). Approximately 200 sharks were landed in each subsequent year until fishing activity was suspended in 1950, again due in part to a decrease in shark numbers (Squire, 1967; CITES, 2002; McFarlane et al., 2009). In Western Canada, the basking shark was considered a nuisance and subjected to a culling effort by government agencies due to its frequent entanglement in fishing nets (McFarlane et al., 2009). Approximately 1,000 sharks were killed by eradication, entanglement, and sport fishing in Pacific Canadian waters between 1945 and 1970 (McFarlane et al., 2009). The overexploitation of basking sharks likely contributed to population declines in multiple locations by the mid- to late-1900s (e.g., Squire, 1990; Sims et al., 2005a; Southall et al., 2005; McFarlane et al., 2009; Witt et al., 2012). In the ENP specifically, systematic surveys, sightings reports, and catch data all indicate that since the mid-1900s, observations have decreased from thousands of individuals per year to few, if any (Squire, 1967, 1990; Baduini, 1995; McFarlane et al., 2009; Dewar et al., 2018).
Targeted fishing for basking sharks in the ENP ended decades ago (McFarlane et al., 2009; Dewar et al., 2018), and protective measures for the species were established locally and globally starting in the 1990s. Among these, the basking shark is now listed under Appendix II under the Convention on International Trade in Endangered Species (CITES, 2002). In addition, basking sharks are listed as endangered globally (International Union for the Conservation of Nature [IUCN], Rigby et al., 2021) and, for the ENP population, endangered in Pacific Canadian waters (COSEWIC, 2007). In the United States, the National Oceanic and Atmospheric Administration (NOAA) designated the basking shark as a Species of Concern in 2010, although the program has since been discontinued. Basking sharks are also a prohibited species in the Pacific Fisheries Management Council (PFMC) Highly Migratory Species Fisheries Management Plan (PFMC, 2018).
In some areas throughout their range, basking sharks appear to be responding well to protective measures. For example, basking sharks are still sighted regularly in the North Atlantic (e.g., Witt et al., 2012; Miller et al., 2015; Gore et al., 2016). Though sharks occur in fewer numbers than had been observed prior to the establishment of targeted fisheries (Southall et al., 2005), some studies (i.e., Witt et al., 2012) suggest a potential population recovery in this region. In contrast, there is no documented increase in sightings in the ENP, although analyses are limited by the lack of systematic data collection.
Evaluating the status of the basking shark population in the North Pacific is difficult due to multiple data gaps. While modeled estimates of the population size suggest that less than 1,000 individuals may remain in the ENP (McFarlane et al., 2009), stock structure has not been determined (McFarlane et al., 2009; Dewar et al., 2018), rendering stock assessments impossible. Potential sources of mortality are also unquantified. Though some threats have been mitigated, basking sharks are vulnerable to a range of gear types, particularly gillnets, and they have been incidentally taken in coastal and high-seas fisheries (Bonfil, 1994; Darling and Keogh, 1994; McKinnell and Seki, 1998; Larese and Coan, 2008; Sandoval-Castillo et al., 2008; McFarlane et al., 2009; Dewar et al., 2018). Additionally, given the high cost of their fins (Magnussen et al., 2007), there is strong motivation to retain any landed sharks. Finally, long-term, systematically collected datasets are not available for recent decades. These considerable data gaps also preclude formal stock assessments (Mieras et al., 2017).
An additional challenge to the management of basking sharks is the lack of knowledge on habitat use. Basking sharks are known to exhibit high interannual variability in occurrence, but the forcing mechanisms behind this are not known (Jordan, 1887; Dewar et al., 2018). Such information is critical to differentiate whether variation in occurs due to changes in population size or in movement patterns and distribution because of environmental change. Understanding habitat is also necessary to develop methods (e.g., dynamic ocean management; Hazen et al., 2018; Abrahms et al., 2019a; Blondin et al., 2020) to avoid ship strikes and incidental capture by reducing overlap between vessels and basking sharks. Furthermore, identifying the environmental drivers of basking shark movement patterns can help forecast potential changes in habitat quality and hotspot location associated with climate change. There is a considerable amount of data in the North Atlantic indicating that both biotic and abiotic factors (e.g., sea surface temperature, plankton density, frontal activity) affect basking shark presence and behavior (Berrow and Heardman, 1994; Sims and Quayle, 1998; Cotton et al., 2005; Witt et al., 2012; Siders et al., 2013; Hoogenboom et al., 2015; Miller et al., 2015; Austin et al., 2019). However, few studies on this topic (e.g., Squire, 1990; Baduini, 1995; Dewar et al., 2018) exist in the Pacific.
The aim of this study is twofold: (i) to compile recent and historical data to re-examine temporal trends in basking shark sightings and school size over time using the most up-to-date information, and (ii) to determine the environmental factors that affect basking shark abundance and distribution in the ENP. We primarily focus on the California Current Ecosystem (CCE), which runs from the southernmost point of Baja California, Mexico to Washington, United States. With sightings data collected from 1962 to 2018, our analysis uses species distribution models to assess the impact of environmental factors hypothesized to predict basking shark presence (sea surface temperature, climactic oscillations, and chlorophyll concentration), in addition to spatial (latitude and longitude) and temporal (month and year) trends in occurrence. Species distribution models can also offer insight into whether the decline in sightings in the CCE could be driven by declining suitability in environmental conditions. Additionally, because important behaviors like feeding, mating and social interaction have been proposed as other mechanisms driving coastal basking shark aggregations, we examine variation in aggregation size over time. We conclude by highlighting ongoing gaps in our knowledge of the ENP population (i.e., population demographics and behavioral information) and offer suggestions to address these areas.
Materials and Methods
Sightings Data
Basking shark sighting information along the west coast of the United States was compiled by NOAA from a variety of sources, including NOAA aerial surveys, fisheries data, tagging and research efforts, and public observations. It is important to note that for all data sources, sharks were only sighted when near the surface. Sightings were defined as a single report of any number of sharks observed in given location and time point. We divided the dataset into two categories: sightings obtained via NOAA systematic aerial surveys (hereafter “systematic survey data”), and those that were reported opportunistically (hereafter “non-systematic data”) by other means (Supplementary Figure 1).
Most shark sightings (402/624) were reported during the NOAA systematic surveys, which took place from 1962 to 2004 (Figure 1). During this time, commercial aerial fish spotters flew along the southern and central California coast to estimate tonnage of coastal pelagic fish species such as sardine (Sardinops sagax). Surveys were conducted in a block design, each block covering a 10-arcminute squared area, or 8 × 10 nautical miles (Caruso et al., 1983). There were over 20,000 flights conducted; however, not all pilots reported basking sharks. It was unknown whether this was intentional on behalf of those pilots or due to basking shark absence during their flights. Consequently, we only included data from pilots who had reported a basking shark at least once and accounted for potential variation between pilots in our models (see analyses below). Due to pilot turnover, our dataset was limited to years prior to 1997. The systematic survey sampling method also provided information on school size and basking shark absence, from blocks in each flight that were surveyed in which no sharks were recorded (26,655 absences).
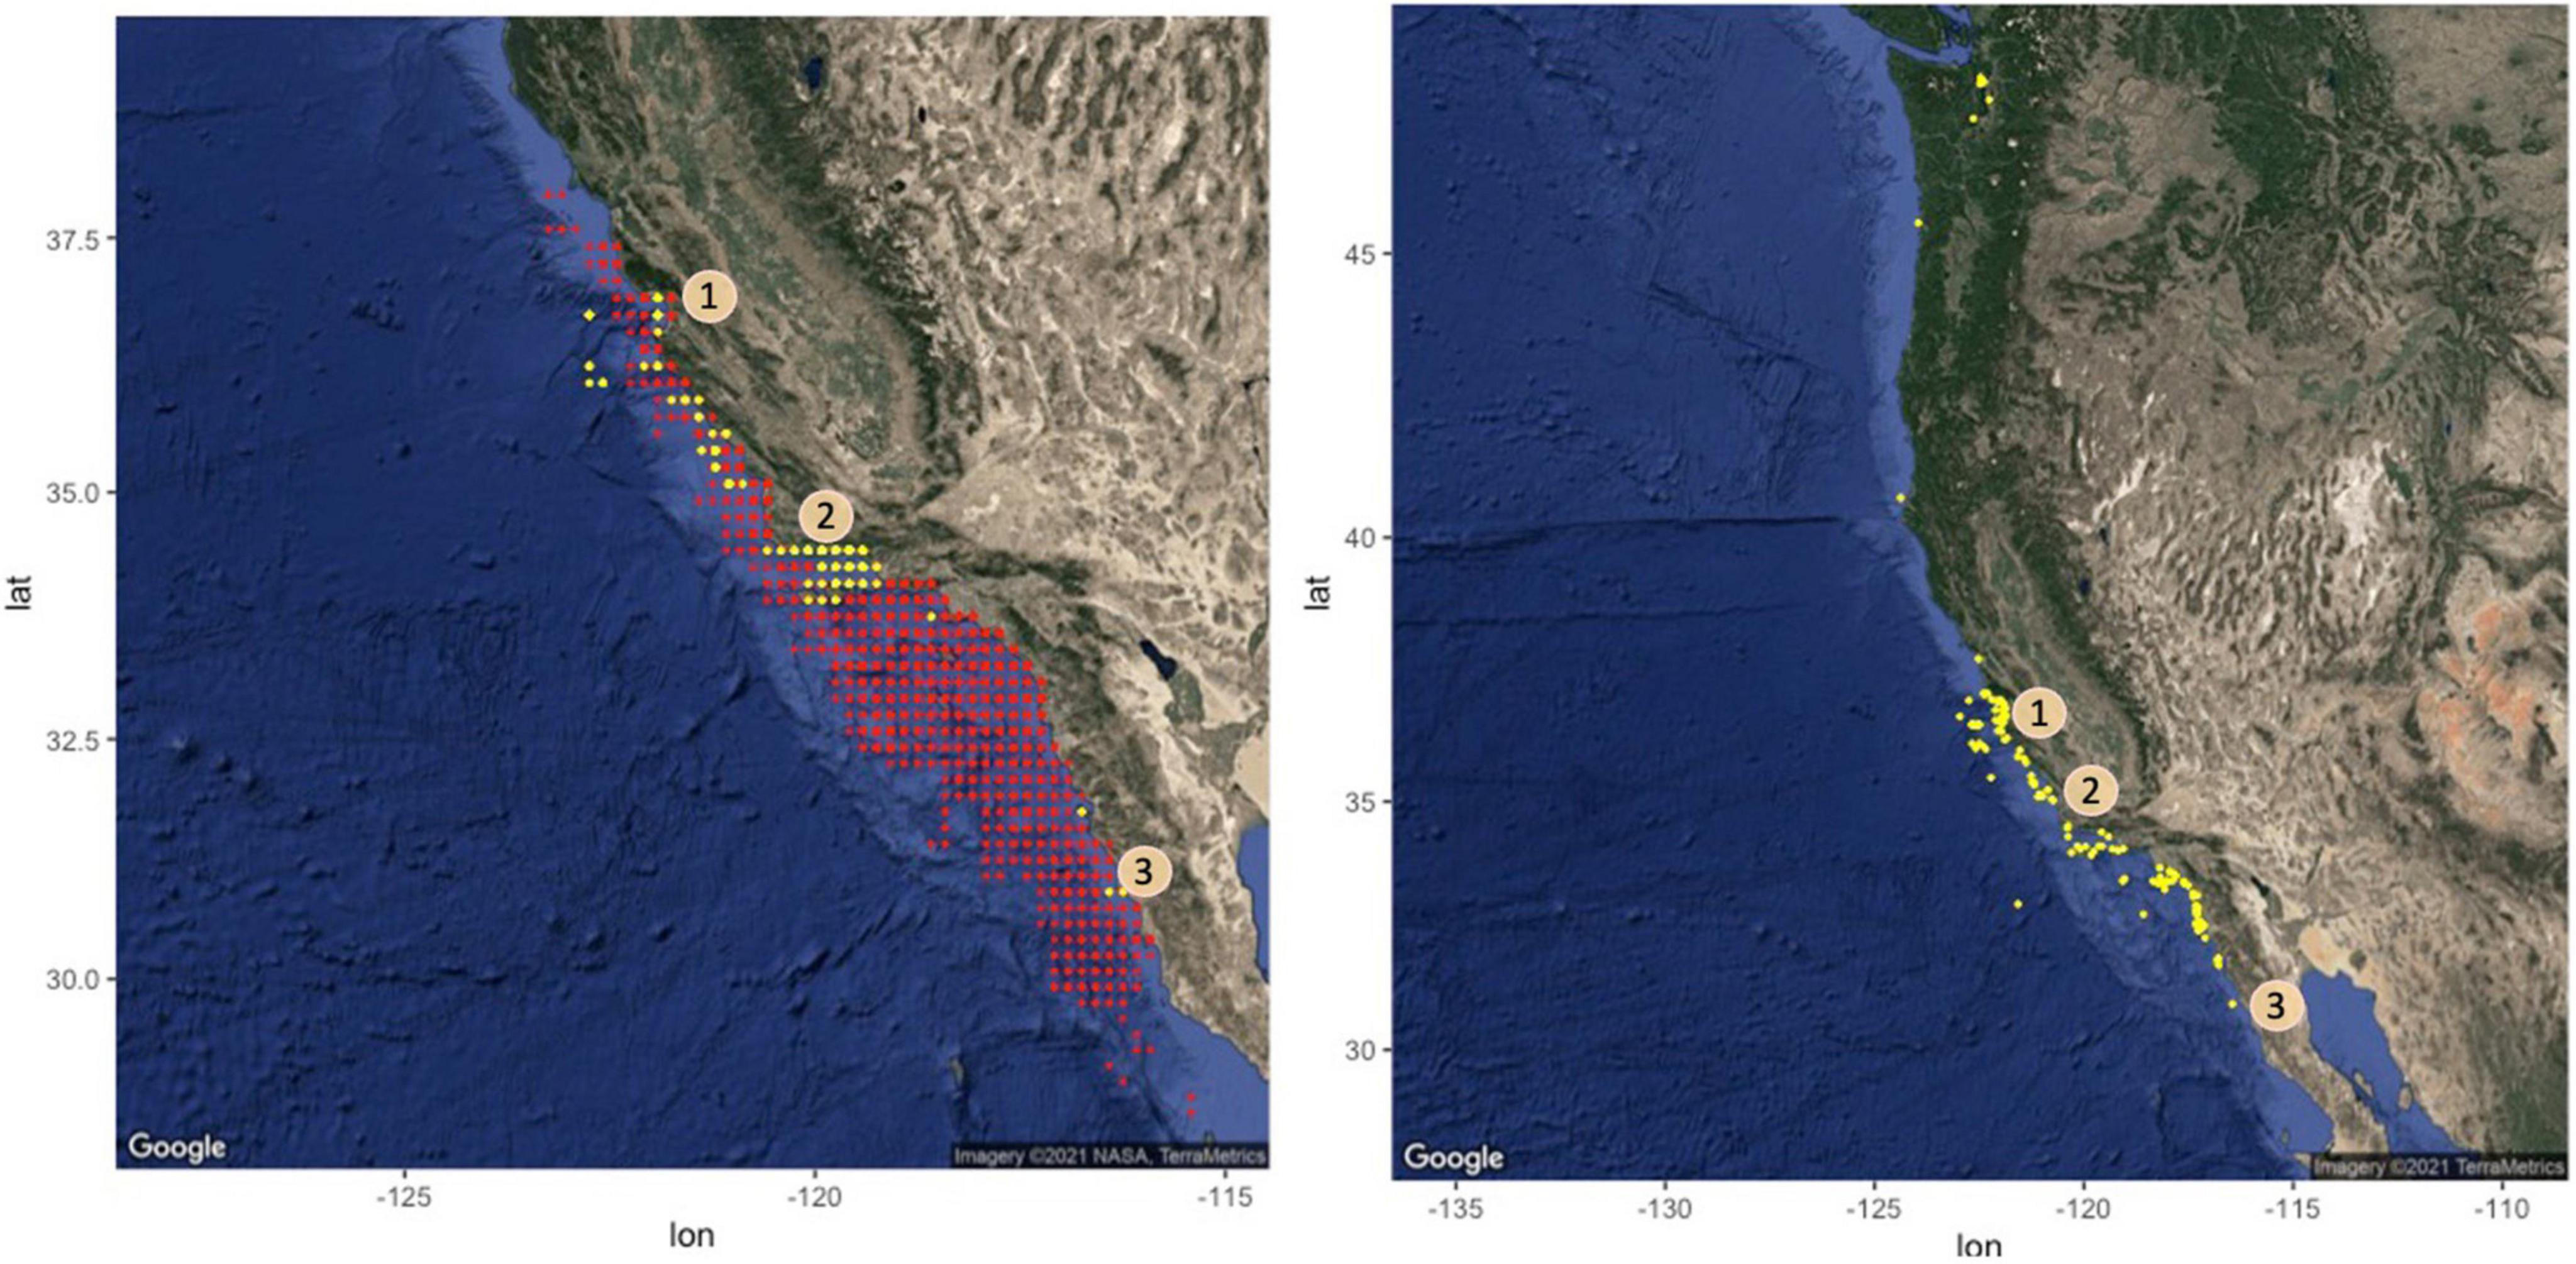
Figure 1. Maps of sightings data collected from 1962 to 2018, from systematic surveys (left; 1962–1997) and non-systematic data (right; 1973–2018) along the western coast of the United States and Mexico. Presences are denoted in yellow. Those above 46° latitude were observed in the bay near Seattle, WA (United States). Sightings from drift gillnet records have been excluded in this figure because of NOAA confidentiality policies. Centroids of blocks where sharks were not found, based on systematic surveys by pilots who had reported a basking shark at least once, are marked in red. Numbers indicate shark hotspots identified in both this and previous studies, in (1) Monterey Bay, (2) Santa Barbara, and (3) Baja California.
In addition to systematic survey data, other instances of basking shark sightings (222/624) were collated by NOAA from 1973 to 2018 (Figure 1 and Supplementary Figure 1). These were reported from tagging efforts (n = 20), gillnet observer records (n = 51), leatherback sea turtle (n = 8) and porpoise aerial surveys (n = 15; Forney et al., 2014), public sightings records (e.g., the Spot-A-Basking Shark program by the Pacific Shark Research Center; n = 58) and other NOAA reports (n = 70). The aerial surveys in particular (Forney et al., 2014) offer the most direct comparison to the systematic survey data given the similarity of methods. These sea turtle and porpoise surveys reported basking shark presence and school size from 1990 to 2013, beyond the systematic survey period. Notably, corresponding absence data were not available for any non-systematic observations. For our analysis we generated pseudo-absences in R for each presence in this subset of the data in a 10:1 ratio, using the randomPoints function in the dismo package to conduct random background sampling of the spatial extent (Hijmans et al., 2017; R version 4.0.2; R Core Team, 2020). However, given the wide variation in sampling techniques, this subset of the data was primarily used for model evaluation (see below) and to allow for further exploration of temporal trends in sightings.
Most sightings in the systematic and non-systematic data (n = 621/624) included information on number of sharks observed, which were binned into categories (solitary, 2–10, 11–50, 51–100, and 101–500 sharks) to quantify changes in aggregation size. For reports with multiple individuals sighted, we then calculated the mean group size per decade. We compared the values for the first and last decades of the systematic survey data in which sharks were sighted (1960 and 1980) and the last decade of the non-aerial survey data (2010).
Predictor Variables
Fine- and broad-scale environmental predictors selected for our analysis were chosen based on previous studies. At a fine-scale, predictors included sea surface temperature (SST) and surface chlorophyll a (chl-a) concentration (Squire, 1990; Cotton et al., 2005; Witt et al., 2012; Siders et al., 2013). Water temperature is known to drive patterns in abundance and distribution (Brown et al., 2004; Payne et al., 2016). Satellite surface chl- a approximates phytoplankton abundance, and is often used as a proxy for ocean productivity and thus surface feeding conditions for basking sharks and other planktivorous species (Curtis et al., 2014; Miller et al., 2015; Austin et al., 2019). In the CCE, prior studies suggest that surface chl-a concentrations are highly correlated with both egg production and the abundance of lipid-rich adult Calanus pacificus (e.g., Håkanson, 1987; Mullin, 1994; Nickels and Ohman, 2018), an herbivorous copepod that is the preferred prey of basking sharks in this region (Baduini, 1995). As many of our observations pre-date the satellite era, we used the Hadley Centre Sea Ice and Sea Surface Temperature data set (Rayner et al., 2003) to estimate SST at sampled locations, calculated monthly at 1-degree spatial scale from 1870 to near present. Additionally, because consistent ocean color observations are only available starting in the late 1990s, we created a climatology of surface chl-a for each month at each spatial coordinate from 1997 through 2019. Monthly values were calculated from re-analyses developed through the Ocean-Color Climate Change Initiative (OC-CCI) using multiple ocean color sensors (Sathyendranath et al., 2019). We were therefore able to determine whether sightings were related to specific locations and season(s) where surface chl-a has been high on average during the ocean color satellite era, although we could not assess surface chlorophyll conditions for most basking shark sightings (as they were from years prior to 1997). Both environmental variables were obtained from NOAA’s ERDDAP server (Simons, 2020), and extracted using the rerddapXtracto package (Mendelssohn, 2020).
Broad-scale cues included predictors for prevailing climatic oscillations in this region: the El Nino-Southern Oscillation index (ENSO), North Pacific Gyre Oscillation (NPGO: Di Lorenzo et al., 2008) and Pacific Decadal Oscillation (PDO: Mantua and Hare, 2002). All were reported by month and year.
To account for other spatiotemporal processes not captured by the selected environmental data, we included spatial (latitude, longitude) and temporal (month, year) predictors. In addition, because existing literature is currently contradictory with respect to the seasonality of basking shark sightings (Squire, 1967; Dewar et al., 2018), we added an interaction term to account for variation in monthly sightings by decade within our dataset. Given the possibility that localized cues (e.g., SST or chl-a) drove changes in sightings over time, we also calculated the mean SST by decade at all sighting locations to supplement the results of our models (Supplementary Figure 2). We were unable to calculate mean chl-a by decade prior to 2000 given that its values were calculated from a climatology.
Analysis
We created three species distribution models using general additive mixed models (GAMMs) to determine the effect of our selected predictors on basking shark presence, using the mgcv package (Wood, 2017). We used a cross-validation approach to assess the performance of each GAMM (Table 1a). Because the systematic survey data constituted most of our data and included both presences and true absences, this subset of the sightings data was used for cross-validation. Comparing model performance allowed us to determine whether our selected environmental predictors alone were sufficient to predict basking shark presence, or whether unmeasured spatiotemporal processes were also important (Brodie et al., 2020). In all models, (1) environmental variables (fixed effects) and Pilot identity (random effect) were included as predictors, (2) chl- a was fourth-root transformed before analysis to reduce skewness, and (3) all variables were smoothed using a thin-plate regression spline, except for month where a cyclic cubic regression spline was used. Model 1 also included year, latitude and longitude as an interaction term, and month as a fixed-effects variable, which was allowed to vary by decade to assess changes in seasonality over time (Table 1a). Model 2 only included year as an additional predictor.
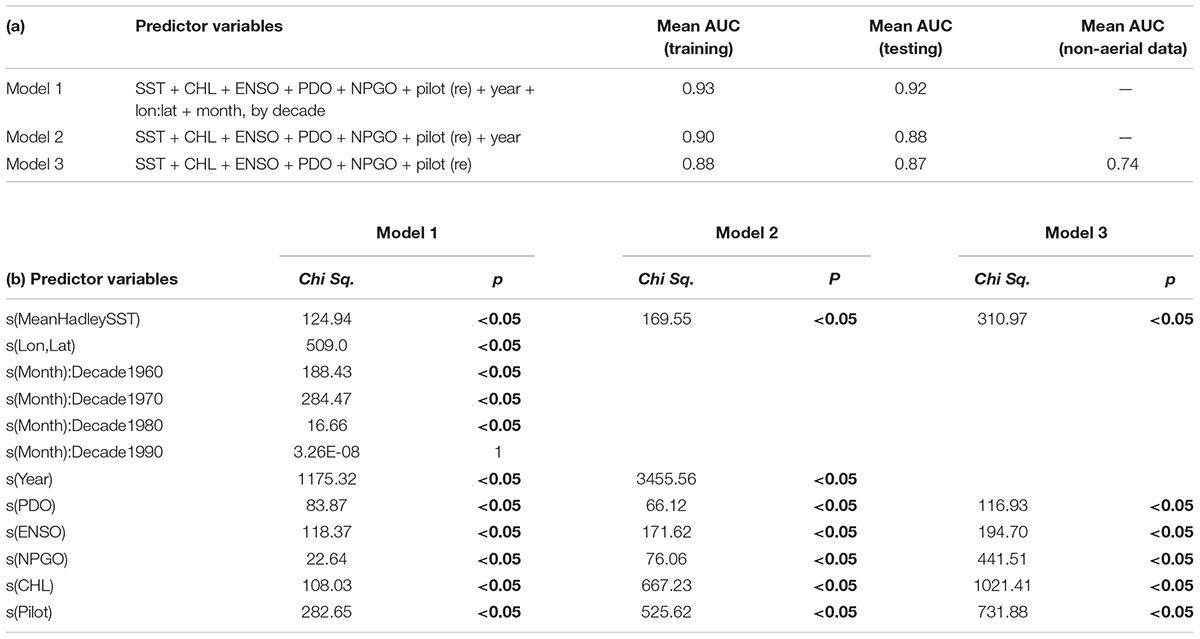
Table 1. (a) Summary table of general additive mixed models [GAMMs] used in testing and training. (b) Output summary of GAMMs, including p-values and chi-square values. Summaries represent an example from one round of testing and training; outputs from all five rounds were similar.
For cross-validation, the systematic survey data was divided into an 80% training/20% testing split. To account for the strong class imbalance due to the large proportion of absences, we up-sampled the training data such that presences represented 8% of the dataset (versus ∼1.5% before up-sampling). We assessed model skill using the Area Under the Receiver Operating Characteristic (ROC) curve: (AUC) (Hanley and McNeil, 1982; Runcie et al., 2019). The AUC metric varies between 0 and 1, with a value of 0.5 indicating that the model predictions were no better than random, and a value of 1 indicating that the model is capable of distinguishing presences and absences perfectly (Elith et al., 2006; Parisien and Moritz, 2009; Runcie et al., 2019).
We calculated the mean AUC on the withheld 20% of data across five different, random testing/training splits to determine model performance for each GAMM (Table 1a). For each split, we also evaluated Model 3 on the non-systematic data, which included presences and pseudo-absences. Because Models 1 and 2 contained year and decade terms, they were unable to predict beyond the temporal constraints of the systematic survey data to which they were fitted (1962–1997); Model 3 excluded these terms and consequently could evaluate the non-systematic data through 2018. We accounted for the Pilot predictor by assigning a single pilot ID to the entirety of the non-systematic data, selected from a pilot who had a relatively high positive observation rate and an average number of records throughout the systematic survey period.
Results
Basking Shark Records
The complete dataset included 624 shark sightings. Sightings were reported throughout the year, from 27.75° N to 49.82° N and –125.66° W to –115.42° W, and spanned more than five decades (1962–2018). There were eight pilots in our systematic survey data who reported basking sharks. They varied in the number of flights conducted by month and year, which we accounted for using the Pilot identity term in our GAMMs. Collectively, flights from these pilots covered every year from 1962 to 1995, and again in 1997 (Supplementary Figure 3). Flights also generally took place from February to November, with a greater number during the fall months (August to November). Out of the 7,076 flights conducted, 262 of these reported basking sharks, with the last presence observed in 1988. There was a peak in the total number of sharks sighted per year and the mean number per flight between 1960 and 1970, as well as a second smaller peak around 1980. Shark sightings were comparatively low in the 1970s and the mid to late 1980s (Figure 2). Over this time, sightings were reported primarily in the late fall through early spring (September through June; Supplementary Figure 4). The maximum total number of sharks sighted in a year was nearly 4,000 individuals, in 1966. From 1962 to 1988, there were only 5 years of zero shark sightings. However, after 1988, none were reported for the duration of the systematic surveys (through 1997). In comparison, in the non-systematic survey data, there was only 1 report prior to 1988 (in 1973). After 1988, there were 10 years in which no sharks were reported (Figure 3).
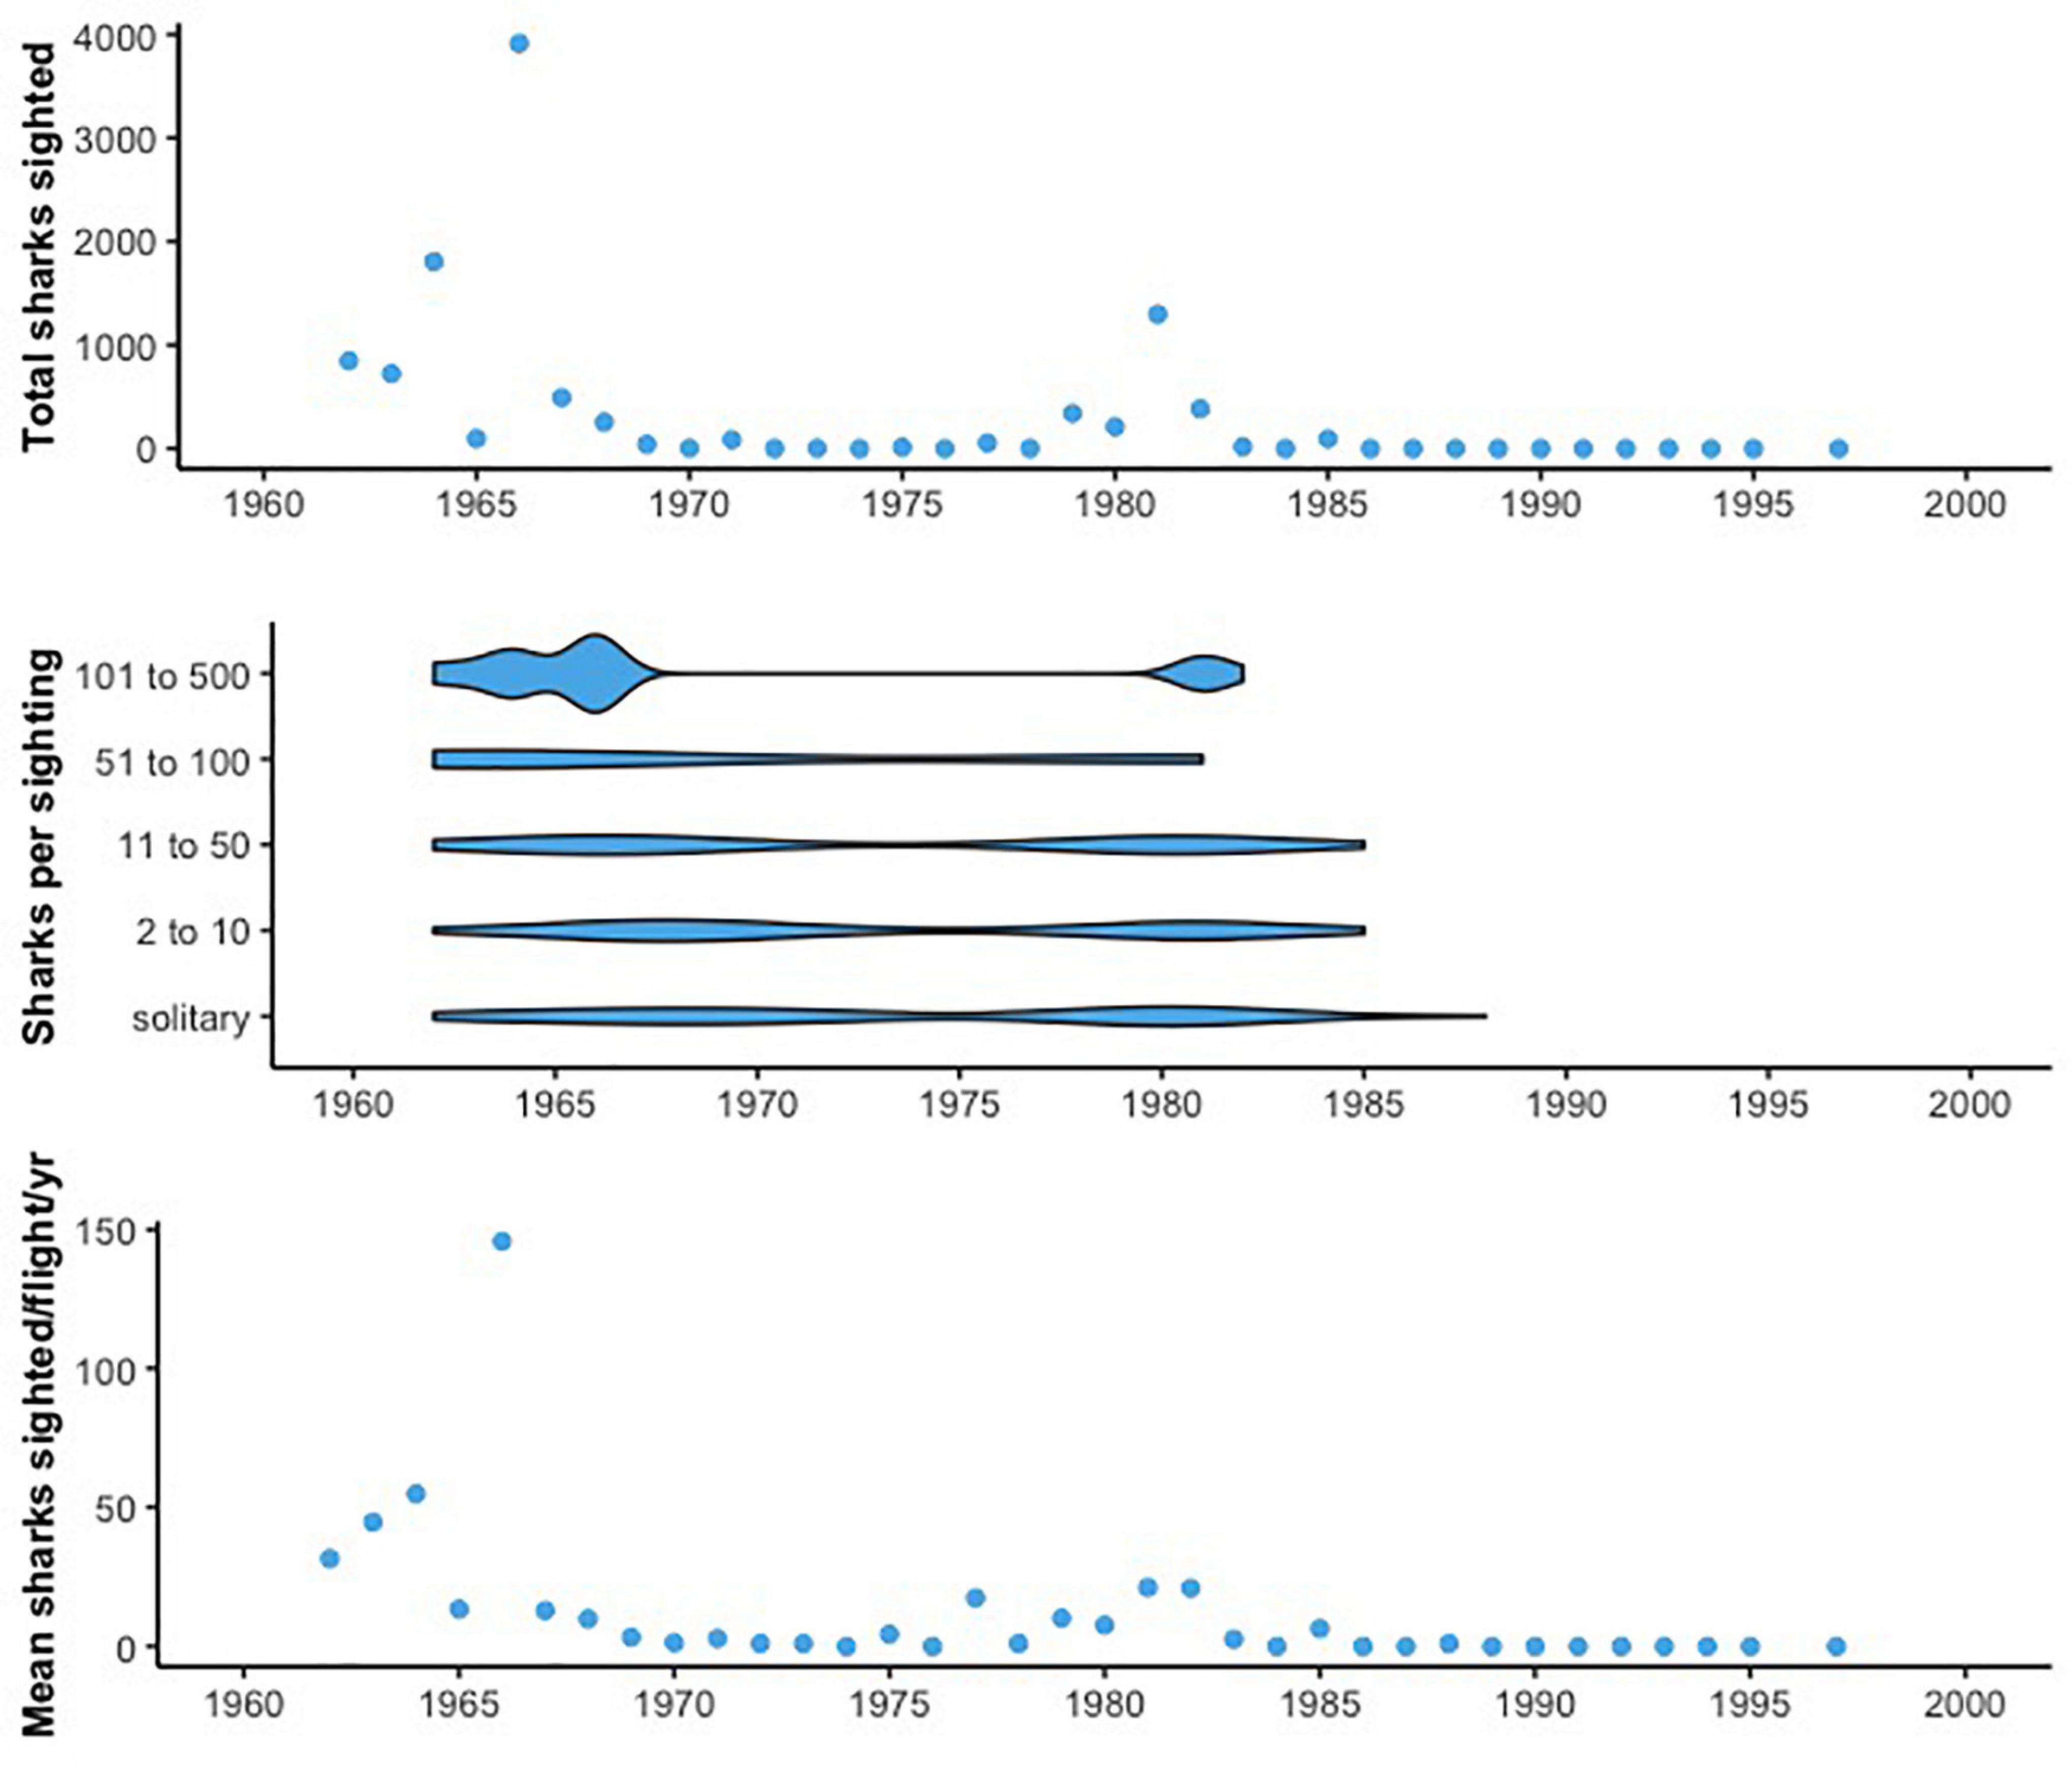
Figure 2. (Top) The total number of sharks sighted based on flights conducted each year in the systematic survey. Peaks in sightings are evident from 1962 to 1985, with few sightings after that time. (Middle) Number of sharks per sighting in the systematic survey data, with each sightings report binned according to the size of the aggregation (solitary individuals, 2–10, 11–50, 51–100, and 101–500). Larger aggregations are present primarily prior to 1983, with smaller groups of sharks reported after that year. (Bottom) Mean number of sharks sighted per flight per year during the systematic survey period, showing similar trends to the total number of sharks sighted each year but accounting for variation in the number of flights conducted.
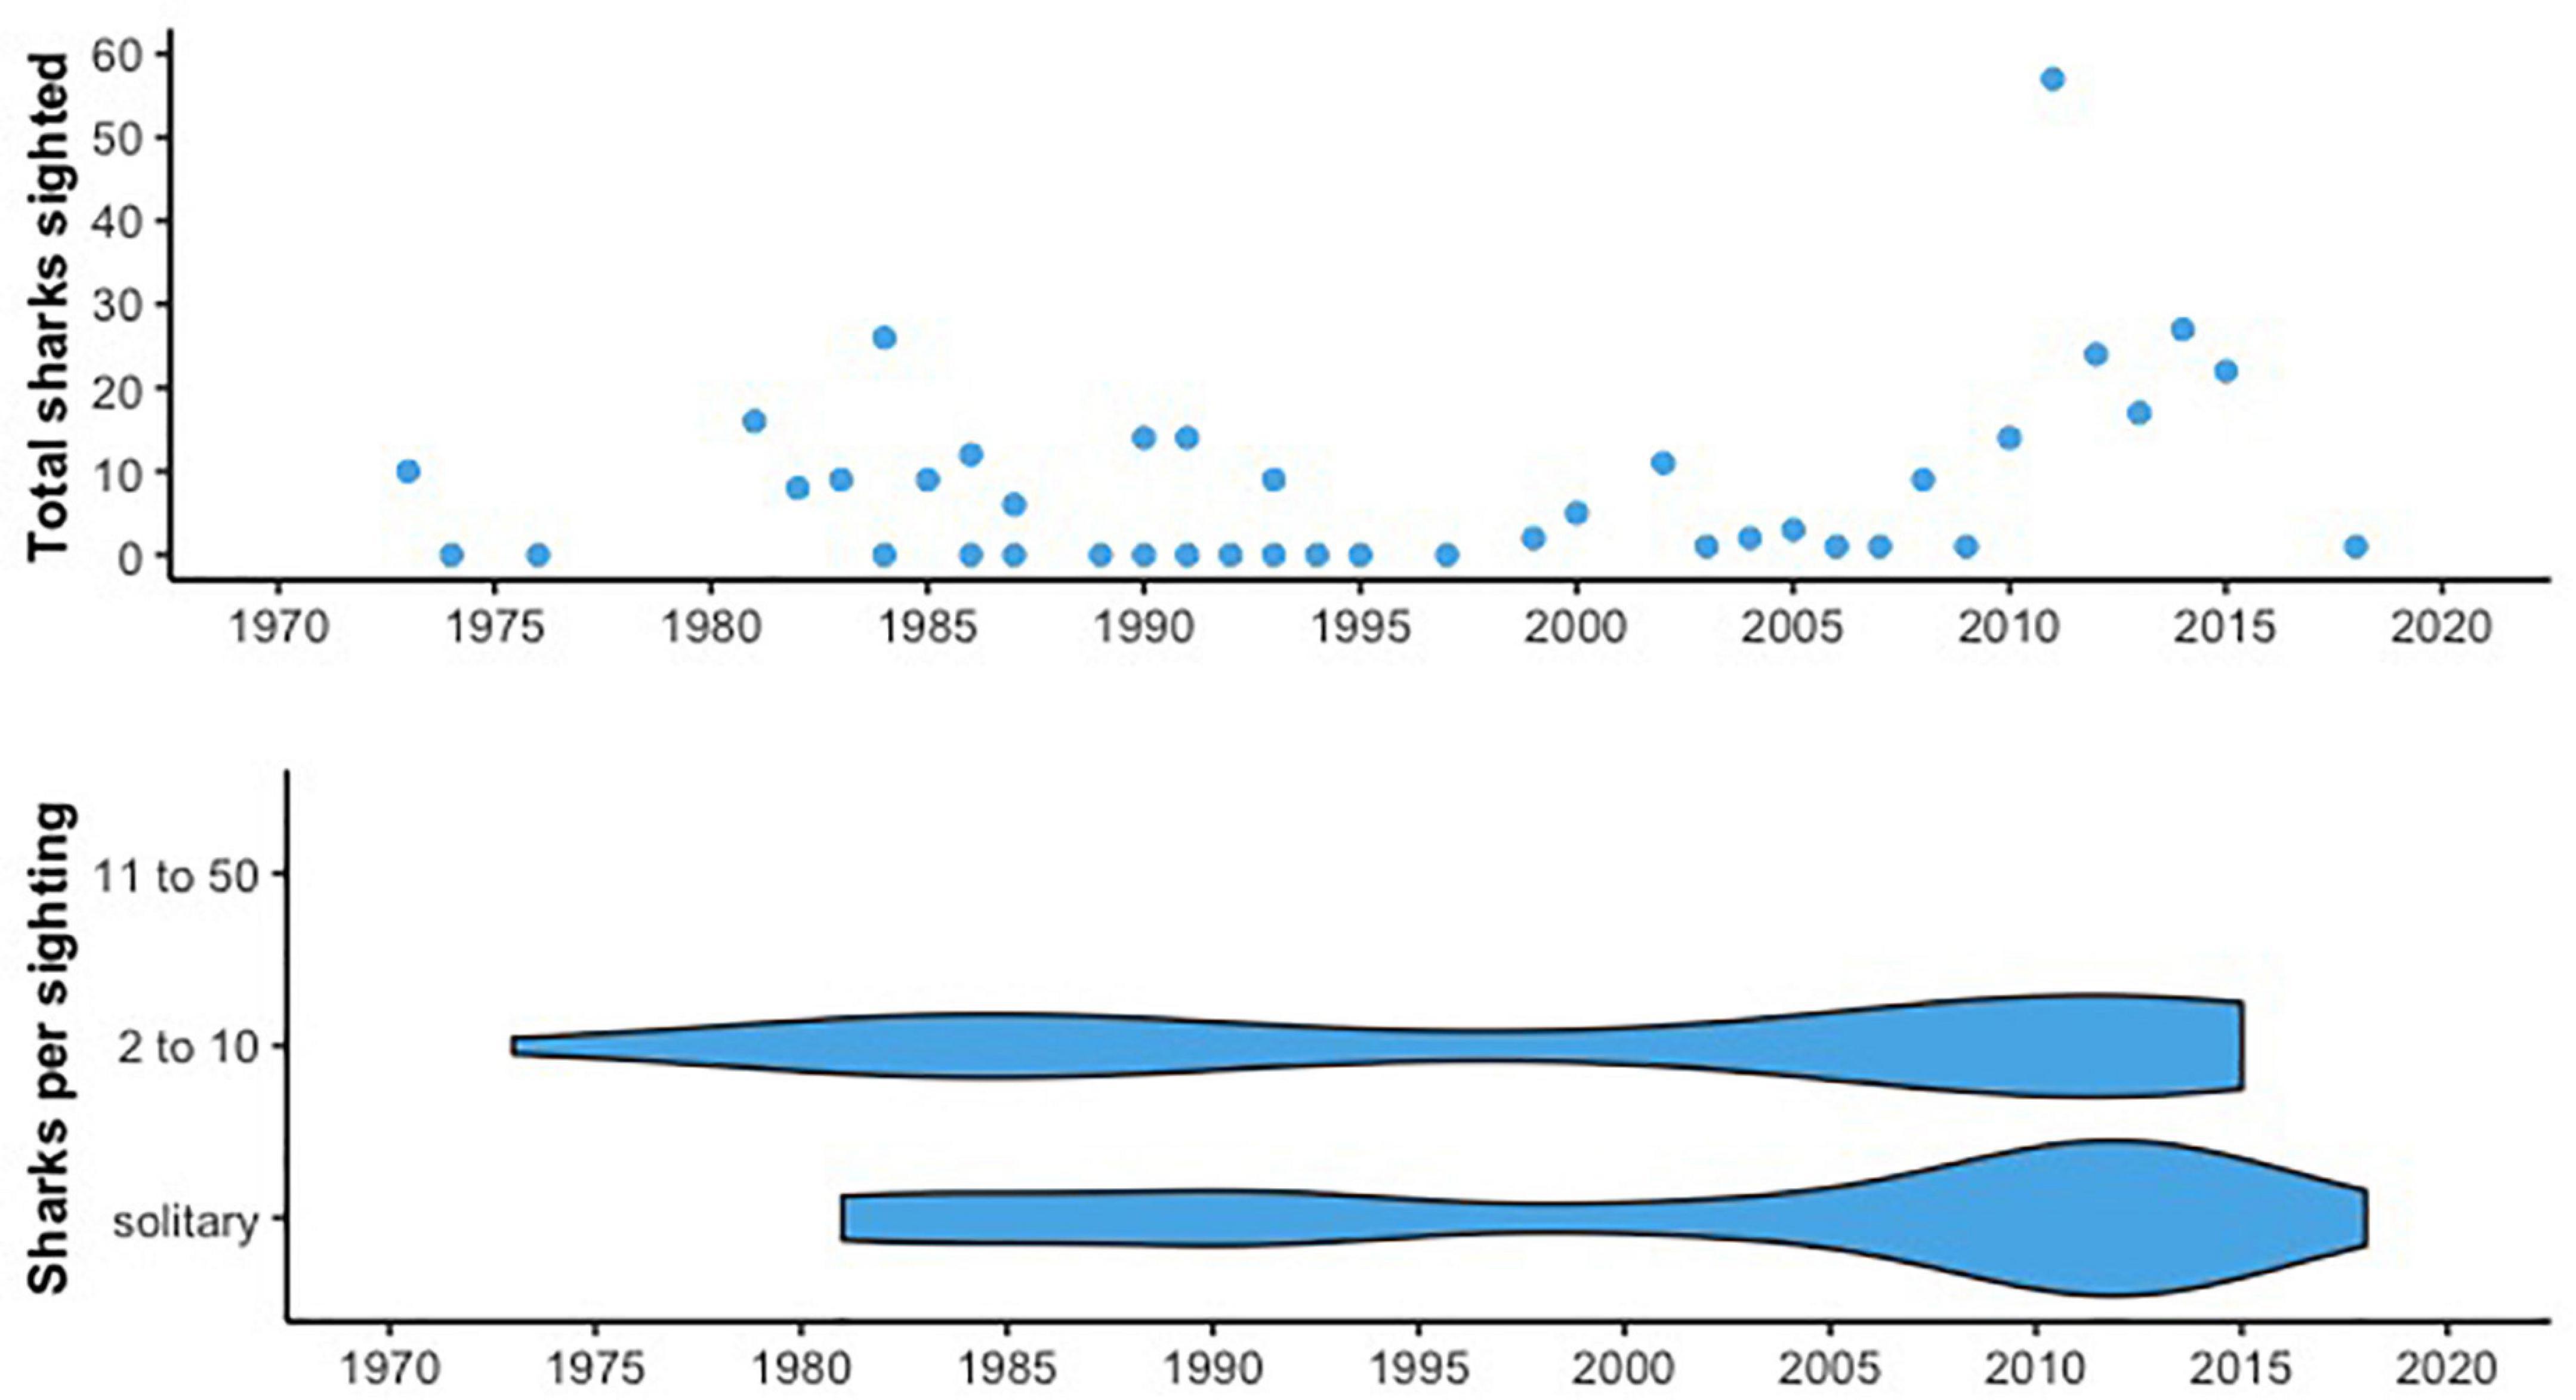
Figure 3. (Top) The total number of sharks sighted opportunistically each year in the non-systematic survey data. Slight peaks in sightings occur between 1980 and 1990, and between 2011 and 2018. (Bottom) Number of sharks per sighting, binned as in Figure 2. All records report at most. All records report at most 10 sharks.
Most non-systematic sightings were reported during the 2010s (n = 114), and the relatively high number of sharks observed during this time provides some opportunity for comparison with the systematic survey data. The maximum number of sharks reported each year was 57 individuals in 2011, from a combination of public sightings schemes, NOAA reports, and tagging efforts (Figure 3 and Supplementary Figure 1). Non-systematic sightings were distributed throughout the CCE, clustered near Monterey Bay, Santa Barbara, and Baja California (Supplementary Figure 5). Interestingly, there were eight sightings (7%) off Oregon and Washington as well. Sightings took place primarily in summer months (April through October), with a few sightings in the late fall and early winter (Supplementary Figure 4). For example, in the 2010s, 94% of sightings were from April-September with a peak of 25% in May. Though the non-systematic data was not used to build the GAMMs, the mean SST in shark sighting locations remained relatively consistent across decades in this data from 1990 to 2018 (mean SST: 14–16°C; Supplementary Figure 2), although temperatures overall ranged from 11.4 to 19.8°C. We were only able to calculate chl-a values at shark sighting locations starting in the 2000s, but mean chl-a was relatively consistent between the 2000s and 2010s (mean: 1.55 and 1.27, respectively) with a wide range across individual sightings, from 0.27 to 4.84.
Of the 624 records, 621 reported school size (402 for the systematic data and 219 for the non-systematic data). Our systematic surveys reported a variety of aggregation sizes, from two individuals to up to 500. However, sightings in the high-number bins (11-50+ sharks) decreased dramatically in the late 1980s (Figure 2). Between the 1960s and 1980s, there was a ∼58% decline in the mean size of basking shark aggregations in the systematic survey data (57.2 to 24.0 individuals). In the non-systematic data we examined, there were no shark aggregations larger than 10 (Figure 3). This includes the leatherback sea turtle and porpoise surveys for which, of 20 sightings from 1990 to 2013, only two reported more than one shark with aggregations of 2 and 3 individuals. For comparison, only 33% of reports in the systematic survey data were of solitary sightings.
Species Distribution Models
Our models performed well on both testing and training datasets derived from the systematic data, with AUC values ranging from 0.87 to 0.93 (Table 1a). The model containing the largest number of potentially relevant predictors (Model 1) emerged as the top model in terms of average skill (AUC training = 0.93, AUC testing = 0.92). This suggests that our predictions were improved slightly by accounting for unknown spatiotemporal processes. When Model 3 was applied to the non-systematic data, it performed moderately well with a predictive power of 0.74.
All three models contained Pilot as a random-effects variable and the same environmental variables. The effects of nearly all variables (other than month-decade) were statistically significant (p < 0.05; Table 1b). However, the relative influence of these predictors differed based on the model AIC’s sensitivity to the loss of each term (Supplementary Figure 6). The Pilot variable was consistently highly influential, suggesting that observer bias influenced some of the patterns in our data. Each model also generally predicted a higher probability of basking shark presence with increased chl-a concentration and cooler temperatures (<14–15°C; Figure 4), although chl-a appeared to be a stronger predictor in Models 2 and 3, while SST was a weak predictor in all models. When we also examined the mean SST values by decade at shark sighting locations, there was significant variation among sightings (11.4–19.8°C). However, we found relatively little difference between the mean SST values across decades (range mean SST: 14.3 – 15.8°C; Supplementary Figure 2) and no trend over time. Notably, this is similar to temperatures observed in the non-systematic data (2010–2018; mean SST: 15.8°C, Supplementary Figure 2).
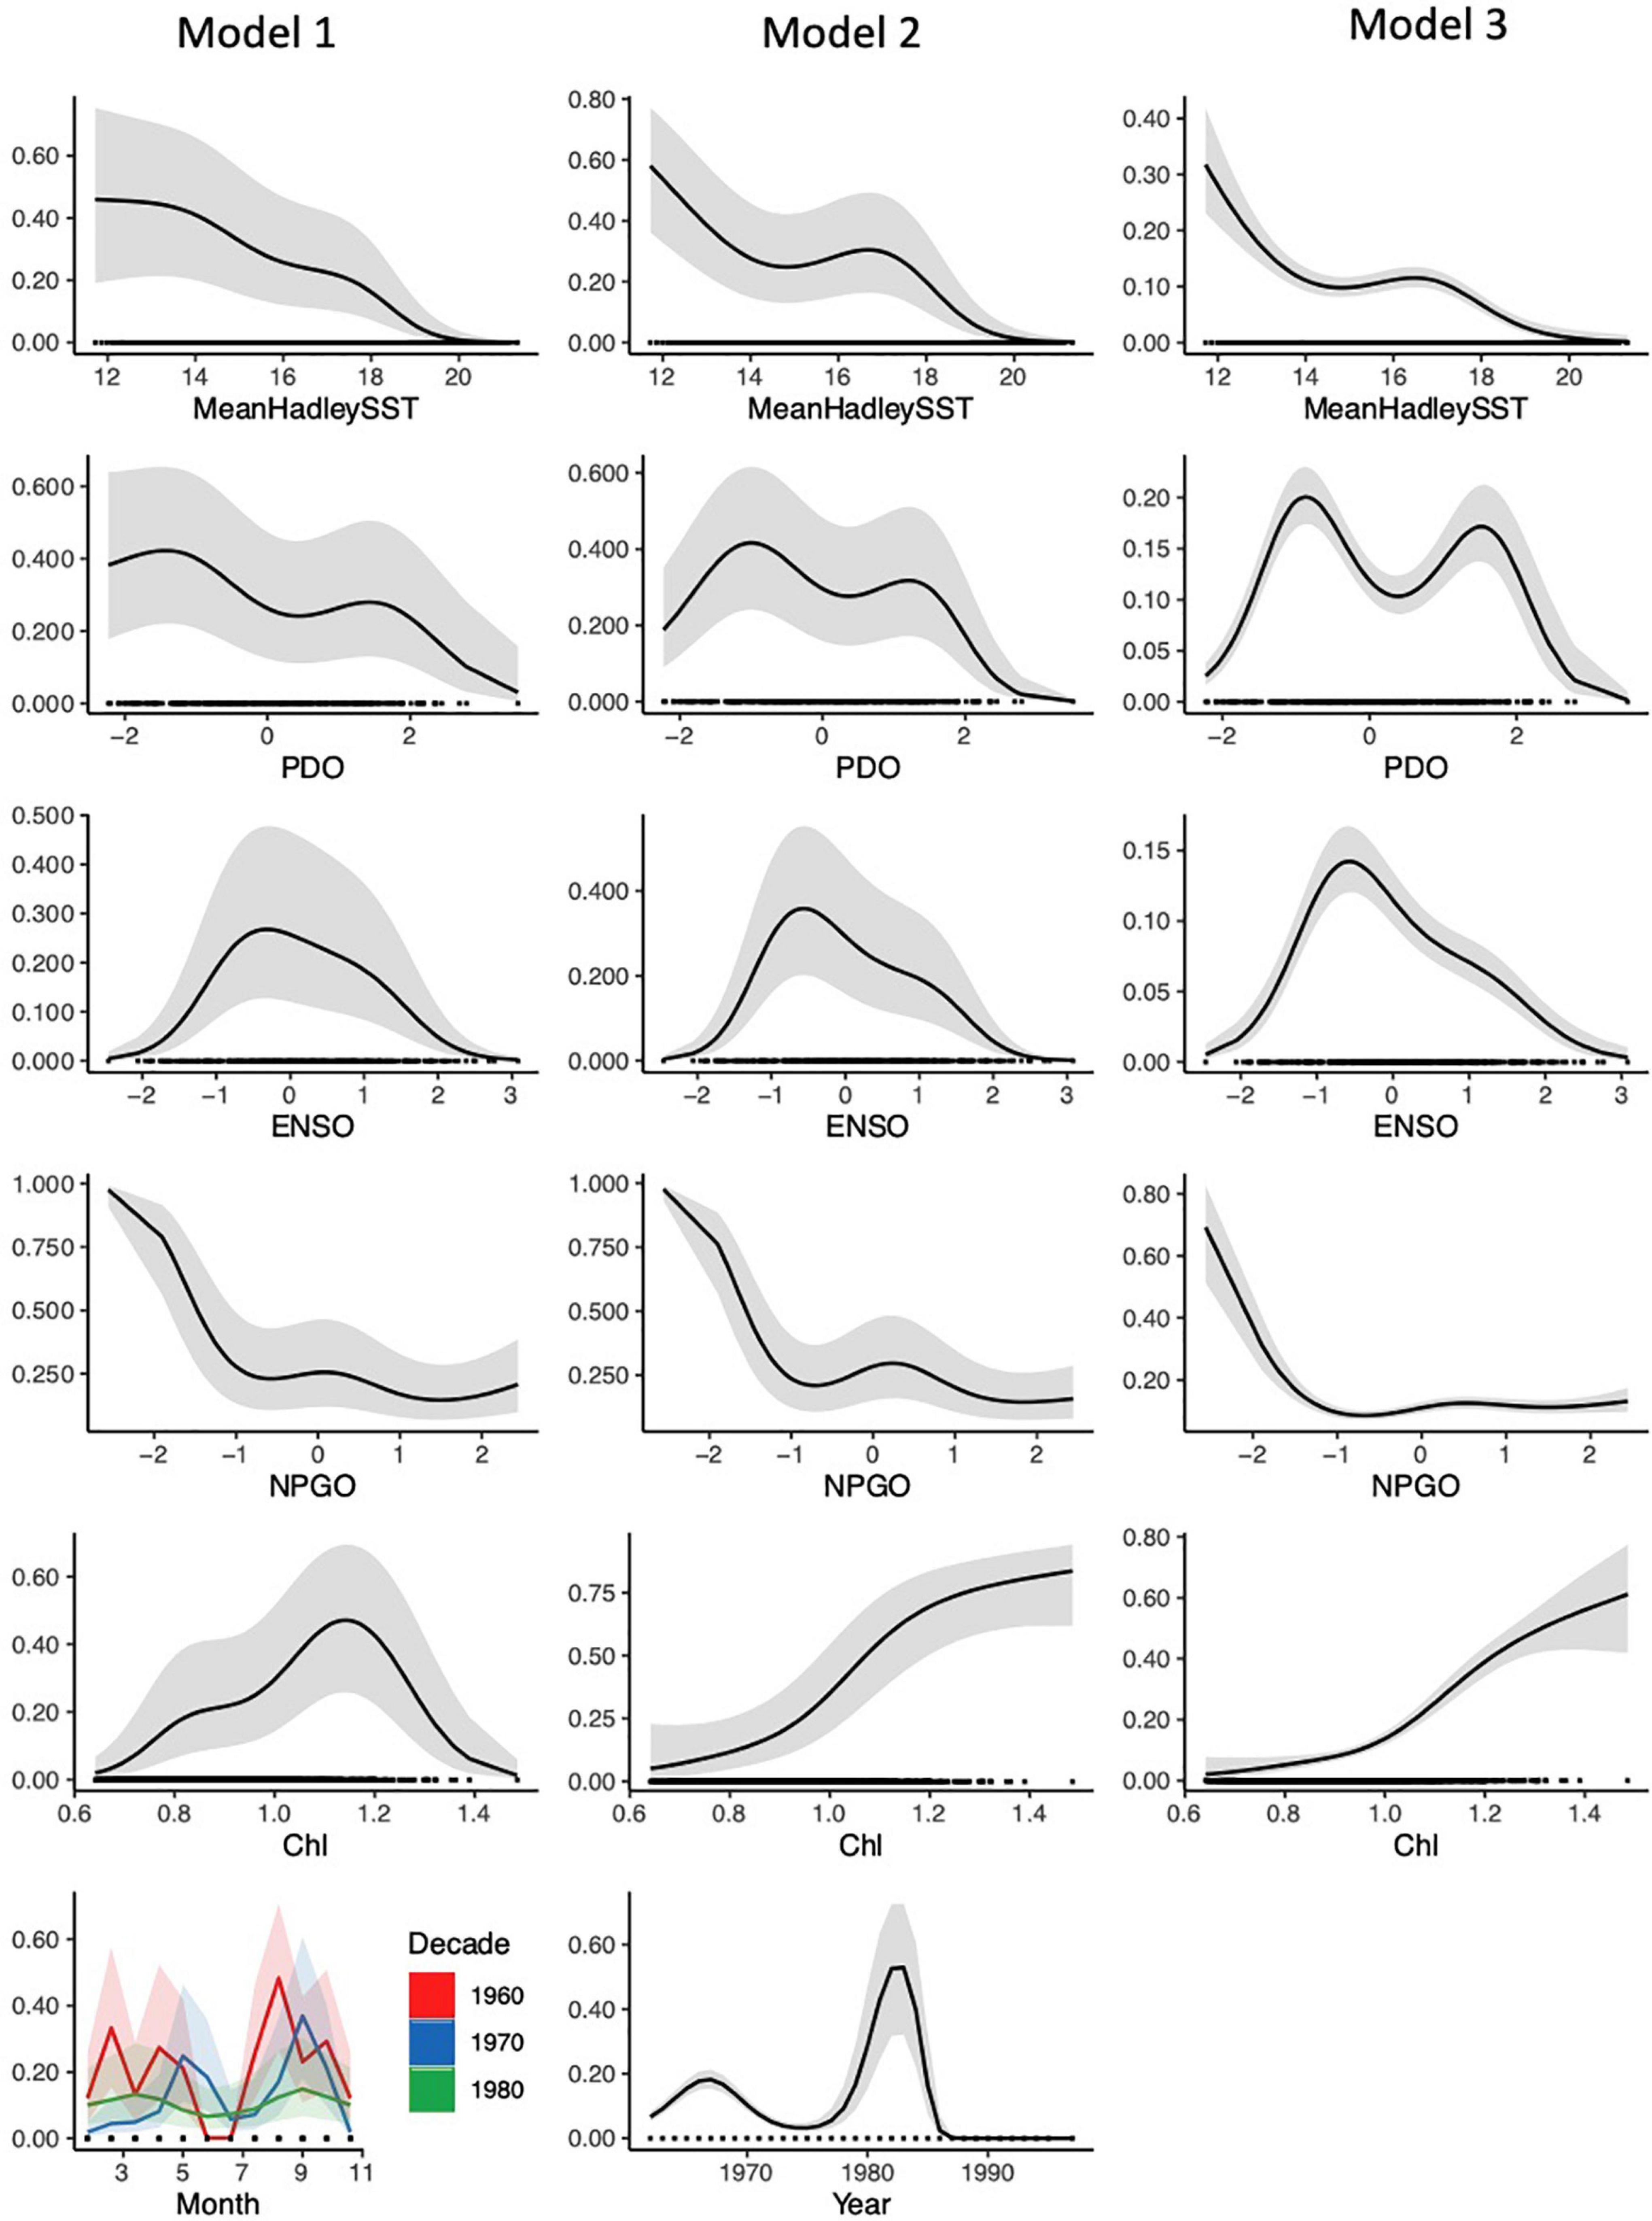
Figure 4. Partial response plots for the temporal and environmental predictors from each of the three models, fitted to the systematic survey data (parameters for each model are fully outlined in Table 1). The y-axis represents predicted probabilities of basking shark sightings. There was little variation in each of the five iterations of model testing and training. This is a representative example of one iteration.
Any shift in SST should also capture some of the influence of broader scale cues, such as PDO, ENSO, and NPGO. For PDO, our models showed a bimodal pattern with an increased probability of occurrence at slightly negative and positive values. The probability of basking shark occurrence was also higher at neutral to negative ENSO values, and at negative NPGO values (Figure 4). Yet as with SST, these climatic oscillations had moderate to weak influence on our models compared to other predictors (Table 1b and Supplementary Figure 6).
Model 1 allowed for the examination of year, decade, month, and latitude/longitude. All were highly influential predictors in this model compared to the environmental variables (Figure 4, Table 1b, and Supplementary Figure 6). There was a significant seasonal and monthly change in sightings probability, and patterns of seasonal variation changed between decades. Specifically, in the 1960s, Model 1 predicted a higher probability of basking shark sightings in mid-spring and late summer. This shifted to early summer and late fall in the 1970s. In the 1980s there was lower variability between months, though a slight increase in probability in early spring and late fall (Figure 4). Across all decades, there was a lower probability in the summer months.
In additional to environmental variables, Model 2 also examined the effect of year on basking shark sightings and found that it affected sightings probability significantly (Table 1b) and was a moderately influential predictor (Supplementary Figure 6). There was a high probability of occurrence from the late 1970s to the early 1980s. From 1975 to 1983 the probability increased from an average of 0.31–0.68. After that time, probability decreased to 0 for the rest of the systematic survey period (Figure 4). These results, combined with those from Model 1, indicate that there were additional spatial and temporal processes affecting sightings probability that were unaccounted for by the other environmental predictors. Chl-a was also a strong predictor in Model 2 (Table 1b and Supplementary Figure 6).
In terms of spatial distribution, across the entire aggregated systematic survey period (1962–1997), all models also predicted a higher probability of shark sightings directly along the coastline from Monterey Bay down to Santa Barbara, as well as off northern Baja California (Figure 1 and Supplementary Figures 7, 8). When we mapped the model predictions by decade, we found that this distribution varied over time. Specifically, all our models predicted a higher probability of basking shark sightings in the Monterey Bay area during the 1960s (Figure 5A and Supplementary Figure 8a). During the 1970s, basking sharks were predicted to be sighted further south, near Santa Barbara and Baja California (Figure 5B and Supplementary Figure 8b), although there were still a few observations north of Santa Barbara. In the 1980s, the last decade in which a basking shark was sighted in the systematic surveys, the probability of basking sharks sighting increased primarily near the Santa Barbara area (Figure 5C and Supplementary Figure 8c).
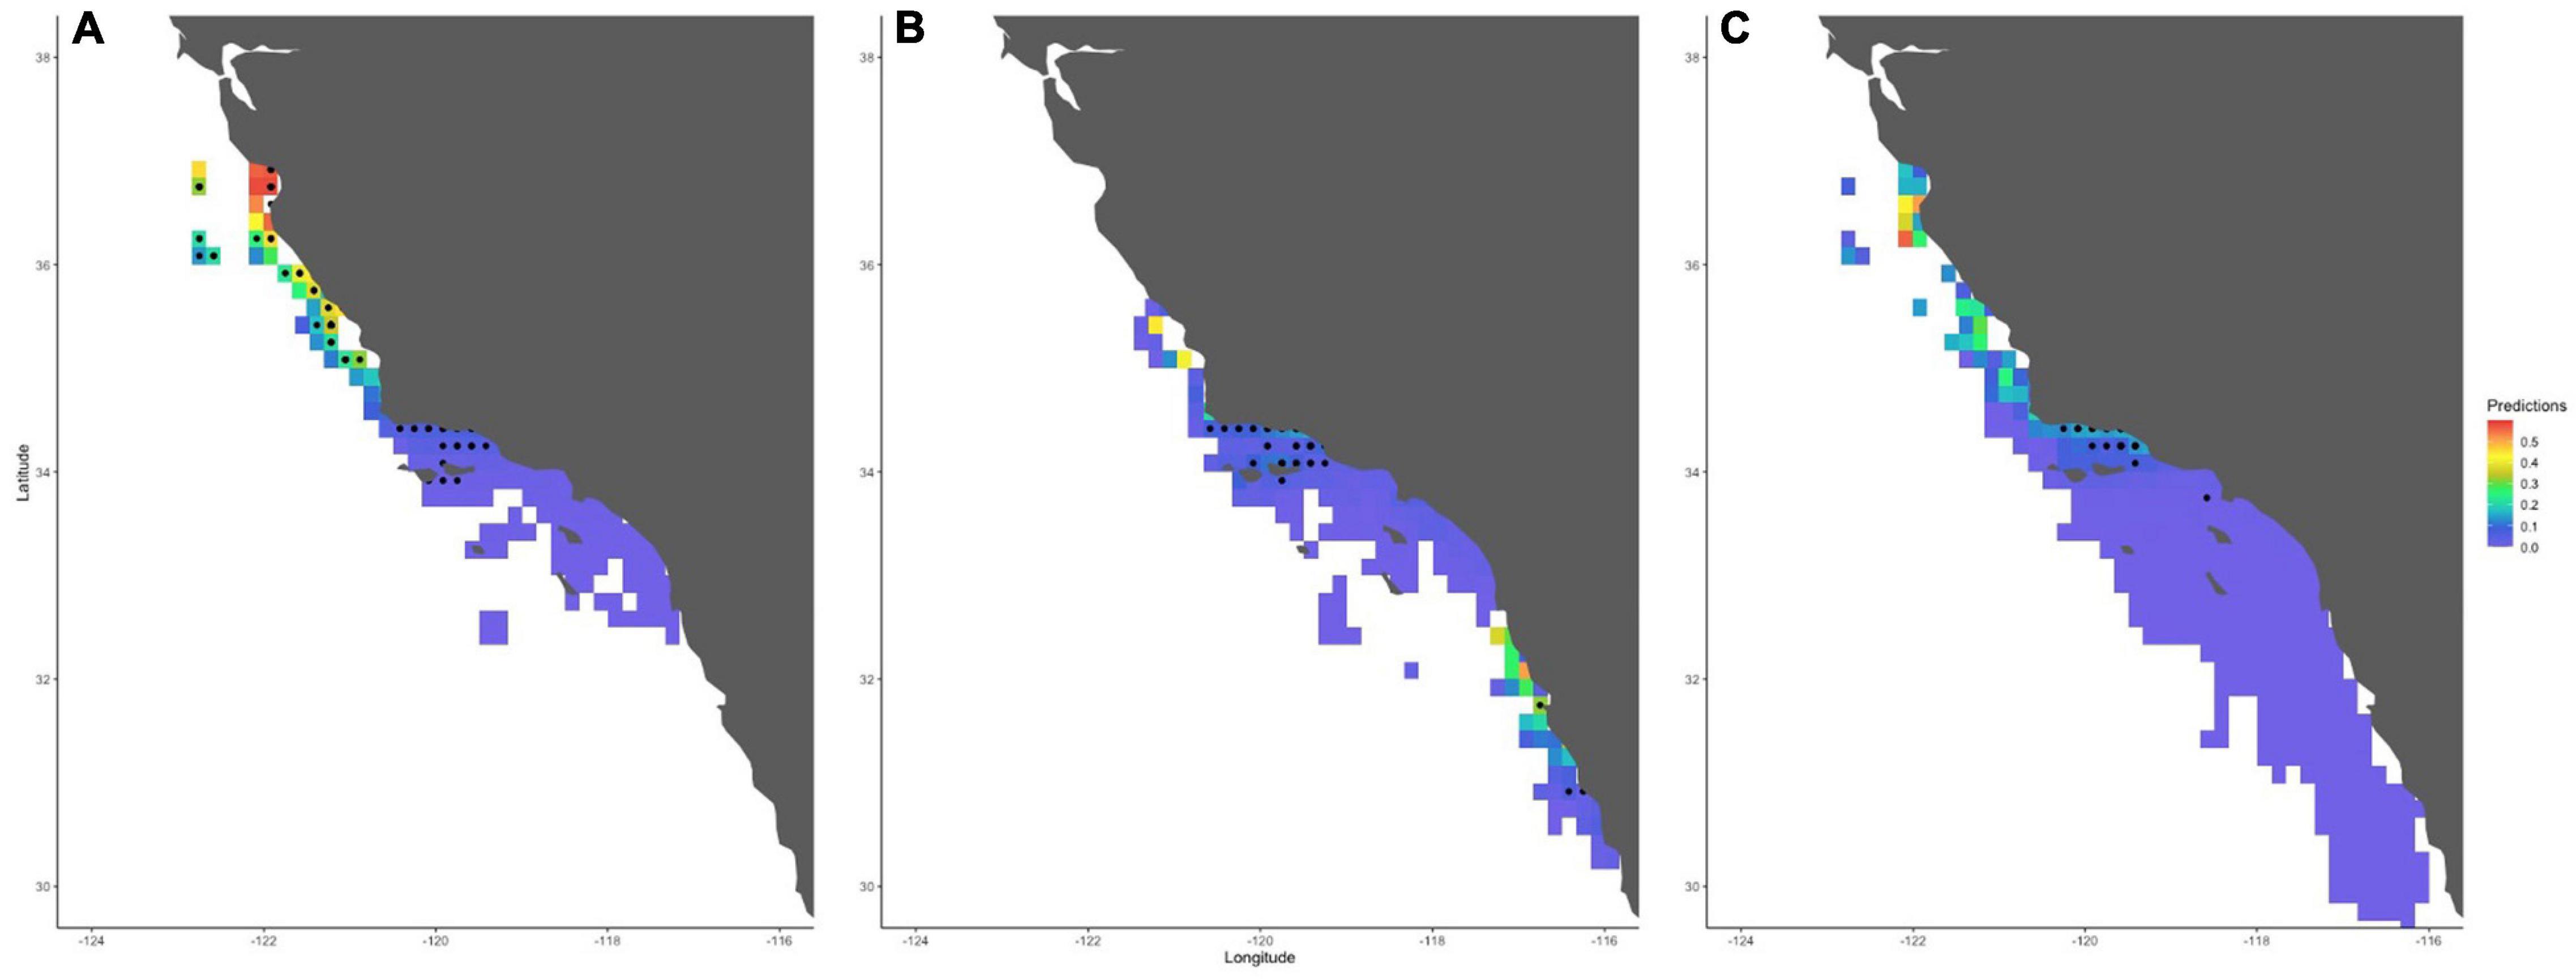
Figure 5. Maps of the western United States and Mexico extending from San Francisco (top of map) to Baja California (bottom of map), showing predicted shark sightings probability from our best-fit model (Model 1) for each decade for which there were presences throughout the systematic survey period (A–C: 1960s, 1970s, 1980s). Black dots represent basking shark presences recorded during the systematic surveys. White represents areas for which there is no model prediction. Maps from Models 2 and 3 can be found in the Supplementary Materials.
Discussion
Published information on the behavior, movement patterns, distribution, and abundance of basking sharks in the CCE is sparse. Using a cumulative analysis of historic and contemporary sightings datasets, we conducted a detailed examination of basking sharks in the CCE. We assessed sightings numbers and school size to determine patterns in basking shark behavior and distribution over time. We also generated the first habitat models for this species in the ENP, exploring the influence of environmental and other spatiotemporal variables on sightings probability.
This research builds on the few studies that have been conducted previously, many of which have also reported a decline in observations. Squire (1967) analyzed log records of aerial surveys conducted in from 1948 to 1950, noting the number of basking sharks and seasonality of sightings in the Monterey area. During this time, basking sharks arrived here in large numbers, with one instance of a reported shoal reaching over 1,000 individuals. In a later paper, Squire (1990) assessed a different set of aerial survey records in the CCE from 1962 to 1985 and found a notable decrease in abundance of sharks observed after 1970. Similarly, based on opportunistic sightings and aerial survey data, Baduini (1995) determined that abundance of basking sharks after 1967 was much less than that observed by fish spotters from 1948 to 1951. In a 2009 report, McFarlane et al. (2009) provided a comprehensive report of sightings trends and historic threats to basking sharks in Western Canada and California, compiling data available up until 2007. These authors also found evidence of a dramatic decline in sightings over time and advocated for further research on the ENP basking shark population.
In addition to examining trends in basking shark sightings, previous studies have also explored potential drivers of seasonal habitat use, though with mixed results. Squire (1967) recorded peaks of apparent abundance in March and October and noted that shark sightings occurred most frequently when temperatures were below 14°C. In a subsequent paper, Squire (1990) reported the same seasonal peaks in sightings during spring and fall in Monterey and Morro Bays. Interestingly, this study also observed that occurrence of sharks was low during periods of high phytoplankton abundance, concluding that residence in the CCE is likely not for feeding. Conversely, Baduini (1995), in a study of foraging ecology, later found that in Monterey Bay, peak shark abundance corresponded to greater zooplankton abundance. Yet here groups of sharks were reported in July and August rather than spring and fall. Similarly, in 2010–2011, Dewar et al. (2018) observed that satellite-tagged sharks left coastal regions in the summer and fall. They also suggested that changes in movement patterns and habitat use were linked to prey availability and oceanography (Dewar et al., 2018). Generally, however, it is important to note that no habitat modeling has been conducted prior to our study. Without information on the environmental drivers of basking shark distribution, it has been difficult to determine the degree to which yearly variation in sightings is due to environmental changes or population-level trends.
Spatial and Temporal Trends
Expanding the temporal scale of previous studies, our analyses confirmed that over the course of less than 50 years (1962–2018), there was substantial change in the number, timing, and spatial distribution of CCE sightings. Consistent with the published reports indicating declines in local basking shark abundance throughout the ENP (Squire, 1990; Baduini, 1995; McFarlane et al., 2009), we found that the number of sharks sighted yearly declined by the 1980s and remained low in subsequent years. Moreover, our systematic survey data showed a corresponding decrease in the size of basking shark aggregations from 1962 to 1997. This trend apparently continued in the non-systematic data through 2018, which included 23 observations from aerial surveys for leatherback sea turtles and porpoises that were comparable methodologically to our systematic survey data (Forney et al., 2014). Between 1990 and 2013, these surveys recorded sightings of mostly solitary individuals.
We also found that seasonality shifted over time. Our model predictions indicate that sightings were generally bimodal in the 1960s to the 1980s with the timing of these peaks varying each decade, although primarily in the spring and fall in the CCE. Given that the peak of sightings in Western Canada historically occurred during the summer, it was hypothesized that the ENP population spent May through September further north. However, this pattern has evidently changed. Based on our non-systematic data and other studies, basking shark sightings occurred primarily during summer months starting in the 1990s (Baduini, 1995; Dewar et al., 2018) with the majority of records from the late spring through early fall. This is also the season they are sighted in the temperate waters of the North Atlantic (e.g., Sims et al., 2003; Doherty et al., 2017; Johnston et al., 2019; Dolton et al., 2020). It is possible that these recent changes were biased to some degree by season; for example, more people may undertake recreational activities on the water during the summer. Regardless, such a marked seasonal difference in CCE sightings is noteworthy.
The spatial patterns of sightings in our data suggest that coastal areas from Monterey Bay to Baja California remain important habitat for basking sharks in the CCE (Squire, 1990; Baduini, 1995; Dewar et al., 2018). Our models predicted a slight change in spatial distribution from 1960 to the 1990s. Sighting probability was higher near the Monterey Bay area in the 1960s and shifted further south to Baja California and Santa Barbara by the 1980s. However, non-systematic sightings in the 2000s, as well as tagging data, were distributed throughout the study region, from just north of Monterey to Baja California, with some hotspots near Monterey Bay, Santa Barbara, and off the coast of San Diego (Supplementary Figure 5). Interestingly, there did not appear to be a corresponding change in temperature associated with this shift; though SST was highly variable, the mean temperature across decades remained relatively consistent in both datasets (Supplementary Figure 2).
Based on hotspot formation along the shelf and slope in the Atlantic (e.g., Southall et al., 2005; Gore et al., 2016; Lieber et al., 2020), basking shark habitat appears similar across ocean basins and is likely linked to forcing mechanisms that concentrate prey, which is known to be critical to successful foraging in filter feeders (Sims and Quayle, 1998; Croll et al., 2005; Doniol-Valcroze et al., 2007; Block et al., 2011; Miller et al., 2015). However, foraging behavior may drive different patterns in vertical distribution by region, season, or individual; for example, reports of basking shark foraging at the surface are widespread (e.g., Sims et al., 2005a,b; Gore et al., 2008; Miller et al., 2015), but some studies also suggest that basking sharks may feed where prey is concentrated at depth (e.g., Siders et al., 2013; Westgate et al., 2014; Hoogenboom et al., 2015; Dewar et al., 2018). Given the limited amount of information available for vertical basking shark behavior in the CCE (i.e., Dewar et al., 2018), it is possible that basking shark distribution shifted more than our results suggest if the sharks were responding to prey fields or other environmental cues below the surface.
Environmental Drivers
The influence of the environment on the distribution and seasonality is challenging to determine, particularly as survey coverage was uneven through time. The consistent significance of our Pilot variable in each model suggests that observer bias played a strong role in influencing the patterns observed in this study. Yet while it is important to consider the impact of observer bias in the interpretation of our results, our analysis nonetheless offers some important environmental insights.
We selected surface chl-a as an indicator of zooplankton density based on previous work on basking shark and other marine zooplanktivore habitat use (e.g., Curtis et al., 2014; Dewar et al., 2018 and others). Consistent with our results, some research has concluded that chl-a positively correlates with basking shark presence in the CCE as well as the North Atlantic (e.g., Baduini, 1995; Witt et al., 2012; Doherty et al., 2017; Austin et al., 2019), though this may depend on the months in which shark presence is examined (Siders et al., 2013). However, other studies have found no such effect (Squire, 1990; Dewar et al., 2018; Austin et al., 2019). For example, Dewar et al. (2018) noted that one tagged individual moved offshore in the CCE even while chl-a remained high, while another did so as chl-a and SST began to decline. There is thus clear variability in the influence of chl-a on basking shark distributions within the CCE and elsewhere. This could be because surface chl-a may only partially capture basking shark feeding behavior, since as mentioned above, basking sharks are also thought to feed below the surface (e.g., Siders et al., 2013; Westgate et al., 2014; Hoogenboom et al., 2015). Even in the CCE, Dewar et al. (2018) speculated that dense aggregations of copepods at 450–500 m near Santa Barbara may be a potential prey source, although most observed sharks still surfaced daily. Our models did not account for any subsurface movement patterns in response to deeper prey fields, and we cannot assume that all basking sharks in the CCE feed primarily at the surface or that basking shark foraging depths have not changed over the course of the study.
In addition to chl-a, SST was also a significant variable in all our models and is likely another key driver of large-scale movement patterns. Basking sharks have been found across a broad range of SST, from 8 to 24°C, with differences in their apparent thermal preference. For example, in Newfoundland and the Bay of Fundy, Lien and Fawcett (1986) and Siders et al. (2013) reported most basking sharks when waters were 8–12°C and 13.2–13.8°C, respectively, while other studies have reported sightings at higher temperatures (e.g., 15–17.5°C; Skomal et al., 2004; Cotton et al., 2005), reaching up to 24°C (Owen, 1984; Dewar et al., 2018). The influence of SST on abundance is also variable, with some studies finding a high correlation (Cotton et al., 2005) and others finding little to none (Hoogenboom et al., 2015; Finucci et al., 2021, respectively), with some evidence suggesting that the importance of SST depends on the month (Siders et al., 2013). For sightings in the CCE, SST has been relatively low and consistent over time (Supplementary Figure 2), despite shifts in seasonality. Squire (1967) also reported low basking shark abundances above 14°C in 1951, and our model results suggested a higher probability of sightings when the SST was less than 14–15°C. This temperature is slightly lower than the mean SST across decades in the systematic survey data (Supplementary Figure 2), likely because randomly generated pseudo-absences were frequently correlated with higher temperatures. However, it aligns with the non-systematic survey data, in which SST fell within a very narrow range (mean SST: ∼15.5°C). Thus, our collective results suggest a higher probability of shark presences at temperatures < 16°C. Yet while SST was a significant predictor of sightings probability in this study, its influence was relatively low (Supplementary Figure 6). The broad range of SST and differences across regions suggest that SST itself may have a lower overall importance than other environmental parameters that covary with SST, such as seasonal zooplankton abundance. Additionally, as with chl-a, SST captures primarily surface ocean conditions, which may not capture the thermal environment driving basking shark movement patterns (Siders et al., 2013).
Finally, we found that the three climate indices (ENSO, NPGO, PDO) were significant environmental predictors in all models though with relatively low predictive value. Other studies (i.e., Witt et al., 2012; Hoogenboom et al., 2015) have shown that climatic oscillations in the North Atlantic (i.e., North Atlantic Oscillation) predict interannual sightings variability of basking sharks, probably due to the effect of NAO on the abundance of dominant prey species. In the CCE, ENSO has been attributed to changes in basking shark sightings, as the peaks in sightings from 1975 to 1981 were reduced after the 1982-1983 El Nino perturbations (Squire, 1990). This is consistent with model results showing a higher sightings probability at negative ENSO values, when temperatures are cooler and productivity in the CCE is higher. In contrast, our model results for NPGO predicted a higher probability of basking shark presence at negative NPGO, which is associated with lower productivity (Harvey et al., 2020). The relationship between PDO and basking shark sightings was challenging to interpret given its bimodal nature. More work is needed to understand the effect of these large-scale phenomena on basking shark abundance in the CCE.
The significance of these collective environmental predictors in our models and studies in other locations portend further change in basking shark space use due to climate change. Given the broad range of SST, the specific temperature may be less important below and above certain thresholds, particularly as basking sharks appear to avoid higher SST by diving to deeper cooler waters (Skomal et al., 2009; Braun et al., 2018; Dewar et al., 2018). Additionally, as with previous studies in the region, we found high interannual variability in the apparent abundance of basking sharks that is independent of environmental conditions in the CCE. Consequently, the distribution of this population is likely influenced heavily by spatiotemporal processes not accounted for in this study, although is possible that the sightings patterns observed were also influenced by declines in basking shark abundance (discussed in more detail below). Future efforts defining the essential habitat for basking sharks in the CCE will need to consider additional, more dynamic variables (Table 2) that better measure factors influencing prey abundance in three dimensions (Baduini, 1995; Dewar et al., 2018). Additional work is also needed to characterize the entire range of this population.
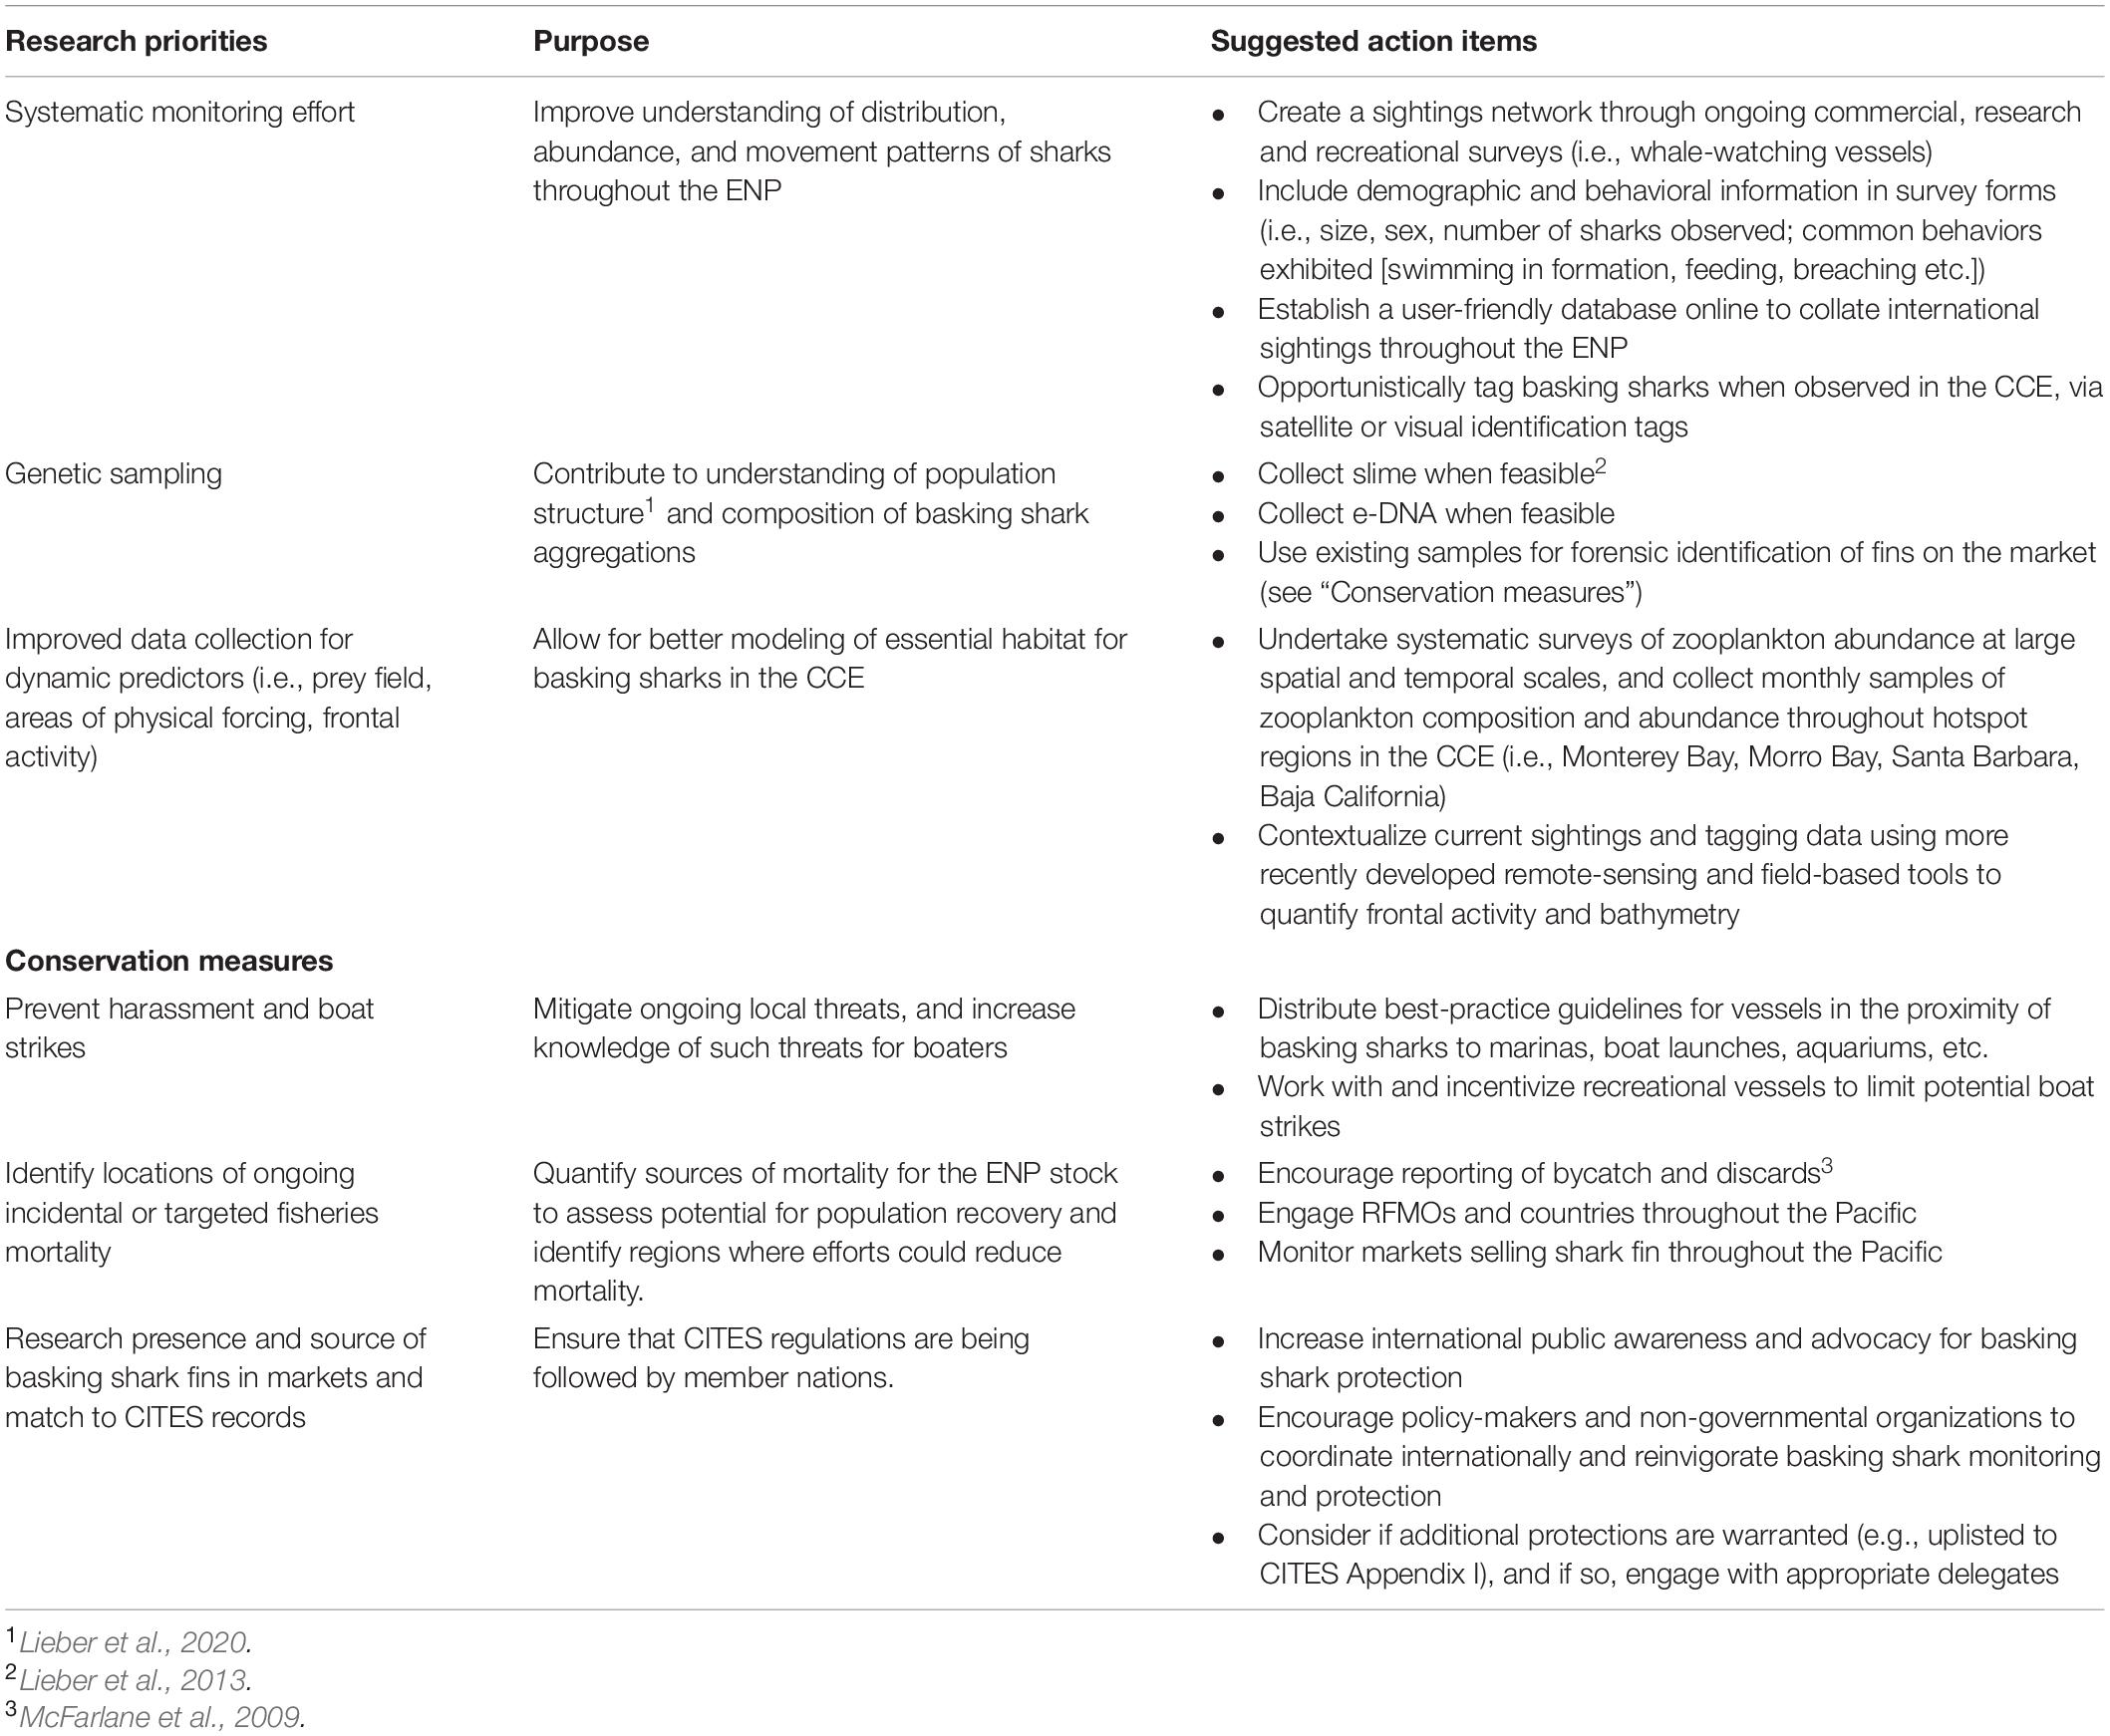
Table 2. Recommendations for future research on and conservation of basking sharks in the CCE and broader Eastern North Pacific (ENP).
Decline in Basking Shark Sightings
Our findings offer key insights into local basking shark abundance trends in the CCE, with implications for the broader ENP population. Most striking is the decrease in CCE sightings after the 1970s and 1980s, the drivers of which remain unclear. The decline cannot be attributed to sample design. While our most recent data was not systematically collected, the decline was first evident in systematic survey data. Squire (1967) reported sightings on 51.5% of flights during aerial surveys conducted from 1948 to 1950, whereas our systematic survey reported sightings on only 3.7% of flights from 1962 to 1988, after which no sharks were reported. Aerial surveys from 1962 to 1985 also showed a decline in abundance levels (Squire, 1990). Alternatively, this decline could be caused by a shift in the vertical distribution of sharks, since these data are contingent on sharks being at the surface. Yet though basking sharks do exhibit high variability in diving and subsurface feeding behavior, the predominant pattern in coastal regions globally is that sharks are at or near the surface feeding on convergence zones (Sims et al., 2005b; Gore et al., 2008; Skomal et al., 2009; Miller et al., 2015; Dewar et al., 2018). Though there are some exceptions in the North Atlantic (Siders et al., 2013; Westgate et al., 2014; Hoogenboom et al., 2015), basking sharks in the CCE have historically been observed surfacing regularly (Squire, 1967, 1990; Baduini, 1995; Dewar et al., 2018) and there is no evidence to suggest that vertical movement patterns changed (McFarlane et al., 2009).
Another potential hypothesis to explain reductions in basking shark sightings is that the sharks have migrated from the CCE due to changes in habitat suitability (i.e., high chl-a concentrations and cooler SST). Sims and Reid (2002) found that the decrease in basking shark catches in Irish fisheries from 1948 to 1975 correlated with a long-term zooplankton decline in the region and suggested that basking sharks had moved to more productive areas. However, McFarlane et al. (2009) argue that habitat availability for this species in the CCE is unlikely to have changed, given that basking sharks are often associated with humpback whale (Megaptera novaeangliae) distribution (Wallace and Gisborne, 2006) and humpback whale populations have actually increased over the same time period (COSEWIC, 2003). Furthermore, our analysis indicates that year was the strongest predictor of basking shark sightings, especially compared to the environmental predictors, with a significant decline in both sightings and group size.
The most parsimonious explanation for the reduction in basking shark sightings in the CCE and ENP is a decline in the population. McFarlane et al. (2009) came to the same conclusion based on sightings patterns in Western Canada from the same population. A likely contributor to the declining population is fisheries mortality. As mentioned above, basking sharks were historically targeted in fisheries, taken incidentally as bycatch and killed in Western Canada’s eradication program (McFarlane et al., 2009; Dewar et al., 2018). While the full range of the population is not known, basin-scale migrations are possible and additional sources of fisheries mortality likely came on the high-seas as well as off Japan, where there was a targeted fishery that stopped due to reduced occurrence of sharks (Bonfil, 1994; McKinnell and Seki, 1998; CITES, 2002). Additionally, there is precedence for reduced population size due to fisheries mortality for basking sharks in other regions; for example, in the United Kingdom (e.g., Sims et al., 2005a). Though little is known about basking shark reproductive biology, there were also likely time lags associated with directed and incidental mortality, which may explain the reduction in sightings beginning in the late 1980s and continuing to the present. Sexual maturity is thought to be at 12–16 years in males, and 16–20 years in females, with a gestation period of 1–3.5 years (Compagno, 1984) and a generation time of approximately 20–30 years (McFarlane et al., 2009). Therefore, population-level effects from mid-century fishing could have taken multiple decades to become apparent.
Consistent with a decline in population is a reduction in aggregation size in known hotspots (Chute, 1930; Roedel and Ripley, 1950; McFarlane et al., 2009). While there was variation in group size across all datasets, the 1948–1950 aerial survey reported occasional schools of hundreds to thousands of sharks (Squire, 1967) and the 1962–1985 aerial survey reported some schools of hundreds up to the early 1980s with an average of 21.8 sharks per sighting (Squire, 1990). In contrast, in the non-systematic data there were no groups of more than 10 individuals, including the aerial surveys for turtles and porpoises that ran until 2013 and reported primarily solitary individuals (Forney et al., 2014). While group size is inconsistently reported, studies suggest that other regions have had significantly larger aggregations over these same time periods. For example, Crowe et al. (2018) reported 10 large aggregations of 30–1,398 individuals from 1980 to 2013 in the Northeast Atlantic. Gore et al. (2018) observed 25 instances of >11 individuals off the coast of Scotland in 2016, and Wilson (2004) reported schools of up to 50 sharks in the Gulf of Maine in 2002.
The reduction in aggregation sizes in the CCE could have broader implications for basking shark recovery throughout the ENP. Recent studies in the Northeast Atlantic have found that basking sharks surfacing together are on average more genetically related than expected by chance (Lieber et al., 2020). It is therefore possible that aggregations, particularly among related individuals, may facilitate social information transfer, optimal foraging, and assortative mating (Lieber et al., 2020). For example, Baduini (1995) found that zooplankton density in the ENP was greater inside feeding areas when groups of 4+ sharks were observed, in comparison to areas with single animals. Consequently, aggregations may enhance foraging. Additionally, if aggregations are important for mating, a reduced group size could limit the population’s rebound potential. This is known as the Allee effect, when a population at low densities suffers a decrease in growth rate and consequently faces an increase likelihood of extinction (Courchamp et al., 1999). Comprehensive genetic, behavioral, and demographic research will be required to explore hypotheses for the suspected decline of the basking shark population in the ENP (Table 2).
Conservation Implications
Many of the historical threats to this population (i.e., targeted fisheries and incidental takes) have ceased in the CCE, with the last reported take in 2004 (McFarlane et al., 2009). However, threats outside of the CCE need to be considered. There are a variety of potential sources of mortality and sublethal effects throughout this population’s range, of which the CCE and Western Canada represents only a portion. Based on electronic tagging data (Gore et al., 2008; Dewar et al., 2018; Johnston et al., 2019), basking sharks that occur in the ENP enter international waters and may traverse the Pacific ocean basin. Hazards in coastal areas include development, habitat alteration, harassment, and ship strikes given their habit of moving slowly at the surface (McFarlane et al., 2009; Speedie et al., 2009). Another concern is incidental take in fisheries, especially in nets. In the Pacific, basking sharks have been documented both in coastal waters and on the high-seas in large-mesh drift gillnets, artisanal gear and in trawls (Berrow and Heardman, 1994; COSEWIC, 2007; Larese and Coan, 2008; Sandoval-Castillo et al., 2008; McFarlane et al., 2009). In addition, other directed fisheries appear to have recently emerged. Given that the number of marketed fins is more than accounted for in the CITES trade documents (Magnussen et al., 2007), fisheries mortality persists, although where those sharks originated is not always known given the lack of adequate species-specific data (Magnussen et al., 2007; Dewar et al., 2018).
Future Directions
The data available for our analyses had limitations that should be considered and improved for ongoing studies (Table 2). For example, we did not have enough data to account for changes in seasonality by year rather than decade, limiting our inferences regarding the drivers of shark sighting seasonality. We were also restricted in our selection of predictors for our species distribution models. For instance, we excluded high-resolution SST and data from zooplankton sampling surveys, which were missing information on the full temporal and spatial scale, respectively. Yet such information may provide important insights regarding prey abundance. Surface chl-a is not always a good proxy for lipid-rich boreal copepods (Brodeur et al., 2003), although records from the CCE suggest it positively correlates with C. pacificus abundance and production (Håkanson, 1987; Mullin, 1994; Nickels and Ohman, 2018). Because our models incorporate monthly predictors, we were unable to observe any fine-scale lags between primary and secondary productivity that may be affecting shark foraging behavior and movement. Furthermore, as mentioned above, it is likely that basking sharks in the CCE also feed at depth, limiting the efficacy of surface chl-a as an indicator of shark presence and prey abundance. More dynamic variables that predict convergence zones would likely also better reflect the spatial distribution of basking shark prey (see Finucci et al., 2021). Similarly, our model did not account for offshore or non-environmental cues that may drive basking sharks to coastal waters. For example, work on blue whales in the CCE has suggested that both long-term memory and resource tracking drive the migratory movements of some marine megafauna (Abrahms et al., 2019b). Larger-scale studies of basking sharks would better be able to identify whether similar drivers of distribution exist within this species. In addition, the aerial survey is no longer in operation, ending the best available time-series. Finally, the population structure and extent of the basking shark range is unknown but critical for any future stock assessment. Characterizing population structure will require additional research, monitoring, tagging and genetic analyses, as well as international coordination across studies (Table 2).
In parallel, it will be important to coordinate conservation measures across international boundaries to protect basking sharks from ongoing threats (Table 2). In the EEZ of the United States, Mexico, and Western Canada, basking sharks are protected and few, if any, incidental takes have been documented since the early 2000s (COSEWIC, 2007; McFarlane et al., 2009; Dewar et al., 2018). Here, actions to protect basking sharks could be expanded to reduce ships strikes by educating boaters on best practices. Outside of these three EEZs, markets selling shark fins should be closely monitored and efforts to develop forensic genetic methods should be undertaken. Such methods have successfully revealed the presence of threatened or protected baleen and toothed whales in retail markets and restaurants (e.g., Baker et al., 1996), and to document trade of basking shark products in Hong Kong, Japan, and the United States (Magnussen et al., 2007). In addition to enforcing current local and international regulations, such as CITES, another option to consider would be to upgrade the CITES listing to I, which would restrict international trade. Given the highly migratory nature of basking sharks, efforts at population recovery, particularly in the ENP, will require international cooperation for both research and management.
Data Availability Statement
The original contributions presented in the study are included in the article/Supplementary Material, further inquiries can be directed to the corresponding author/s.
Author Contributions
AM wrote the manuscript and performed the modeling and statistical analyses. BM assisted in writing the manuscript and performing the modeling and statistical analyses. HD, JB, NF, and DC assisted in writing and reviewing the manuscript. DE, HD, BM, and JB collated the sightings data. All authors contributed critically to the drafts and gave final approval for publication.
Funding
AM acknowledges funding from California Sea Grant’s Delta Science Fellowship (grant number 19054). NF would like to acknowledge funding from the University of California, Davis Agricultural Experiment Station (grant number 2098-H.).
Conflict of Interest
The authors declare that the research was conducted in the absence of any commercial or financial relationships that could be construed as a potential conflict of interest.
Publisher’s Note
All claims expressed in this article are solely those of the authors and do not necessarily represent those of their affiliated organizations, or those of the publisher, the editors and the reviewers. Any product that may be evaluated in this article, or claim that may be made by its manufacturer, is not guaranteed or endorsed by the publisher.
Acknowledgments
We would like to thank the many parties who contributed data used in this study. Specifically, we acknowledge the members of the public and recreational fishing community who provided reports, some of which led to tag deployments. The NOAA Species of Concern Program also provided funding to purchase tags and for their deployments. Owen Snodgrass offered invaluable assistance in managing the sightings database for NOAA. Thank you also to Nancy Lo for initially helping us understand the aerial survey data. We appreciate the efforts of the Pacific Shark Research Center Spot-A-Basking Shark Program to gather the data. PSRC/MLML students Jennifer Bigman, Kristen Walovich, and Amber Reichert assisted in data collection and collating sightings reports. Finally, we are grateful to Brad Erisman and Kelsey James at NOAA for their thoughtful comments on the initial manuscript, and to the two reviewers for improving this publication further.
Supplementary Material
The Supplementary Material for this article can be found online at: https://www.frontiersin.org/articles/10.3389/fmars.2022.818670/full#supplementary-material
References
Abrahms, B., Welch, H., Brodie, S., Jacox, M. G., Becker, E. A., Bograd, S. J., et al. (2019a). Dynamic ensemble models to predict distributions and anthropogenic risk exposure for highly mobile species. Divers. Distrib. 25, 1182–1193. doi: 10.1111/ddi.12940
Abrahms, B., Hazen, E. L., Aikens, E. O., Savoca, M. S., Goldbogen, J. A., Bograd, S. J., et al. (2019b). Memory and resource tracking drive blue whale migrations. Proc. Natl. Acad. Sci. U.S.A. 116, 5582–5587. doi: 10.1073/pnas.1819031116
Austin, R. A., Hawkes, L. A., Doherty, P. D., Henderson, S. M., Inger, R., Johnson, L., et al. (2019). Predicting habitat suitability for basking sharks (Cetorhinus maximus) in UK waters using ensemble ecological niche modelling. J. Sea Res. 153:101767. doi: 10.1016/j.seares.2019.101767
Baduini, C. (1995). Feeding Ecology of the Basking Shark (Cetorhinus maximus) Relatice To Distribution And Abundance Of Prey. Ph.D. thesis. Moss Landing, CA: Moss Landing Marine Laboratories San Jose State University, doi: 10.31979/etd.zh8m-jsdr
Baker, C. S., Cipriano, F., and Palumbi, S. R. (1996). Molecular genetic identification of whale and dolphin products from commercial markets in Korea and Japan. Mol. Ecol. 5, 671–685. doi: 10.1111/J.1365-294X.1996.TB00362.X
Berrow, S., and Heardman, C. (1994). The basking shark Cetorhinus maximus (Gunnerus) in Irish waters – patterns of distribution and abundance. Proc. R. Irish Acad. 94, 101–107.
Block, B. A., Jonsen, I. D., Jorgensen, S. J., Winship, A. J., Shaffer, S. A., Bograd, S. J., et al. (2011). Tracking apex marine predator movements in a dynamic ocean. Nature 475, 86–90. doi: 10.1038/nature10082
Blondin, H., Abrahms, B., Crowder, L. B., and Hazen, E. L. (2020). Combining high temporal resolution whale distribution and vessel tracking data improves estimates of ship strike risk. Biol. Conserv. 250:108757. doi: 10.1016/j.biocon.2020.108757
Bonfil, R. (1994). Overview of World Elasmobranch Fisheries. FAO Fisheries Technical Paper 341. Rome: FAO, 119.
Braun, C. D., Skomal, G. B., and Thorrold, S. R. (2018). Integrating archival tag data and a high-resolution oceanographic model to estimate basking shark (Cetorhinus maximus) movements in the western Atlantic. Front. Mar. Sci. 5:25. doi: 10.3389/fmars.2018.00025
Brodeur, R., Pearcy, W., and Ralston, S. (2003). Abundance and distribution patterns of nekton and micronekton in the northern california current transition zone. J. Oceanogr. 59, 515–535.
Brodie, S. J., Thorson, J. T., Carroll, G., Hazen, E. L., Bograd, S., Haltuch, M. A., et al. (2020). Trade-offs in covariate selection for species distribution models: a methodological comparison. Ecography 43, 11–24. doi: 10.1111/ecog.04707
Brown, J. H., Gillooly, J. F., Allen, A. P., Savage, V. M., and West, G. B. (2004). Toward a metabolic theory of ecology. Ecology 85, 1771–1789. doi: 10.1890/03-9000
Caruso, J. P., Meyer, C. A., and Iacometti, S. (1983). Aerial Marine Resources Monitoring System. La Jolla, CA: Southwest Fisheries Science Center, National Marine Fisheries Service.
Chute, J. (1930). The Lily-Iron returns to Monterey Bay: Shark fishing recommences on a harpoon basis. Calif. Fish Game 16, 143–151.
CITES. (2002). Consideration of proposals for amendment of Appendices I and II. Proposal: Inclusion of Basking Shark (Cetorhinus maximus) on Appendix II of CITES. Prop. 12.1. Geneva: CITES.
Compagno, L. J. V. (1984). FAO species catalogue. Vol. 4. Sharks of the world. An annotated and illustrated catalogue of shark species known to date. Part 1 – Hexanchiformes to Lamniformes. FAO Fish. Synopsies 125, 1–249.
COSEWIC (2003). Update COSEWIC Status Report On The Humpback Whale Megaptera Novaeangliae in Canada. Ottawa, ON: Committee on the Status of Endangered Wildlife in Canada.
COSEWIC (2007). Assessment and Status Report on the Basking Shark (Cetorhinus Maximus) Pacific Population in Canada. Ottawa, ON: Committee on the Status of Endangered Wildlife in Canada, 34.
Cotton, P. A., Sims, D. W., Fanshawe, S., and Chadwick, M. (2005). The effects of climate variability on zooplankton and basking shark (Cetorhinus maximus) relative abundance off southwest Britain. Fish. Oceanogr. 14, 151–155. doi: 10.1111/j.1365-2419.2005.00331.x
Courchamp, F., Clutton-Brock, T., and Grenfell, B. (1999). Inverse density dependence and the Allee effect. Trends Ecol. Evol. 14, 405–410. doi: 10.1016/S0169-5347(99)01683-3
Croll, D. A., Marinovic, B., Benson, S., Chavez, F. P., Black, N., Ternullo, R., et al. (2005). From wind to whales: trophic links in a coastal upwelling system. Mar. Ecol. Prog. Ser. 289, 117–130. doi: 10.3354/MEPS289117
Crowe, L. M., O’Brien, O., Curtis, T. H., Leiter, S. M., Kenney, R. D., Duley, P., et al. (2018). Characterization of large basking shark Cetorhinus maximus aggregations in the western North Atlantic Ocean. J. Fish Biol. 92, 1371–1384. doi: 10.1111/jfb.13592
Curtis, T. H., Zeeman, S. I., Summers, E. L., Cadrin, S. X., and Skomal, G. B. (2014). Eyes in the sky: Linking satellite oceanography and biotelemetry to explore habitat selection by basking sharks. Anim. Biotelemetry 2, 1–14. doi: 10.1186/2050-3385-2-12
Darling, J., and Keogh, K. (1994). Observations of basking sharks, Cetorhinus maximus, in Clayoquot Sound, British Columbia. Can. Field Nat. 108, 199–210.
Dewar, H., Wilson, S. G., Hyde, J. R., Snodgrass, O. E., Leising, A., Lam, C. H., et al. (2018). Basking shark (Cetorhinus maximus) movements in the eastern north pacific determined using satellite telemetry. Front. Mar. Sci. 5:163. doi: 10.3389/fmars.2018.00163
Di Lorenzo, E., Schneider, N., Cobb, K. M., Franks, P. J. S., Chhak, K., Miller, A. J., et al. (2008). North Pacific Gyre Oscillation links ocean climate and ecosystem change. Geophys. Res. Lett. 35, 2–7. doi: 10.1029/2007GL032838
Doherty, P. D., Baxter, J. M., Gell, F. R., Godley, B. J., Graham, R. T., Hall, G., et al. (2017). Long-term satellite tracking reveals variable seasonal migration strategies of basking sharks in the north-east Atlantic. Sci. Rep. 7, 1–10. doi: 10.1038/srep42837
Dolton, H. R., Gell, F. R., Hall, J., Hall, G., Hawkes, L. A., and Witt, M. J. (2020). Assessing the importance of Isle of Man waters for the basking shark Cetorhinus maximus. Endanger. Species Res. 41, 209–223. doi: 10.3354/esr01018
Doniol-Valcroze, T., Berteaux, D., Larouche, P., and Sears, R. (2007). Influence of thermal fronts on habitat selection by four rorqual whale species in the Gulf of St. Lawrence. Mar. Ecol. Prog. Ser. 335, 207–216. doi: 10.3354/MEPS335207
Drymon, J. M., Powers, S. P., Dindo, J., Dzwonkowski, B., and Henwood, T. A. (2011). Distributions of sharks across a continental shelf in the northern gulf of mexico. Mar. Coast. Fish. 2, 440–450. doi: 10.1577/C09-061.1
Elith, J., Graham, C., Anderson, R. P., Dudík, M., Ferrier, S., Guisan, A., et al. (2006). Novel methods improve prediction of species’ distributions from occurrence data. Ecography 29, 129–151. doi: 10.1111/j.2006.0906-7590.04596.x
Estes, J. A., Terborgh, J., Brashares, J. S., Power, M. E., Berger, J., Bond, W. J., et al. (2011). Trophic downgrading of planet earth. Science 333, 301–306. doi: 10.1126/science.1205106
Finucci, B., Duffy, C. A. J., Brough, T., Francis, M. P., Milardi, M., Pinkerton, M. H., et al. (2021). Drivers of spatial distributions of basking shark (Cetorhinus maximus) in the Southwest Pacific. Front. Mar. Sci. 8:665337. doi: 10.3389/fmars.2021.665337
Forney, K. A., Carretta, J. V., and Benson, S. R. (2014). Preliminary Estimates of Harbor Porpoise Abundance in Pacific Coast Waters of California, Oregon, and Washington, 2007-2012. August, 25. La Jolla, CA: National Oceanic and Atmospheric Administration.
Francis, M. P., and Duffy, C. (2002). Distribution, seasonal abundance and bycatch of basking sharks (Cetorhinus maximus) in New Zealand, with observations on their winter habitat. Mar. Biol. 140, 831–842. doi: 10.1007/s00227-001-0744-y
Gore, M. A., Frey, P. H., Ormond, R. F., Allan, H., and Gilkes, G. (2016). Use of photo-identification and mark-recapture methodology to assess basking shark (Cetorhinus maximus) populations. PLoS One 11:e0150160. doi: 10.1371/journal.pone.0150160
Gore, M. A., Rowat, D., Hall, J., Gell, F. R., and Ormond, R. F. (2008). Transatlantic migration and deep mid-ocean diving by basking shark. Biol. Lett. 4, 395–398. doi: 10.1098/rsbl.2008.0147
Gore, M., Abels, L., Wasik, S., Saddler, L., and Ormond, R. (2018). Are close-following and breaching behaviours by basking sharks at aggregation sites related to courtship? J. Mar. Biol. Assoc. U. K. 99, 1–13. doi: 10.1017/S0025315418000383
Håkanson, J. L. (1987). The feeding condition of Calanus pacificus and other zooplankton in relation to phytoplankton pigments in the California Current. Limnol. Oceanogr. 32, 881–894. doi: 10.4319/lo.1987.32.4.0881
Hanley, J. A., and McNeil, B. J. (1982). The meaning and use of the area under a receiver operating characteristic (ROC) curve. Radiology 143, 29–36. doi: 10.2196/jmir.9160
Harvey, C., Garfield, T., Williams, G., and Tolimieri, N. (2020). California Current Integrated Ecosystem Assessment (CCIEA) California Current Ecosystem Status Report 2020. Portland, OR: Pacific Fishery Management Council.
Hazen, E. L., Scales, K. L., Maxwell, S. M., Briscoe, D. K., Welch, H., Bograd, S. J., et al. (2018). A dynamic ocean management tool to reduce bycatch and support sustainable fisheries. Sci. Adv. 4, 1–8. doi: 10.1126/sciadv.aar3001
Heithaus, M. R., Frid, A., Wirsing, A. J., and Worm, B. (2008). Predicting ecological consequences of marine top predator declines. Trends Ecol. Evol. 23, 202–210. doi: 10.1016/j.tree.2008.01.003
Hijmans, R. J., Phillips, S., Leathwick, J., and Elith, J. (2017). Package “dismo.”. Circles 9, 1–68.
Hoogenboom, J. L., Wong, S. N. P., Ronconi, R. A., Koopman, H. N., Murison, L. D., and Westgate, A. J. (2015). Environmental predictors and temporal patterns of basking shark (Cetorhinus maximus) occurrence in the lower Bay of Fundy, Canada. J. Exp. Mar. Biol. Ecol. 465, 24–32. doi: 10.1016/j.jembe.2015.01.005
Johnston, E. M., Mayo, P. A., Mensink, P. J., Savetsky, E., and Houghton, J. D. R. (2019). Serendipitous re-sighting of a basking shark Cetorhinus maximus reveals inter-annual connectivity between American and European coastal hotspots. J. Fish Biol. 95, 1530–1534. doi: 10.1111/jfb.14163
Jordan, D. S. (1887). “Coast of california,” in The Whale Fishery: US Commercial Fish and Fisheries, Fisheris and Fishery Industries of the United States, ed. G. B. Goode (Washington, DC: U.S. Government Publishing Office), 52–61.
Larese, J. P., and Coan, A. L. (2008). Fish And Invertebrate Bycatch Estimates For The California Drift Gillnet Fishery Targeting Swordfish And Thresher Sharks 1990- 2006. NOAA Technical Memorandum. NOAA-TM-NMFS-SWFSC-426. Washington, DC: NOAA, 57.
Lieber, L., Berrow, S., Johnston, E., Hall, G., Hall, J., Gubili, C., et al. (2013). Mucus: aiding elasmobranch conservation through non-invasive genetic sampling. Endanger. Species Res. 21, 215–222. doi: 10.3354/esr00524
Lieber, L., Hall, G., Hall, J., Berrow, S., Johnston, E., Gubili, C., et al. (2020). Spatio-temporal genetic tagging of a cosmopolitan planktivorous shark provides insight to gene flow, temporal variation and site-specific re-encounters. Sci. Rep. 10, 1–17. doi: 10.1038/s41598-020-58086-4
Lien, J., and Fawcett, L. (1986). Distribution of basking sharks, Cetorhinus maximus, incidentally caught in inshore fishing gear in Newfoundland. Can. Field Nat. 100, 246–252.
Lucifora, L. O., Menni, R. C., and Escalante, A. H. (2005). Reproduction, abundance and feeding habits of the broadnose sevengill shark Notorynchus cepedianus in north Patagonia, Argentina. Mar. Ecol. Prog. Ser. 289, 237–244. doi: 10.3354/MEPS289237
Magnussen, J. E., Pikitch, E. K., Clarke, S. C., Nicholson, C., Hoelzel, A. R., and Shivji, M. S. (2007). Genetic tracking of basking shark products in international trade. Anim. Conserv. 10, 199–207. doi: 10.1111/j.1469-1795.2006.00088.x
McFarlane, G. A., King, J. R., Leask, K., and Christensen, L. B. (2009). Assessment Of Information Used To Develop a Recovery Potential Assessment for Basking Shark Cetorhinus maximus (Pacific Population) in Canada. Canadian Science Advisory Secretariat Resource Document 2008/071. 98.
McKinnell, S., and Seki, M. P. (1998). Shark bycatch in the Japanese high seas squid driftnet fishery in the North Pacific Ocean. Fish. Res. 39, 127–138. doi: 10.1016/S0165-7836(98)00179-9
Mendelssohn, R. (2020). Rerddapxtracto: Extracts Environmental Data from “ERDDAP” Web Services. R Package Version 1.0.0.
Mieras, P. A., Harvey-Clark, C., Bear, M., Hodgin, G., and Hodgin, B. (2017). “The economy of shark conservation in the northeast pacific: the role of ecotourism and citizen science,” in Advances in Marine Biology, Vol. 78, ed. C. Sheppard (Amsterdam: Elsevier Ltd), doi: 10.1016/bs.amb.2017.08.003
Miller, P. I., Scales, K. L., Ingram, S. N., Southall, E. J., and Sims, D. W. (2015). Basking sharks and oceanographic fronts: quantifying associations in the north-east Atlantic. Funct. Ecol. 29, 1099–1109. doi: 10.1111/1365-2435.12423
Mullin, M. M. (1994). Distribution and reproduction of the planktonic copepod, Calanus pacificus, off southern California during winter-spring of 1992, relative to 1989–91. Fish. Oceanogr. 3, 142–157. doi: 10.1111/j.1365-2419.1994.tb00056.x
Nickels, C. F., and Ohman, M. D. (2018). CCEIII: persistent functional relationships between copepod egg production rates and food concentration through anomalously warm conditions in the California Current Ecosystem. Deep Sea Res. Part I 140, 26–35. doi: 10.1016/j.dsr.2018.07.001
Owen, R. E. (1984). Distribution and Ecology of the Basking Shark Cetorhinus maximus (Gunnerus 1765). Kingston, RI: University of Rhode Island.
Pacoureau, N., Rigby, C. L., Kyne, P. M., Sherley, R. B., Winker, H., Carlson, J. K., et al. (2021). Half a century of global decline in oceanic sharks and rays. Nature 589, 567–571. doi: 10.1038/s41586-020-03173-9
Parisien, M. A., and Moritz, M. A. (2009). Environmental controls on the distribution of wildfire at multiple spatial scales. Ecol. Monogr. 79, 127–154. doi: 10.1890/07-1289.1
Payne, N. L., Smith, J. A., Meulen, D. E., Taylor, M. D., Watanabe, Y. Y., Takahashi, A., et al. (2016). Temperature dependence of fish performance in the wild: links with species biogeography and physiological thermal tolerance. Funct. Ecol. 30, 903–912. doi: 10.1111/1365-2435.12618
Peterson, C. D., Belcher, C. N., Bethea, D. M., Driggers, W. B., Frazier, B. S., and Latour, R. J. (2017). Preliminary recovery of coastal sharks in the south-east United States. Fish Fish. 18, 845–859. doi: 10.1111/faf.12210
PFMC (2018). Fishery Management Plan for US West Coast Fisheries for Highly Migratory Species. 1–78. Portland, Oregon: Pacific Fishery Management Council.
Polovina, J. J., and Woodworth-Jefcoats, P. A. (2013). Fishery-induced changes in the subtropical pacific pelagic ecosystem size structure: observations and theory. PLoS One 8:4. doi: 10.1371/JOURNAL.PONE.0062341
R Core Team (2020). R: A Language And Environment For Statistical Computing. Vienna: R Foundation for Statistical Computing.
Rayner, N. A., Parker, D. E., Horton, E. B., Folland, C. K., Alexander, L. V., Rowell, D. P., et al. (2003). Global analyses of sea surface temperature, sea ice, and night marine air temperature since the late nineteenth century. J. Geophys. Res. 108:14. doi: 10.1029/2002jd002670
Rigby, C. L., Barreto, R., Carlson, J., Fernando, D., Fordham, S., Francis, M. P., et al. (2021). Cetorhinus Maximus (Amended Version Of 2019 Assessment). The IUCN Red List of Threatened Species 2021: e.T4292A194720078. Available online at: https://dx.doi.org/10.2305/IUCN.UK.2021-1.RLTS.T4292A194720078.en (accessed January 5, 2022).
Roedel, P. M., and Ripley, W. E. (1950). California sharks and rays (Issue 75). Calif. Fish Game Bull. 75:88.
Runcie, R. M., Muhling, B., Hazen, E. L., Bograd, S. J., Garfield, T., and DiNardo, G. (2019). Environmental associations of Pacific bluefin tuna (Thunnus orientalis) catch in the California Current system. Fish. Oceanogr. 28, 372–388. doi: 10.1111/fog.12418
Sandoval-Castillo, J., Ramirez-Gonzalez, J., and Villavicencio-Garayzar, C. (2008). First record of basking shark (Cetorhinus maximus) in Mexico? Mar. Biodivers. Rec. 1:e19. doi: 10.1017/s1755267206001874
Sathyendranath, S., Brewin, R. J. W., Brockmann, C., Brotas, V., Calton, B., Chuprin, A., et al. (2019). An ocean-colour time series for use in climate studies: the experience of the ocean-colour climate change initiative (OC-CCI). Sensors (Switzerland) 19:19. doi: 10.3390/s19194285
Siders, Z. A., Westgate, A. J., Johnston, D. W., Murison, L. D., and Koopman, H. N. (2013). Seasonal variation in the spatial distribution of basking sharks (Cetorhinus maximus) in the Lower Bay of Fundy, Canada. PLoS One 8:e82074. doi: 10.1371/JOURNAL.PONE.0082074
Simons, R. A. (2020). ERDDAP. NOAA/NMFS/SWFSC/ERD. Available online at: https://coastwatch.pfeg.noaa.gov/erddap (accessed December 8, 2020).
Simpfendorfer, C. A., Hueter, R. E., Bergman, U., and Connett, S. M. H. (2002). Results of a fishery-independent survey for pelagic sharks in the western North Atlantic, 1977–1994. Fish. Res. 55, 175–192. doi: 10.1016/S0165-7836(01)00288-0
Sims, D. W., and Quayle, V. A. (1998). Selective foraging behaviour of basking sharks on zooplankton in a small-scale front. Nature 393, 460–465. doi: 10.1038/30959
Sims, D. W., and Reid, P. C. (2002). Congruent trends in long-term zooplankton decline in the north-east Atlantic and basking shark (Cetorhinus maximus) fishery catches off west Ireland. Fish. Oceanogr. 11, 59–63. doi: 10.1046/j.1365-2419.2002.00189.x
Sims, D. W., Southall, E. J., Metcalfe, J. D., and Pawson, M. G. (2005a). Basking Shark Population Assessment Final Project Report Basking Shark Population Assessment: Final report for Global Wildlife Division of Defra, Tender CR 0247. Available online at: https://www.mba.ac.uk/sites/default/files/downloads/Sims-etal_Basking-shark-final-report_Defra2005.pdf (accessed January 5, 2022).
Sims, D. W., Southall, E. J., Richardson, A. J., Reid, P. C., and Metcalfe, J. D. (2003). Seasonal movements and behaviour of basking sharks from archival tagging: no evidence of winter hibernation. Mar. Ecol. Prog. Ser. 248, 187–196. doi: 10.3354/meps248187
Sims, D. W., Southall, E. J., Tarling, G. A., and Metcalfe, J. D. (2005b). Habitat-specific normal and reverse diel vertical migration in the plankton-feeding basking shark. J. Anim. Ecol. 74, 755–761. doi: 10.1111/j.1365-2656.2005.00971.x
Skomal, G. B., Wood, G., and Caloyianis, N. (2004). Archival tagging of a basking shark, Cetorhinus maximus, in the western North Atlantic. J. Mar. Biol. Assoc. 84, 795–799.
Skomal, G., Zeeman, S., Chisholm, J., Summers, E. L., Walsh, H. J., McMahon, K. W., et al. (2009). Transequatorial migrations by basking sharks in the western Atlantic Ocean. Curr. Biol. 19, 1019–1022. doi: 10.1016/j.cub.2009.04.019
Southall, E. J., Sims, D. W., Metcalfe, J. D., Doyle, J. I., Fanshawe, S., Lacey, C., et al. (2005). Spatial distribution patterns of basking sharks on the European shelf: preliminary comparison of satellite-tag geolocation, survey and public sightings data. J. Mar. Biol. Assoc. U. K. 85, 1083–1088. doi: 10.1017/S0025315405012129
Speedie, C. D., Johnson, L. A., and Witt, M. J. (2009). Basking Shark Hotspots on the West Coast of Scotland: Key Sites, Threats And Implications For Conservation Of The Species. Commissioned Report No.339. Available online at: http://publicationslist.org/data/m.j.witt/ref-69/SNH%20Report%20339.%20Basking%20sharks.%20Speedie%20et%20al.%202009.pdf
Squire, J. L. (1967). Observations of basking sharks and great white sharks in monterey bay, 1948-50. Copeia 1967:247. doi: 10.2307/1442218
Squire, J. L. (1990). Distribution and apparent abundance of the basking shark, Cetorhinus maximus, off the central and southern California coast, 1962-85. Mar. Fish. Rev. 52, 8–11.
Thomas, T. (2004). Dancing on the belly of the shark and other adventures on monterey bay. Q. Bull. Monterey Bay Hist. Art Assoc. LIII, 2–25.
Wallace, S., and Gisborne, B. (2006). Basking Sharks: The Slaughter of BC’s Gentle Giants. Vancouver, BC: New Star Books.
Went, A. E. J., and Súilleabháin, S. (1967). “Fishing for the sun-fish or basking shark in irish waters. Proc. R. Irish Acad. 65, 91–115.
Westgate, A. J., Koopman, H. N., Siders, Z. A., Wong, S. N. P., and Ronconi, R. A. (2014). Population density and abundance of basking sharks Cetorhinus maximus in the lower Bay of Fundy, Canada. Endanger. Species Res. 23, 177–185. doi: 10.3354/ESR00567
Wilson, S. G. (2004). Basking sharks (Cetorhinus maximus) schooling in the southern Gulf of Maine. Fish. Oceanogr. 13, 283–286. doi: 10.1111/j.1365-2419.2004.00292.x
Witt, M. J., Hardy, T., Johnson, L., McClellan, C. M., Pikesley, S. K., Ranger, S., et al. (2012). Basking sharks in the northeast Atlantic: spatio-temporal trends from sightings in UK waters. Mar. Ecol. Prog. Ser. 459, 121–134. doi: 10.3354/meps09737
Keywords: species distribution model, population trend, schooling behavior, conservation, behavioral ecology, environmental change
Citation: McInturf AG, Muhling B, Bizzarro JJ, Fangue NA, Ebert DA, Caillaud D and Dewar H (2022) Spatial Distribution, Temporal Changes, and Knowledge Gaps in Basking Shark (Cetorhinus maximus) Sightings in the California Current Ecosystem. Front. Mar. Sci. 9:818670. doi: 10.3389/fmars.2022.818670
Received: 19 November 2021; Accepted: 17 January 2022;
Published: 17 February 2022.
Edited by:
Rob Harcourt, Macquarie University, AustraliaReviewed by:
Francesca Pancaldi, Instituto Politécnico Nacional (IPN), MexicoHeather Koopman, University of North Carolina, Wilmington, United States
Copyright © 2022 McInturf, Muhling, Bizzarro, Fangue, Ebert, Caillaud and Dewar. This is an open-access article distributed under the terms of the Creative Commons Attribution License (CC BY). The use, distribution or reproduction in other forums is permitted, provided the original author(s) and the copyright owner(s) are credited and that the original publication in this journal is cited, in accordance with accepted academic practice. No use, distribution or reproduction is permitted which does not comply with these terms.
*Correspondence: Alexandra G. McInturf, amcinturf@ucdavis.edu; orcid.org/0000-0003-1998-0187; Damien Caillaud, dcaillaud@ucdavis.edu; orcid.org/0000-0002-8347-6869