Sub-Regional Marine Heat Waves in the Mediterranean Sea From Observations: Long-Term Surface Changes, Sub-Surface and Coastal Responses
 Mélanie Juza
 Àngels Fernández-Mora
 Joaquin Tintoré
- 1Balearic Islands Coastal Observing and Forecasting System (SOCIB), Palma, Spain
- 2Mediterranean Institute for Advanced Studies (IMEDEA) (CSIC-UIB), Esporles, Spain
Society is facing climate-related challenges and impacts, such as marine heat wave (MHW) events that adversely affect ecosystems, threaten economies and strengthen storms by warming ocean waters. MHWs are substantially increasing in intensity, duration and frequency worldwide, particularly in the Mediterranean Sea, which responds rapidly to climate change. This study proposes a comprehensive analysis of MHWs in the different sub-regions of the Mediterranean, where the strong spatial variability requires focused attention, from surface to sub-surface and from open to coastal oceans. At surface, the MHW indices have dramatically increased over the last four decades from 1982 to 2020, with an unprecedented acceleration rate in recent years in all sub-regions. Besides the sub-regional features of surface MHWs, the propagation of such events into the ocean interior is also examined highlighting sub-regional and seasonal variability in the sub-surface ocean response. The resulting upper-ocean density stratification to these extreme events is enhanced in all sub-regions which would increase the degree of decoupling between surface and deep oceans causing changes in water masses and marine life. Finally, extremely warm events in coastal waters are also addressed through a case study in the Balearic Islands showing their higher intensity and occurrence in near-shore environment as well as the different response from surface to sub-surface that strongly depends on local features. In addition to this study, the Balearic Islands Coastal Observing and Forecasting System (SOCIB) has implemented a smart platform to monitor, visualize and share timely information on sub-regional MHWs, from event detection in real-time to long-term variations in response to global warming, to diverse stakeholders. Society-aligned ocean information at sub-regional scale will support the policy decision-making and the implementation of specific actions at local, national and regional scales, and thus contribute to respond to societal and worldwide environmental challenges.
Introduction
Marine heat waves (MHW) are extreme warm ocean temperature events during prolonged periods (Hobday et al., 2016). As a consequence of climate change, MHWs are substantially increasing worldwide in frequency, duration and magnitude (Frölicher et al., 2018; Oliver et al., 2018), with harmful impacts on coastal ecosystems and human activities. MHWs are triggered by anomalous atmospheric conditions that are generated or modulated by anthropogenic warming, large-scale climate modes (e.g., El Niño Southern Oscillation and Atlantic Multi-decadal Oscillation), favorable synoptic systems (e.g., high-pressure system and wind stress change), remote atmospheric teleconnections (e.g., Rossby waves and Walker circulation) or local processes (air-sea heat flux) (Schaeffer and Roughan, 2017; Holbrook et al., 2019; Gupta et al., 2020). By reducing the cloud cover, enhancing the insolation and/or suppressing the surface wind speed, these drivers increase the solar radiation into the ocean and reduce the latent and sensible heat losses from ocean to atmosphere (Bond et al., 2015; Holbrook et al., 2019; Gupta et al., 2020). Oceanic drivers have been also identified such as remote oceanic teleconnection (e.g., Rossby and Kelvin waves) or local processes affecting the mixed layer temperature (e.g., ocean advection, mesoscale circulation, and vertical processes) (Schaeffer and Roughan, 2017; Elzahaby and Schaeffer, 2019; Holbrook et al., 2019). The impacts of MHWs on the physical ocean may be multiple: mixed layer shoaling, suppression of vertical mixing, reduction of vertical heat transport, reduction of coastal upwelling and Ekman pumping and increase of warm-water horizontal transport (Holbrook et al., 2019). These changes in the physical ocean system affect, in turn, the marine ecosystems.
Several studies on MHW events worldwide have shown their devastating impacts on marine species and ecosystem structure (Wernberg et al., 2013), causing coral bleaching (Benthuysen et al., 2018; Hughes et al., 2018), declines in seagrass meadows and kelp forests (Wernberg et al., 2013; Arias-Ortiz et al., 2018; Holbrook et al., 2020; Wernberg, 2021), harmful algal blooms (Bensoussan et al., 2019), mass mortality of marine organisms (Cerrano et al., 2000; Mills et al., 2013; Short et al., 2015; Jones et al., 2018), irreversible physiological damage, change in species behavior and irreversible redistribution in coastal benthic communities (Johnson et al., 2011; Wernberg et al., 2016; Smale et al., 2019; Verdura et al., 2019). MHWs are emerging as major players in the modification and restructuration of the entire ecosystem, and will severely impact the provision of ecological goods and services in the coming decades (Mills et al., 2013; Smale et al., 2019; Holbrook et al., 2020). MHWs are not restricted to the surface and can propagate deeper in the water column (Elzahaby and Schaeffer, 2019). The depth penetration of such warm events also have negative ecological consequences (Schaeffer and Roughan, 2017) and could also impact the mesopelagic habitats (Santora et al., 2020).
The ocean stratification plays a crucial role in many physical and biogeochemical processes. It directly affects the deepening of the mixed layer that regulates light availability for photosynthesis and nutrient supply from deep to surface oceans, which are major factors in biological productivity. It also influences the ocean ventilation that involves the subduction of surface waters into the ocean interior and the absorption of heat, carbon and oxygen which have fundamental roles in the ocean acidification and the biogeochemical cycle. As a consequence of global warming, globally-averaged upper-ocean thermal stratification has increased due to surface intensification of the warming signal (Capotondi et al., 2012; Rhein et al., 2013; Fu et al., 2016; Moore et al., 2018). Several studies using in situ observations or models have shown the enhanced upper-ocean density stratification, with regional and seasonal patterns (Capotondi et al., 2012; Yamaguchi and Suga, 2019), providing light availability for the phytoplankton community but preventing vertical nutrient supply from sub-surface ocean to euphotic zone (Doney, 2006).
As a semi-enclosed and relatively small basin, including many coastal areas and islands, the Mediterranean Sea is one of the most vulnerable regions to climate change and responds rapidly to global warming (Giorgi, 2006; Lionello and Scarascia, 2018), from the surface to the deep ocean, from coastal to open ocean waters, through oceanographic and environmental changes (Bethoux et al., 1999). The surface Mediterranean warming rate is approximately three or four times higher than the global ocean one (von Schuckmann et al., 2020; Juza and Tintoré, 2021) with basin-averaged trend estimations of sea surface temperature (SST) around 0.041 ± 0.006°C/year over 1982–2018 (Pisano et al., 2020), 0.037 ± 0.003°C/year over 1982–2019 (von Schuckmann et al., 2020) and 0.038 ± 0.002°C/year over 1982–2020 (Juza and Tintoré, 2021). The authors also highlighted the strong spatial variability in SST trend estimations. Trend values over 1982–2020 have been estimated at 0.032 and 0.044 ± 0.002°C/year as averages in the western and eastern Mediterranean, respectively (Juza and Tintoré, 2021), and at 0.033 ± 0.004°C/year in the Ionian and Levantine Seas (Ibrahim et al., 2021). The rapid sea surface warming trend in this ocean basin has been associated with strong increase in MHW days, particularly during the last two decades since the beginning of the 20th century (Bensoussan et al., 2019; Ibrahim et al., 2021; Juza and Tintoré, 2021). MHWs in the Mediterranean have been related to large-scale atmospheric anomalies (e.g., persistent high-pressure system) inducing hot and dry weather as the extreme event in summer 2003 (Sparnocchia et al., 2006; Olita et al., 2007; Holbrook et al., 2019). The global warming-enhanced stratification and extreme events may also modify water mass properties in intermediate and deep layers as observed in the Mediterranean by several authors (e.g., Schröder et al., 2006; Schroeder et al., 2016; Houpert et al., 2016; Ozer et al., 2017; Juza et al., 2019; Vargas-Yáñez et al., 2021) and cause mass mortality events (Coma et al., 2009). The coastal near-shore ecosystem is highly vulnerable to global warming and extreme temperature events that threaten the biodiversity in the Mediterranean Sea (Cerrano et al., 2000; Garrabou et al., 2009; Bensoussan et al., 2019; Verdura et al., 2019). The climate signal manifests differently from the coastal areas to the open ocean and in the different sub-regions due to the variety of coastal ocean processes such as upwelling, river discharge, coastal dynamics, waves, geomorphology and atmospheric pattern.
The Mediterranean Sea is experiencing strong spatial variations in response to global warming that require specific consideration, in particular to better understand the drivers, mechanisms and consequences of extreme events on the physical, biogeochemical and biological components of the ocean. The main purpose of this study is to comprehensively characterize and analyze MHWs in the Mediterranean Sea at sub-regional scale from surface to sub-surface and from open ocean to coastal near-shore waters, using remote sensing and multi-platform in situ observations. The satellite products deliver the longest observational time series of surface ocean information over the whole basin, the profiling floats give valuable information on sub-surface conditions and the fixed moorings enable a coastal study providing near-shore data. First, the long-term evolution of MHWs characteristics (mean and maximum intensities, mean duration, and frequency) in the Mediterranean Sea is quantitatively estimated and analyzed using the 39-year satellite observation records. The surface ocean response to global warming is also characterized in the different sub-regions to consider the strong spatial variability of the Mediterranean dynamics and to provide suitable estimations and indices for environmental agencies and decision-makings at local, national and regional scales. Then, a 9-year collection of vertical hydrographic profiles from profiling floats is processed to analyze the propagation of sub-regional MHWs into the ocean interior where amount of heat is absorbed affecting directly marine ecosystems, as well as vertical ocean properties and ocean circulation. The global-warming modified stratification in the Mediterranean, which can cause changes in water masses and marine life, is also investigated in the different sub-regions through the depth penetration of MHWs. Finally, the ocean response to extreme temperature events will be also addressed in the coastal environment, using mooring data in the near-shore waters of the Balearic Islands and comparing them with nearby near-shore and off-shore satellite locations. Thus, a comprehensive insight on the behavior of the ocean, enabled by the systematic monitoring over long-term periods, will be provided from local to sub-regional scales, from the surface to the sub-surface and from open ocean to coastal waters.
This paper is organized as follows: section “Sub-Regional Approach” introduces the sub-regional approach in the Mediterranean Sea and describes the dynamical sub-regions. Section “Data and Methodology” provides a detailed description of the data used, methodologies applied and diagnostics performed for the computation and analysis of MHWs. Section “Sub-Regional Marine Heat Waves” discusses the sub-regional variability of MHWs at surface over the last four decades from 1982 to 2020. Sections “Depth Penetration of Marine Heat Waves” and “Coastal Marine Heat Waves” address the sub-surface and coastal ocean responses to such extreme events, respectively. Finally, Section “Conclusion and Perspectives” provides conclusions and perspectives.
Sub-Regional Approach
The present study aims at estimating the evolution of MHW characteristics in the different sub-regions of Mediterranean Sea. The sub-regional approach has been shown to be relevant in the Mediterranean which has strong spatial variability in terms of ocean dynamics, water mass formation, ocean indicators including ocean warming or trophic regimes (D’Ortenzio and Ribera d’Alcalá, 2009; Pinardi et al., 2015; Juza et al., 2016a; Mayot et al., 2016; Juza and Tintoré, 2021). The linear trends with 95% confidence level (according to the methodology from Chelton (1983) using the effective degrees of freedom) of SST over 1982–2020 in the Mediterranean (Figure 1A) also highlight the longitudinal difference and the strong variability inside each sub-basin in surface warming rate with values oscillating between 0.021 and 0.066°C/year [as also observed in Juza and Tintoré (2021)]. MHWs may also vary in spatial extent, locally confined or broadly distributed in sub-regions (Olita et al., 2007) or ocean basins (Lee et al., 2010), differing in surface and deep layers (Darmaraki et al., 2019), depending on processes that cause and maintain them as well as the geometry of regions (Holbrook et al., 2020). The global average of MHW intensity, duration and frequency increased from 1982 to 2016 with a trend of 0.085°C, 1.3 days and 0.45 annual event per decade, respectively (Oliver et al., 2018). In the eastern Mediterranean, the sub-basin average of the MHW frequency trend increased by 1.2 events per decade over 1982–2020 (Ibrahim et al., 2021). The authors also observed local MHW duration and maximum intensity trends reaching values up to 10 days and 0.25°C per decade, respectively. Maps of annual or period-averaged MHW characteristics in the Mediterranean also highlighted strong spatial variability in MHWs associated with local or sub-regional responses to climate change (Bensoussan et al., 2019; Darmaraki et al., 2019).
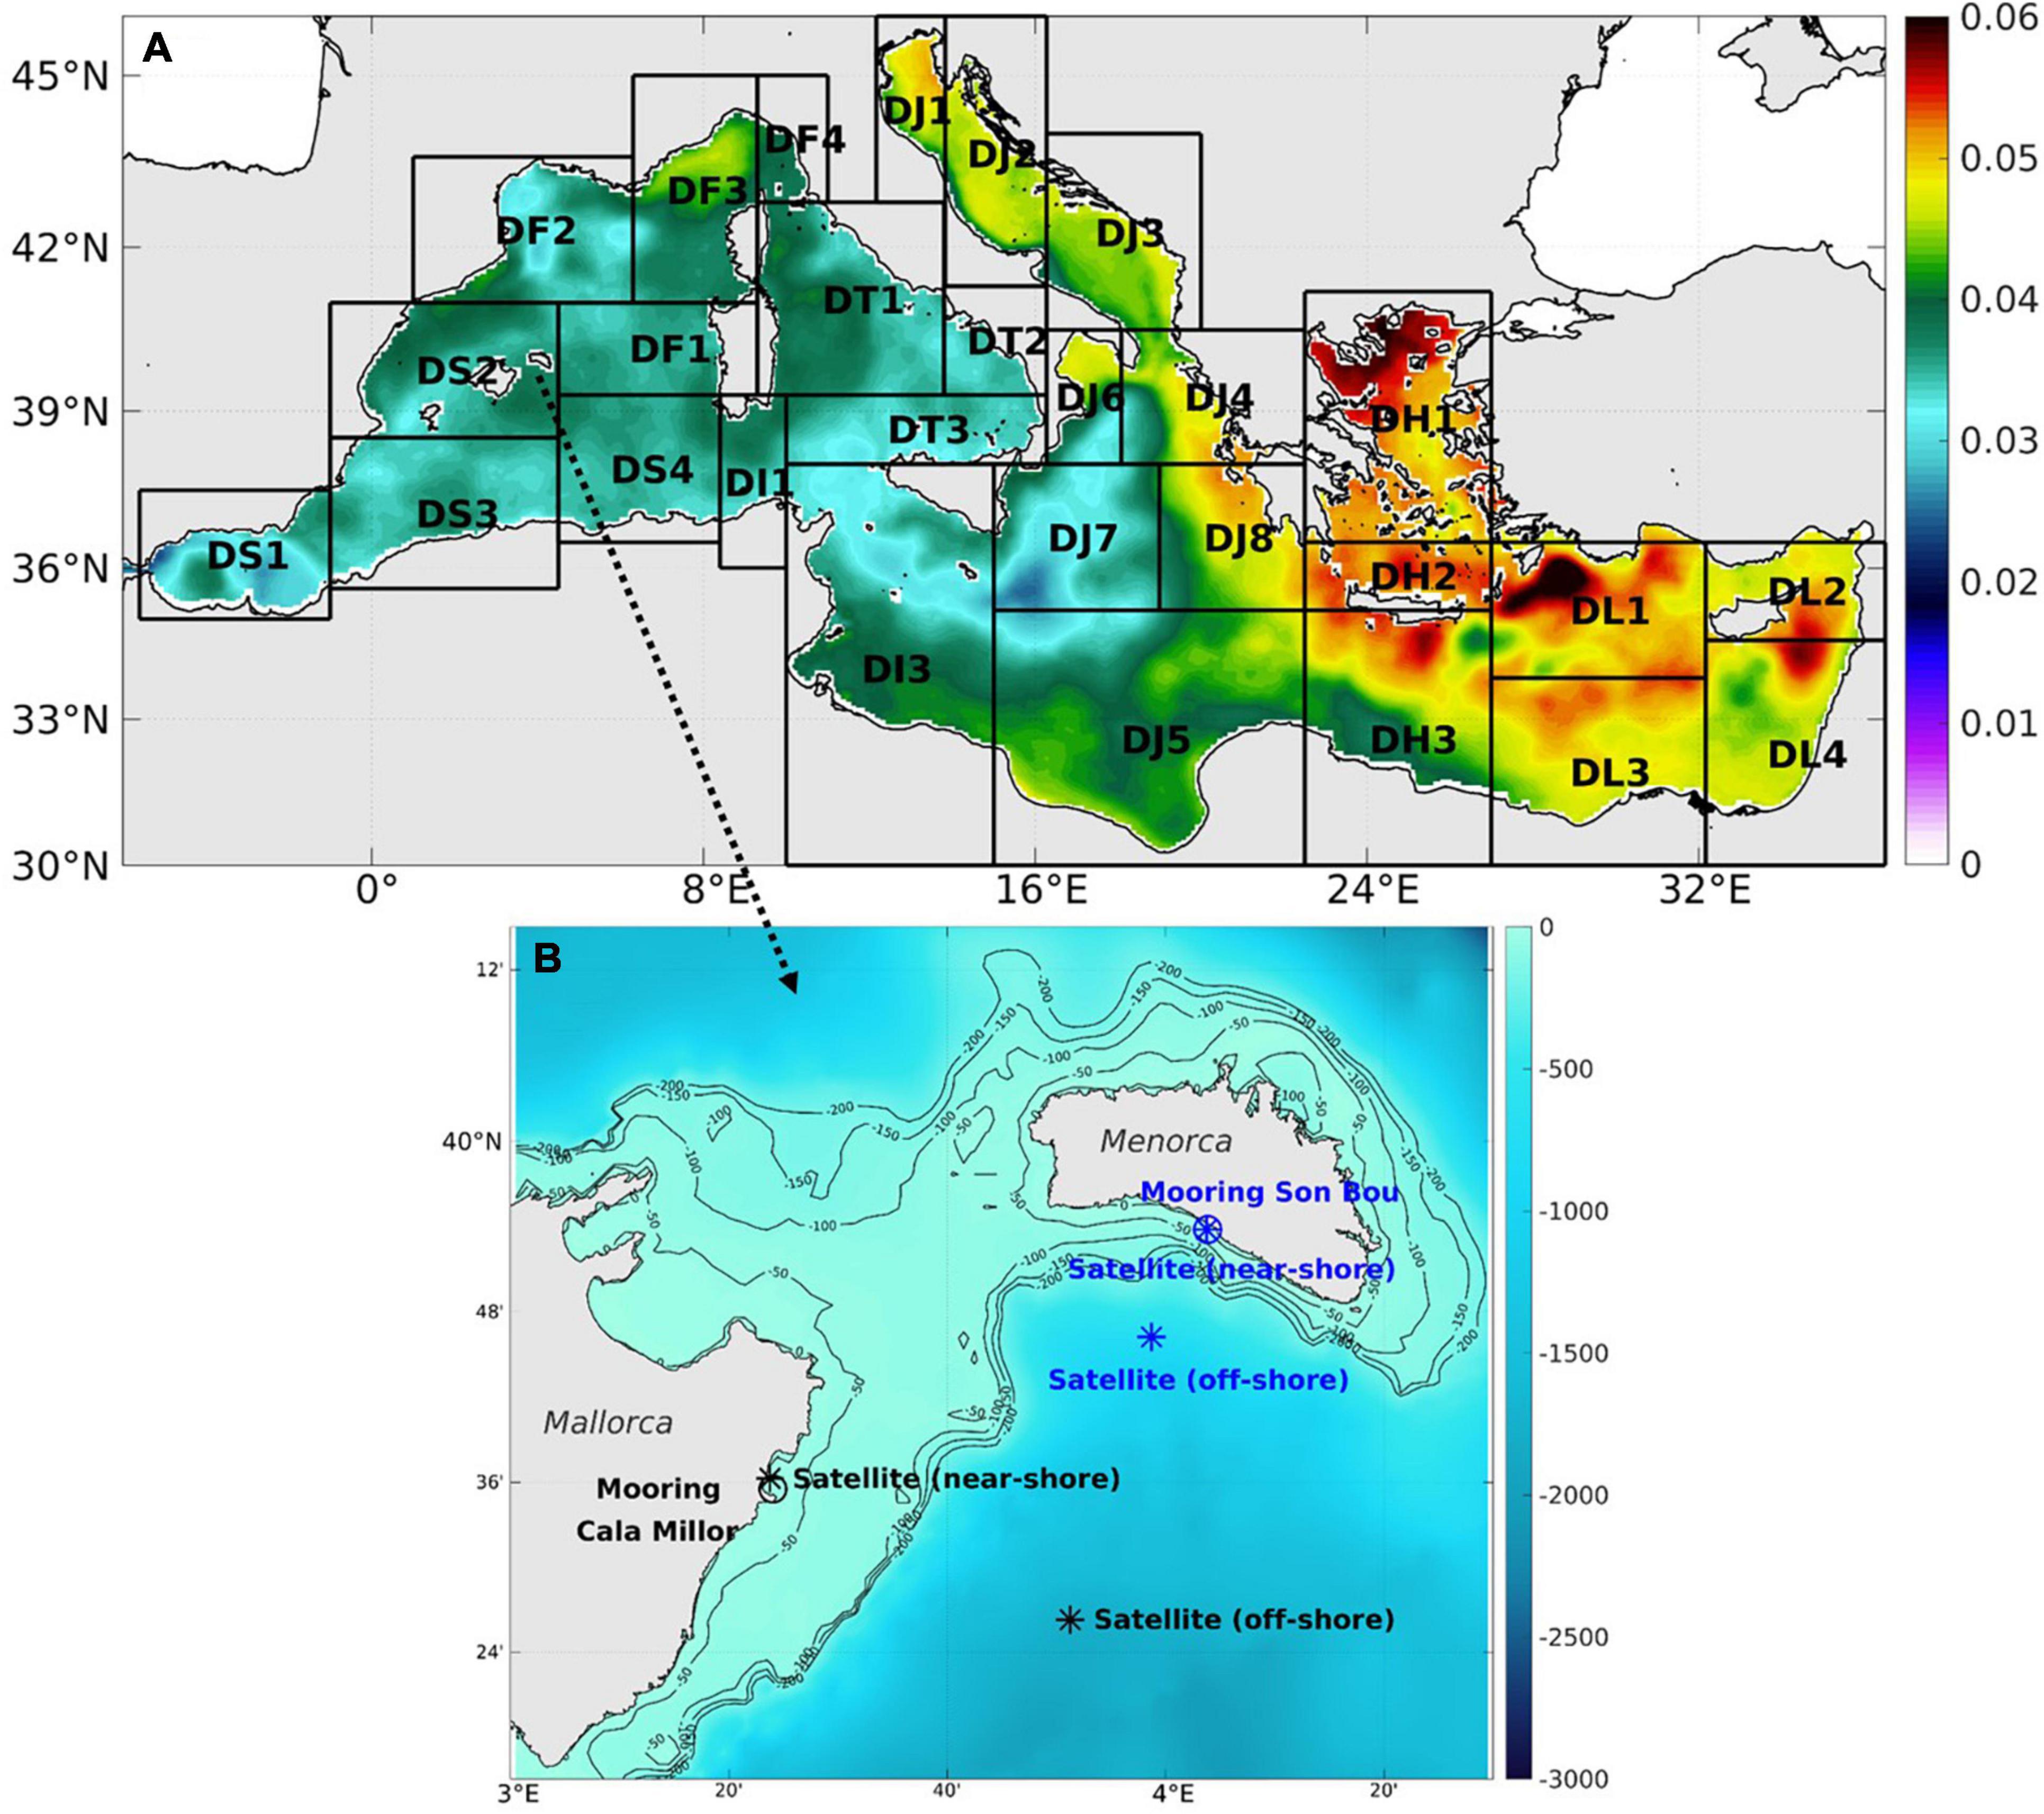
Figure 1. (A) Linear trend estimations of SST over 1982–2020 in the Mediterranean Sea (in °C/year) with sub-regions as defined by Manca et al. (2004). (B) Zoom in the sub-region [DS2]: bathymetry (in m) (from Smith and Sandwell, 1997) with moorings at Cala Millor (at 39.59°N – 3.4°E, black circle) and Son Bou (at 39.9°N – 4.06°E, blue circle), and their closest near-shore (at 39.6°N – 3.4°E and 39.9°N – 4.06°E, respectively) and off-shore (at 39.44°N – 3.85°E and 39.77°N – 3.98°E, respectively) grid points from satellite product (stars).
Therefore, in order to properly estimate the long-term variations of the MHW characteristics in the Mediterranean Sea, they are computed in the different sub-regions of the ocean basin, as defined by Manca et al. (2004) (Table 1 and Figure 1A). These sub-regions have been distinguished accordingly to the schematic representation of the upper sub-basin scale dynamics from Millot (1999) for the western Mediterranean (WMed), from Robinson et al. (1991) and Malanotte-Rizzoli et al. (1999) for the eastern Mediterranean (EMed) and from Mosetti (1983) for the Adriatic Sea. Advective processes prevail in some sub-regions. Other sub-regions are mostly affected by convective mixing, in particular winter convection that plays a major role in vertical water column homogenization such as in the Gulf of Lion, South Adriatic, Cretan Sea and Rhode Gyre (Pinardi et al., 2015; Testor et al., 2018). These sub-regions also allow taking into consideration the spatial variability of the surface ocean warming rate in response to global change (Figure 1A).
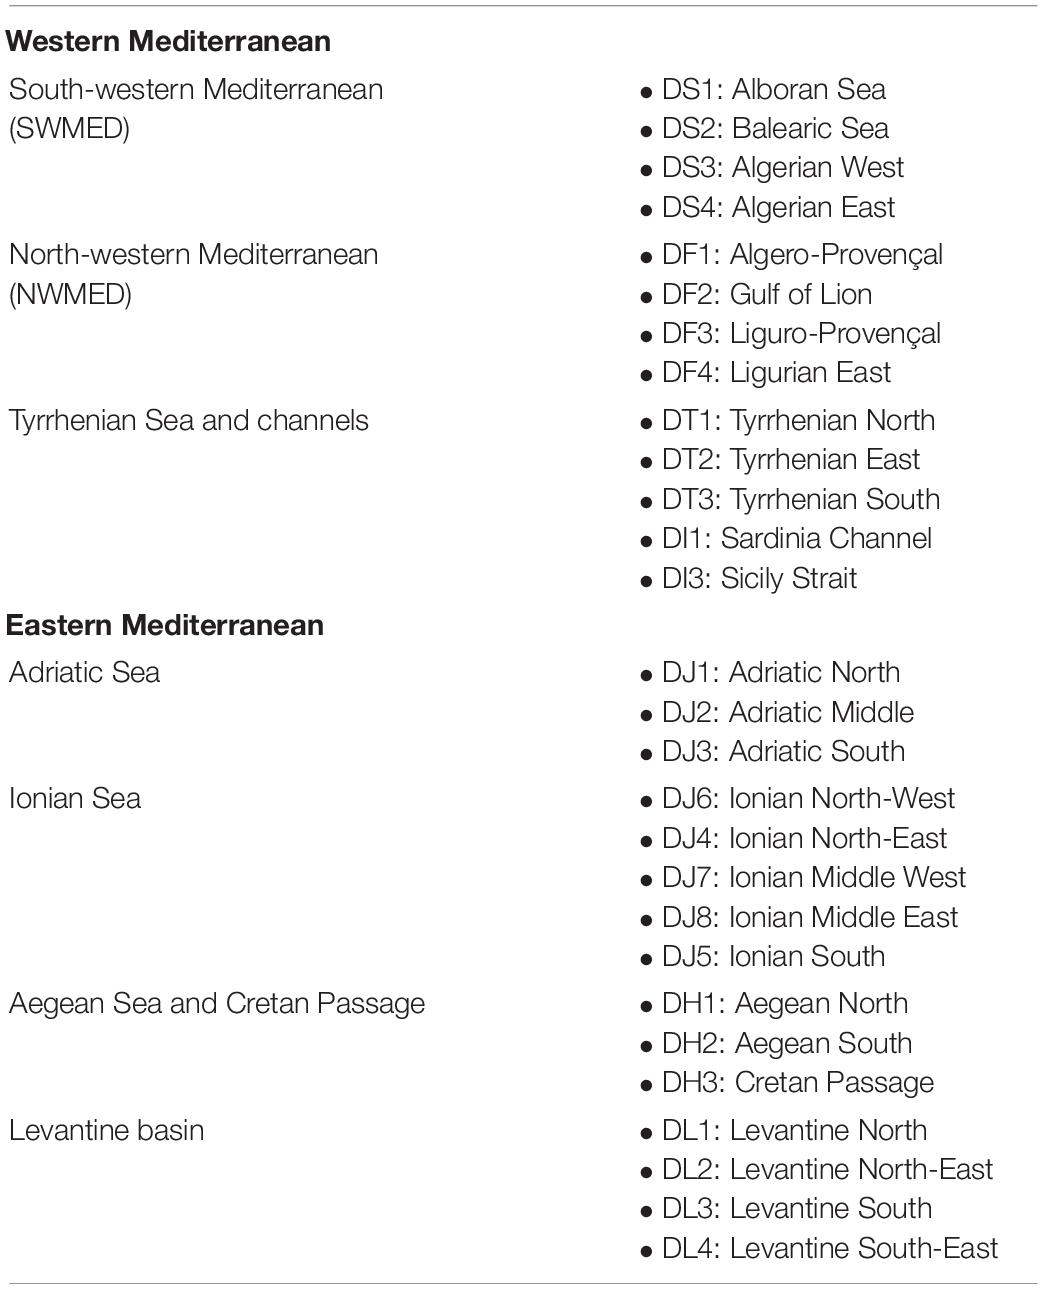
Table 1. Sub-regions in the Mediterranean Sea [as defined by Manca et al. (2004)].
Data and Methodology
Marine Heat Wave Identification
39-Year Satellite Products
Marine heat waves are identified using sea surface temperature (SST) data from reprocessed (REP) and near real-time (NRT) satellite products, which are freely available and distributed by the Copernicus Marine Service1, providing the longest continuous time series of SST since 1982. The REP (SST_MED_SST_L4_REP_OBSERVATIONS_010_0212) and NRT (SST_MED_SST_L4_NRT_OBSERVATIONS_010_004_a_ V23) satellite products in the Mediterranean Sea provide optimally-interpolated estimates of SST into a regular grid (1/20° × 1/20° and 1/16° × 1/16°, respectively) at daily resolution (Buongiorno Nardelli et al., 2013; Pisano et al., 2016) over the 1982–2019 and 2020-present periods, respectively. Given the quality of the NRT product4 and its good agreement with the REP product in MHW detection over recent years (not shown), it is used to extend the period of study in recent year(s) in order to provide timely ocean temperature information to diverse stakeholders. The daily REP product is also used to build the climatologies that are used to compute anomalies and MHWs. The long-term changes of MHW characteristics are analyzed over the period 1982–2020 using the period 1982–2015 as reference for the daily climatologies (Juza and Tintoré, 2021). Since the proposed study aims at both detecting sub-regional MHWs in the recent and future years and providing information about the long-term variability, the reference period chosen starts as early as possible (in 1982 for the satellite SST) and ends in 2015 (discarding the recent years to be compared between themselves with a common independent reference). The 1982–2015 reference period for the climatologies also allows being aligned with the methodology applied for the sub-regional indicators recently developed in the Mediterranean Sea (Juza and Tintoré, 2021).
Marine Heat Waves
Marine heat waves occur when ocean temperatures are much warmer than normal during a prolonged period. Hobday et al. (2016) characterize as marine heat spike (MHS) SST that exceeds a threshold value. The latter is computed as being the daily 90th percentile of the local SST distribution over a long-term reference period. MHWs correspond to the MHSs lasting at least five consecutive days. Following the definition from Hobday et al. (2016), MHWs are identified at daily scale with respect to the 1982–2015 reference period. As in the methodology of Hobday et al. (2016), two successive MHW events with 2-day or less time break will be considered as a continuous event. This also allows discarding the unrealistic jumps in regional SST time series due to sparse erroneous daily interpolated data in the NRT product. Finally, as recommended by the authors to extract useful climatologies from inherently variable data, the daily climatological mean and threshold time series are smoothed using a 30-day moving window.
In addition, MHW indices have been defined to estimate long-term changes in MHW characteristics over the last four decades from 1982 to 2020. In particular, for each year, the following MHW metrics are computed: mean and maximum intensities above the threshold, mean duration and number of discrete events. The seasonal component of MHW characteristics will be also addressed applying the same approach to each season of every year independently over the whole period. The seasons are defined as follows: winter (January, February, and March), spring (April, May, and June), summer (July, August, and September) and autumn (October, November, and December). The spatio-temporal variations of the above-mentioned MHW indices will be comprehensively analyzed. Moreover, some key numbers of MHW total days will be also provided as interesting indicators for ecosystem stressor, although this metric is an aggregation of MHW duration and frequency.
Web-Based Visualization Tool
The needs for reliable, available and timely information about climate change-related events are increasing for the coastal communities and those dependent on coastal regions. The development of smart platforms, which can rapidly communicate information and warning to users, is largely enabled by the Copernicus Marine Service which provides full, free and open access to historical and NRT data. In this context, the Balearic Islands Coastal Observation and Forecasting System (SOCIB) has implemented a visualization tool to provide continuous information on the ocean temperature state and variability at sub-regional scale, detecting MHWs through the daily monitoring of SST (see Section “Daily Monitoring”), following their evolution through annual indices (see Section “Annual Indices”) and their temporal variations since 1982 (see Section “From Seasonal to Decadal Variability”). This user-friendly interface is available at https://apps.socib.es/subregmed-marine-heatwaves/ and is automatically updated every day for the daily monitoring and every year for the annual MHW indices.
Marine Heat Wave Profiles
9-Year Profiling Floats
To analyze the depth extent of MHWs, quality-controlled hydrographic profiles from profiling floats are extracted from the EN4.2.1 dataset5 (Gouretski and Reseghetti, 2010; Good et al., 2013), which is freely available and distributed by Met-Office, providing temperature and salinity profiles in the Mediterranean Sea from 5 to 2,000 m depth. The Mediterranean basin is globally covered by profiling floats that sample all sub-regions since 2012 (not shown), with an increasing number of profiles over the period 2012–2020 varying between 2,397 and 10,683 profiles per year (Figure 2A). Hence, the hydrographic profiles over 2012–2020 are used to investigate the MHW vertical propagation into the ocean interior.
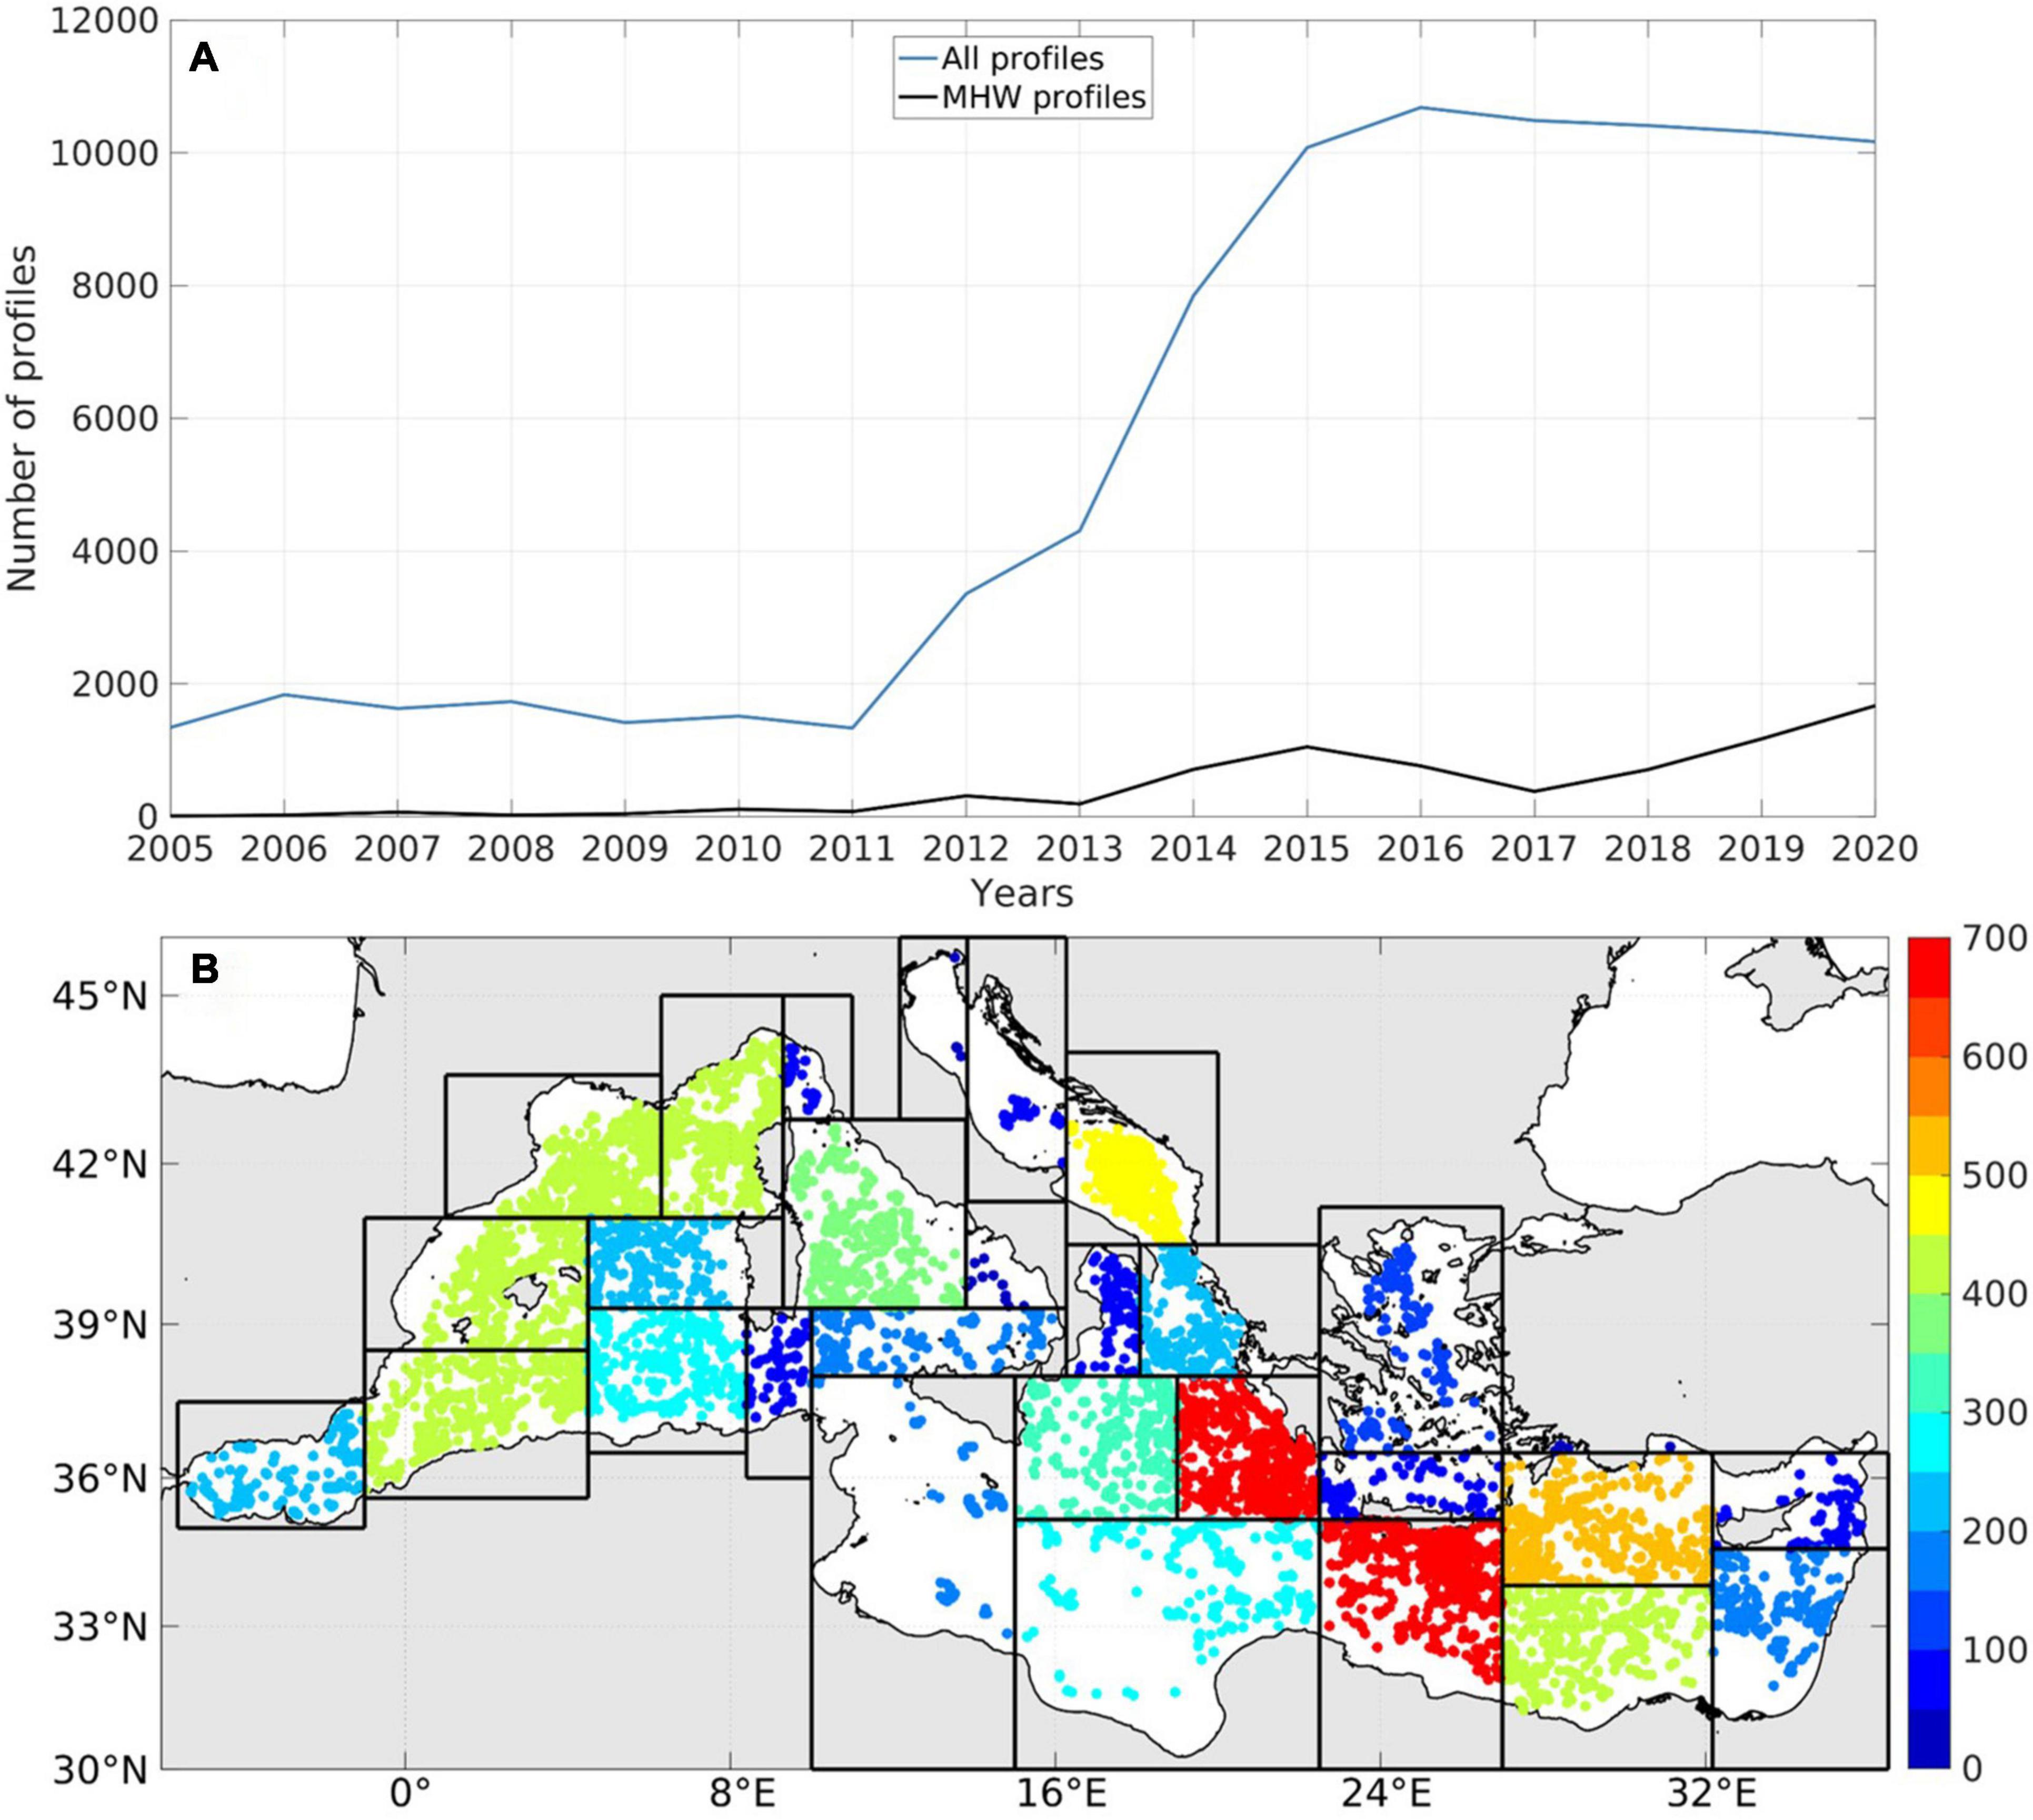
Figure 2. (A) Annual number of hydrographic profiles from profiling floats available in the whole Mediterranean (blue line) and coinciding to MHW events (black line) from 2005 to 2020. (B) Locations of profiles coinciding with MHW over the period 2012–2020. The color indicated the sub-regional number of MHW profiles over 2012–2020.
SeaDataNet Climatology and Anomaly Profiles
Temperature (T), salinity (S), and density (ρ) anomaly profiles (Ta, Sa, and ρa, respectively) are computed using the SeaDataNet6 SDC_MED_CLIM_TS_V2 product7, in particular the monthly climatology of T and S for the Mediterranean Sea over the period 1985–2018. This product is interpolated into a regular grid of 0.125° × 0.125° spatial resolution with 92 vertical levels from surface to 5,000 m depth. By linear interpolation, the climatological T, S, and ρ profiles (Tclim, Sclim, and ρclim, respectively) are computed for every in situ profile. Then, Ta, Sa, and ρa are computed such as Ta(z) = T(z) − Tclim(z), Sa(z) = S(z) − Sclim(z), and ρa(z) = ρ(z)-ρclim(z), where z is the depth from the climatology.
Marine Heat Wave Anomaly Profiles
Since the climatology profiles from SeaDataNet are built using the 1985–2018 period, local MHWs are also identified from satellite products using the 1985–2018 reference period, following the methodology from Hobday et al. (2016) described in Section “Marine Heat Waves,” over the period 2012–2020 for their joint analysis with profiling floats. Then, T, S, and ρ profiles are identified as MHW profiles when coinciding in time and space with MHW as detected at surface from the satellite products, more precisely, when the nearest time (day) and location (longitude and latitude) grid point of satellite SST has been locally identified as MHW.
To remove inconsistent profiles, additional tests have been applied to reject MHW profiles with negative surface temperature anomaly that would contradict the positive anomaly which is indicated by the satellite SST field (Elzahaby and Schaeffer, 2019). 1,705 out of 6,973 MHW profiles have been rejected. Between 193 and 1,672 MHW profiles per year were extracted from 2012 to 2020, representing between 3.6 and 16.4% of the annual total number of profiles in the Mediterranean. The total of MHW anomaly profiles which are available over 2012–2020 in the whole Mediterranean (Figure 2B) represent approximately 9% of all profiles. Moreover, the satellite SST used to detect MHW events and the most surfacing temperature measurements in profiles are highly correlated (0.99) with a mean absolute error (0.38°C) that is likely due to differences in instrumentation, product resolution and more importantly depth of measurement (68% of the shallowest measurements along the selected MHW profiles being at 5 m, 28% at 10 m and 3% at 25 m).
The sub-regional distributions of Ta, Sa, and ρa profiles are characterized by their median to estimate the vertical propagation of MHW. This statistical approach is appropriate since the distributions of ocean hydrographic properties are not Gaussian (Vargas-Yáñez et al., 2020; Juza and Tintoré, 2021). Note that the median estimations are computed when a minimum of three profiles are available in the sub-regions.
Stratification Changes
Several methodologies have been established to define the upper-ocean stratification such as the Stratification Index (Herrmann et al., 2010; Somot et al., 2018), Convective Resistance (Frajka-Williams et al., 2014) or density difference between the surface and fixed sub-surface depth (Coma et al., 2009; Capotondi et al., 2012; Fu et al., 2016). In this study, in order to have a more widely applicable indicator of change in the upper-ocean temperature, salinity and density stratifications in various dynamical sub-regions, the vertical gradients of Ta, Sa, and ρa between the surface and sub-surface are used to characterize the upper-ocean stratification changes induced by MHW events in the Mediterranean at sub-regional scale. More precisely, the upper-ocean stratification is defined here as the difference between the surface and 150 m depth, which is indicative of the degree of decoupling between the surface and deeper oceans, with important consequences for many biogeochemical processes (e.g., nutrient fluxes between the euphotic zone and ocean interior) (Capotondi et al., 2012; Fu et al., 2016). In the Mediterranean Sea, the 150 m depth is representative of the separation between the surface to intermediate water masses (Robinson et al., 2001; Vargas-Yáñez et al., 2021). The upper 150 m of the ocean is also the layer which strongly and rapidly interacts with the atmosphere and where primary productivity is observed (Lavigne et al., 2015). Although the 150 m depth is below the mixed layer in strongly stratified sub-regions and within the mixed layer in weakly stratified sub-regions, the vertical gradients between the surface and 150 m are useful indicators of changes in the upper ocean in response to global warming and extremely warm events that are modifying ocean properties, affecting marine ecosystems and intensifying storms. The upper-ocean stratification changes in T, S, and ρ are computed here for every MHW anomaly profile as being the difference between the shallowest and 150 m depth measurements along the profile such as Tstratification=Ta150m −tashallowest, Sstratification = Sa150m−Sashallowest, and ρstratification = ρa150m−ρashallowest.
Near-Shore Coastal Marine Heat Waves
Fixed Moorings
As part of the systematic and continuous beach monitoring program at SOCIB, Nortek AWACs (Acoustics Wave And Current) have been deployed along the coasts of the Balearic Islands since 2011 (Tintoré et al., 2013), in particular at the Cala Millor and Son Bou beaches (Figure 1B). Cala Millor is located along the north-eastern coast of Mallorca Island. It is a 1.7 km long micro-tidal semi-embayed anthropized beach. In terms of coastal morphodynamics, it is an intermediate beach with highly variable longitudinal sinuous-parallel bars and troughs, related to wave-driven currents dynamics (Álvarez-Ellacuria et al., 2011; Gómez-Pujol et al., 2011) and a system of three submerged canyons that merge at 20 m depths. The beach face is open to the east and well exposed to north-northwest to southeast incoming waves (Tintoré et al., 2009; Enríquez et al., 2017). Son Bou beach is located along the southern coast of Menorca Island. It is a 4 km micro-tidal long-shore natural beach that comprises a complex system of small morphodynamic cells separated by natural tombolos, shallow rocky outcrops and a sand-barred lagoon. It is open to the south and well exposed to southwest to southeast incoming waves (Enríquez et al., 2019).
At both beaches, two AWACs have been installed near-shore at 17 m depth, both being equipped with a temperature sensor, measuring hourly near-bottom water temperatures8. For the two monitoring site time series, daily means from in situ data are computed over the period 2012–2020. Then, the daily 90th percentile climatologies are built using the 2012–2020 reference period and used for the MHW identification. Although the in situ timeseries are shorter than the recommended 30-year minimum for the characterization of MHWs (Hobday et al., 2016), there is a benefit of using in situ data as a complement of satellite products since they provide a more accurate representation of the thermal characteristics in the near-shore environment (Schlegel et al., 2017a). The calculation of MHWs from in situ data using their own climatologies allows quantifying the amount they differ from their localities (Schlegel et al., 2017b).
Marine Heat Wave in Near-Shore Coastal Waters
Local MHWs are identified from the in situ measurement time series at Cala Millor and Son Bou beaches over the period 2012–2020 with respect to the 2012–2020 reference period, following the same methodology as described in Section “Marine Heat Waves.” For the joint analysis with satellite products, local satellite data are extracted over 2012–2020 from the closest grid point to the monitoring site and from the off-shore grid point (Figure 1B). Satellite MHWs are then detected from the near-shore and off-shore time series using their respective 90th percentile climatologies over the 2021–2020 reference period as performed for the mooring.
Sub-Regional Marine Heat Waves
Daily Monitoring
Through the developed monitoring system, daily SST, SST anomaly (SSTA) and MHS are displayed every day for the last available day providing the last ocean temperature state in the Mediterranean (Figure 3). SSTA and MHS are computed using the daily climatologies of local mean and threshold, respectively, established over the period 1982–2015. The MHS value is equal to 0 when the SST value is smaller than the threshold. The positive value, which indicates the MHS event, is the difference between the SST and threshold values. Time series of daily SST averaged in the different sub-regions of the Mediterranean are displayed for the current year, as well as the daily mean and threshold climatologies. Every day, the time series is updated extending to the last available day. When the SST value becomes higher than the threshold, a yellow shadow is drawn to automatically warn about the MHS event. Figure 4 shows the time series in 2020 for three sub-regions, the Gulf of Lion [DF2] in the WMed, north Adriatic Sea [DJ1] and Levantine South-East sub-basin [DL4] in the EMed.
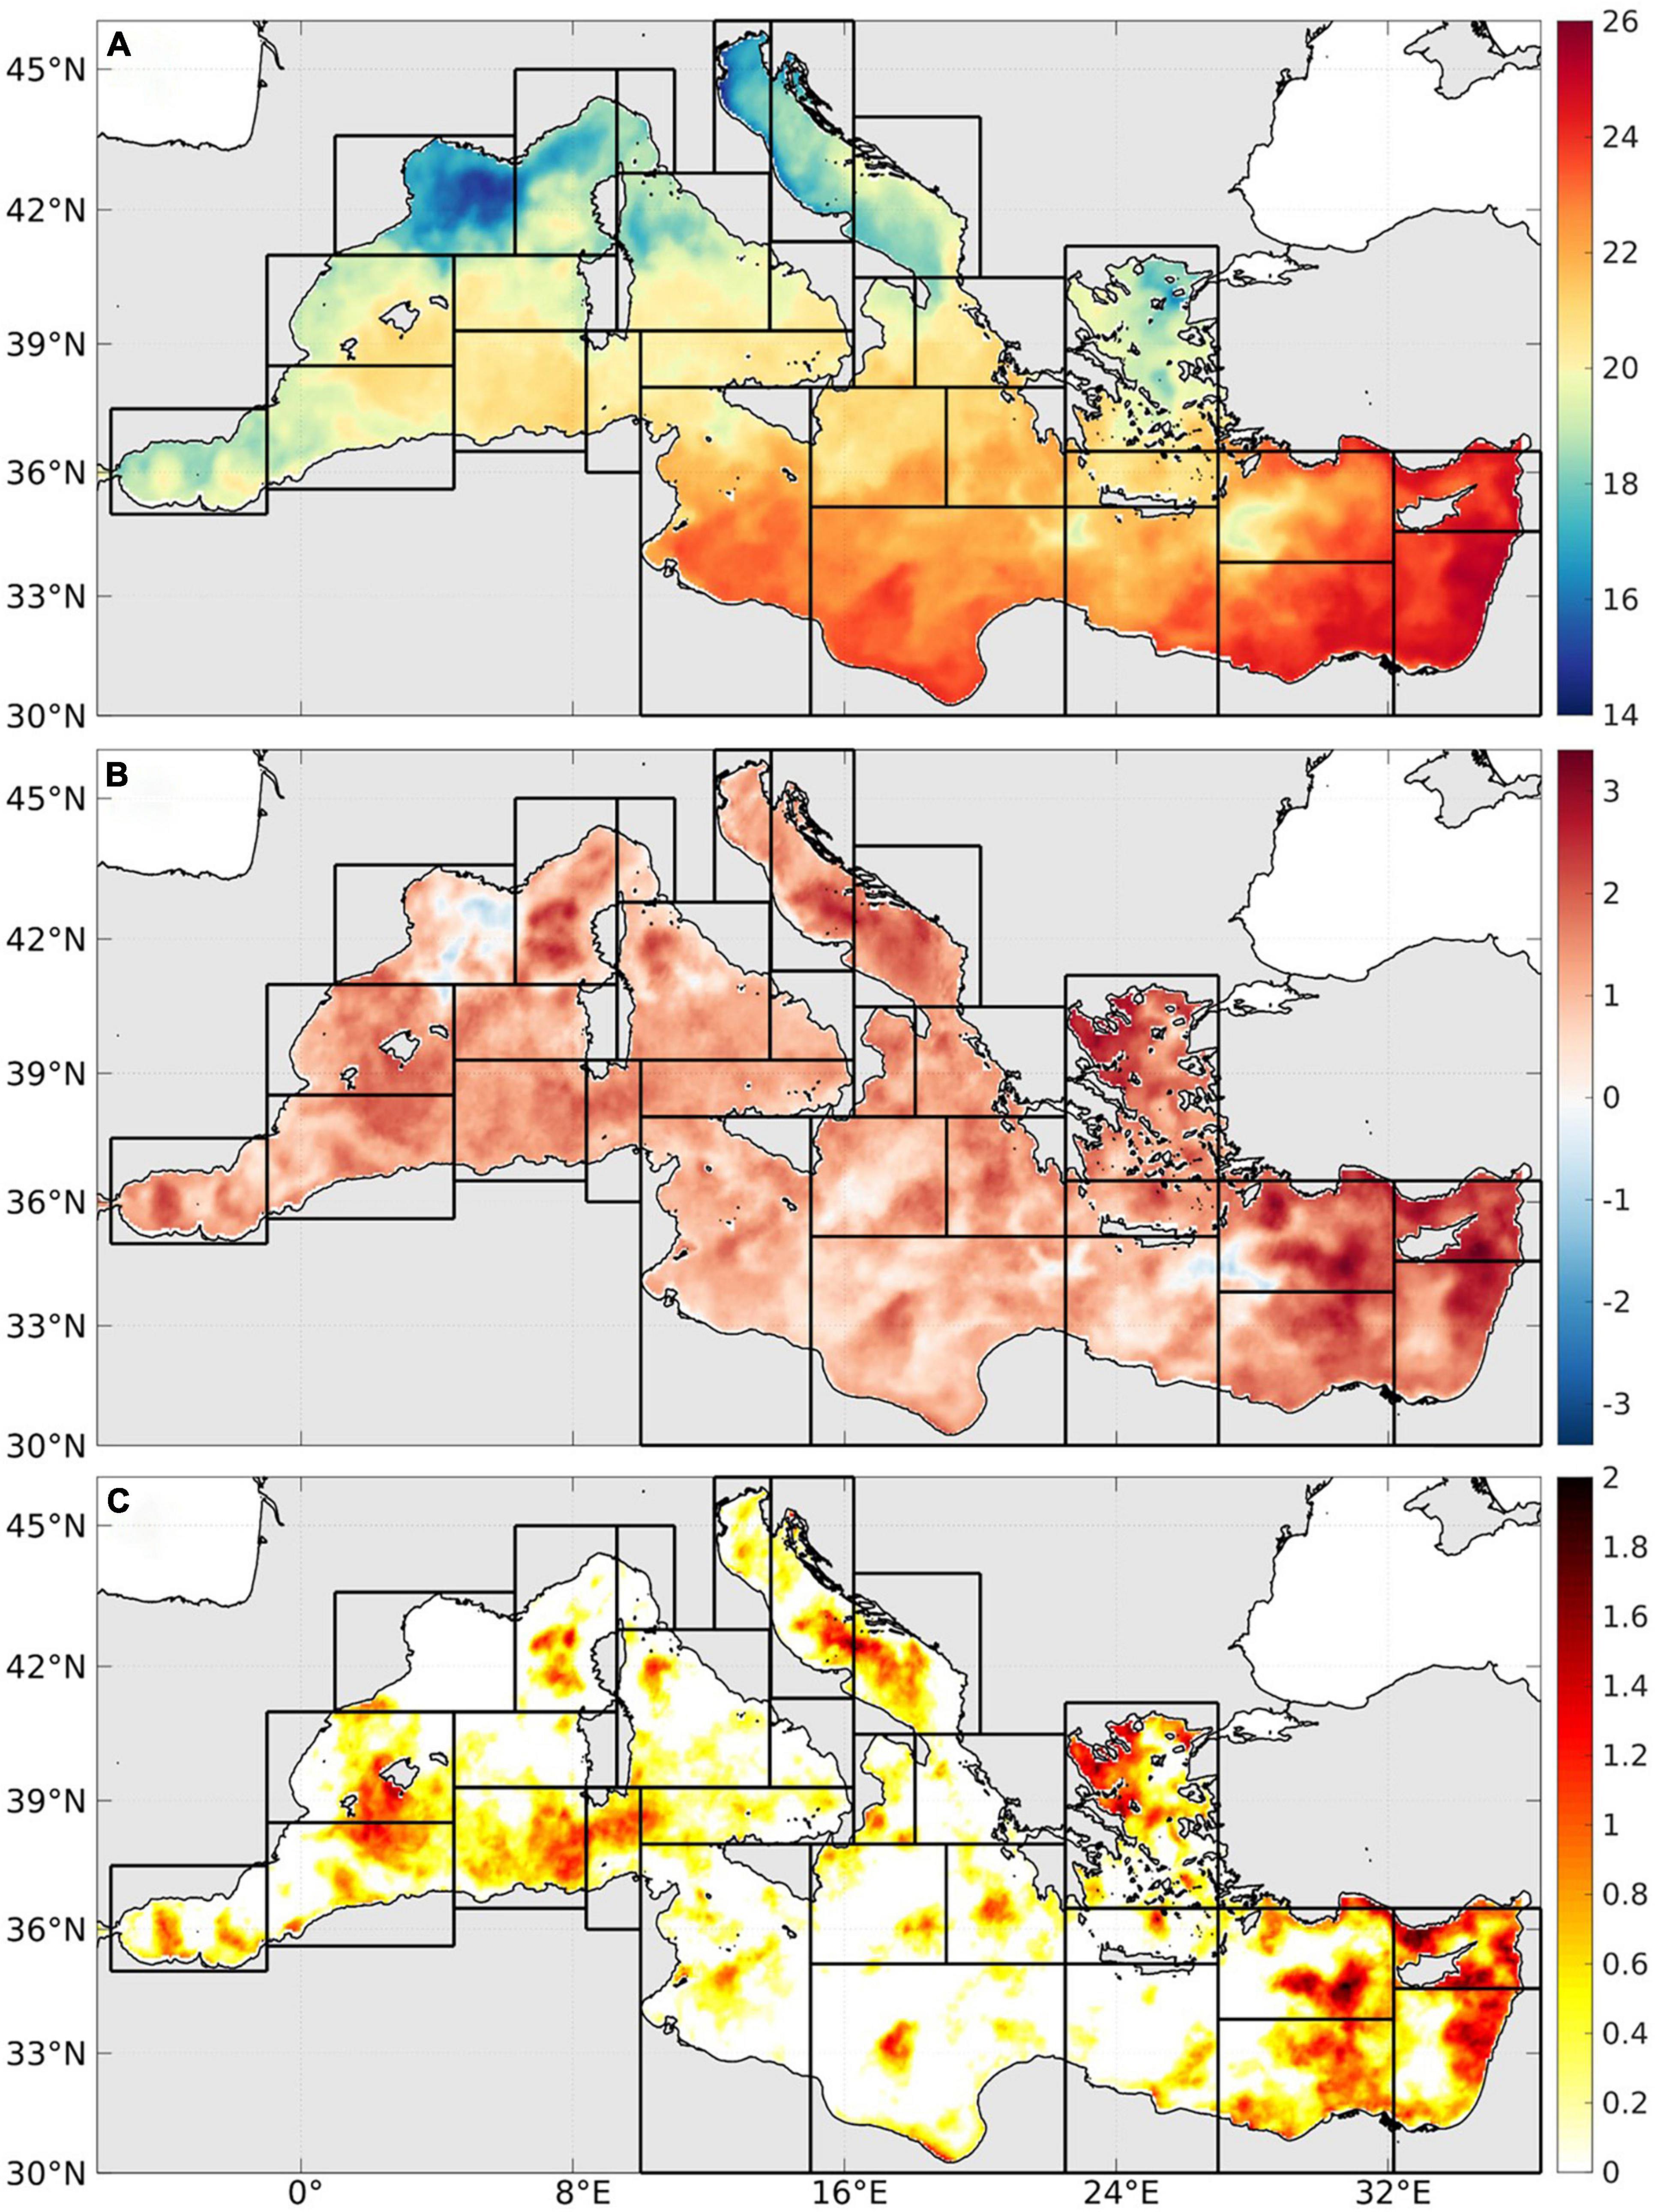
Figure 3. Daily SST (A), SSTA (B), and MHS (C) in the Mediterranean Sea (in °C). Illustration on November 17, 2020.
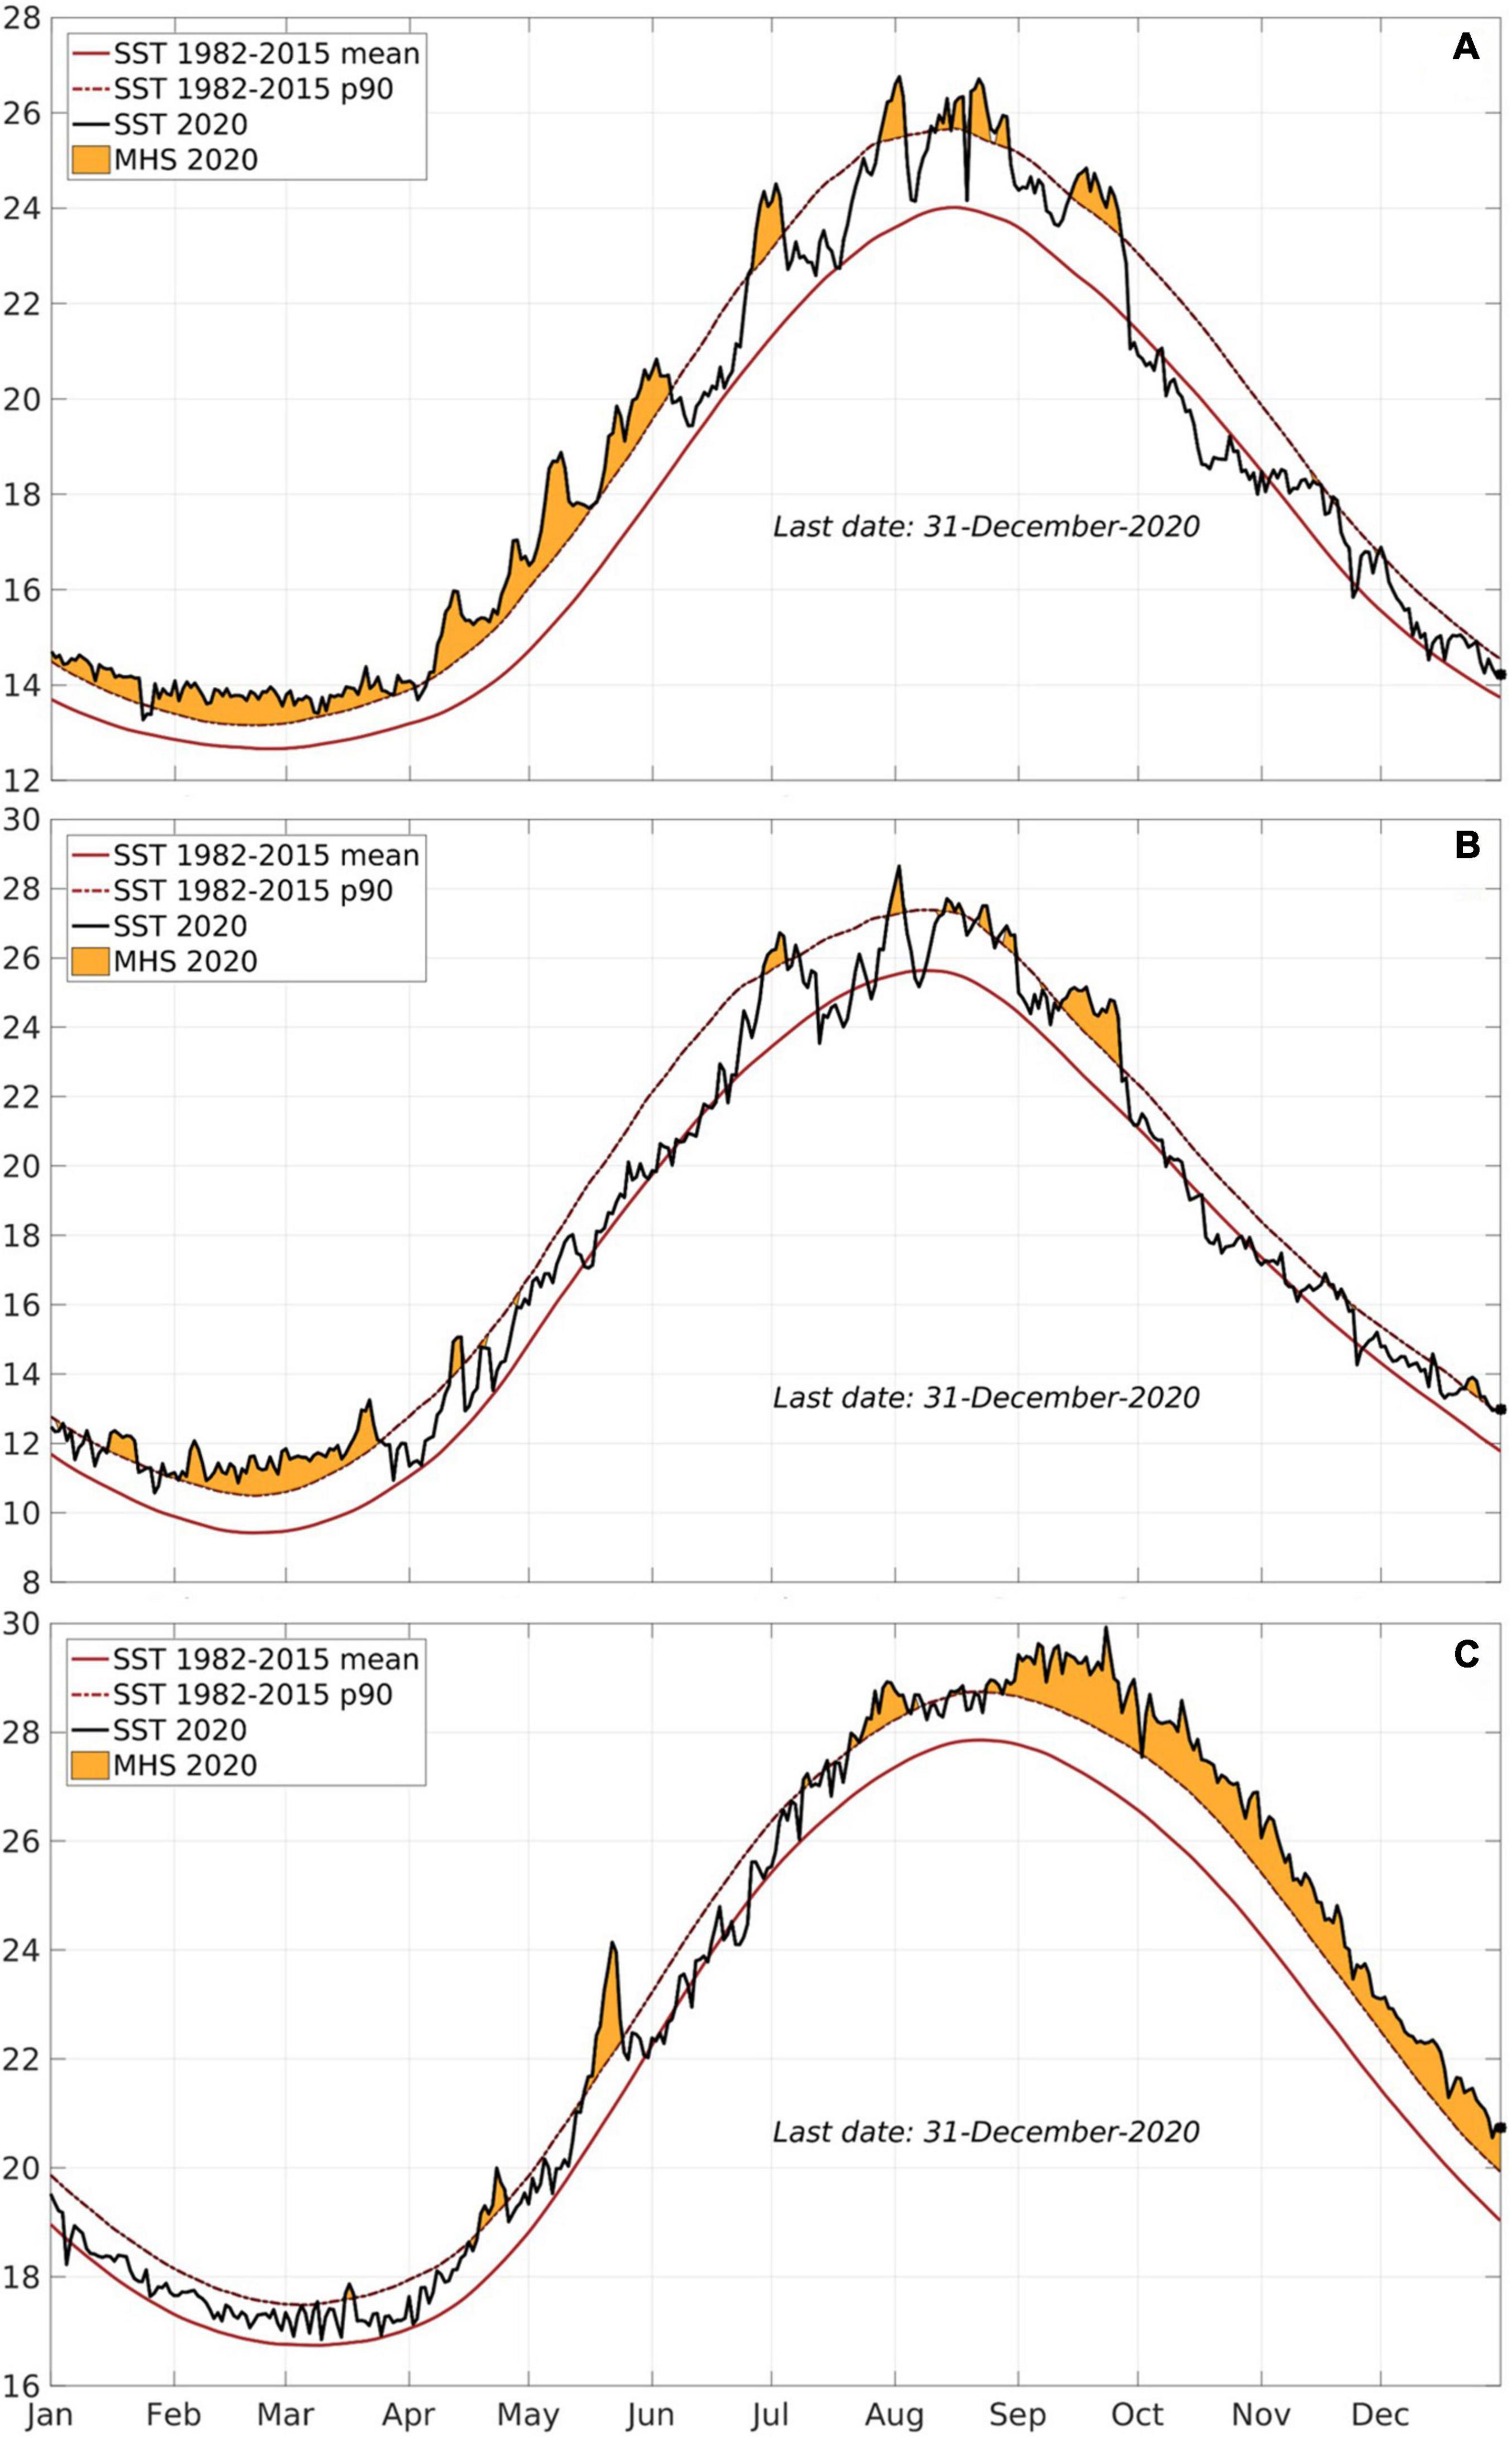
Figure 4. Sub-regionally integrated time series of daily SST with MHS highlighted in the Gulf of Lion [DF2] (A), North Adriatic [DJ1] (B), and Levantine South-East basin [DL4] (C) as observed in 2020, and of daily mean and 90th percentile climatologies.
The year 2020 shows important episodes of MHWs in both the WMed, Adriatic Sea and EMed, with particularly long-duration (several months in some sub-regions) and intense magnitude (up to 4°C) (Figure 4). In the WMed, the sub-regions experienced very strong and long-duration MHWs in particular in winter, spring and summer 2020. The north and middle WMed suffered MHWs from January/February to May 2020 with one or 2–3 successive events, with at least one lasting more than 60 days (up to 2°C above the threshold), as well as several events reaching 1–2°C in end-June/early-July, August and September 2020 (Figure 4A for the Gulf of Lion [DF2]). The south WMed experienced 40-day duration events in February–March 2020 (up to 0.5°C), as well as strong events in May, July, and August 2020 (with magnitude higher than 2°C in the Alboran Sea). In the Tyrrhenian Sea, very long-duration MHWs lasting 68–83 days occurred from January to March 2020, as well as several-week duration events in April/May, August, and September 2020. In the Adriatic Sea and EMed, all sub-regions experienced intense, long and frequent MHW events, with an unprecedented intense and long-duration event in the eastern EMed. The Adriatic Sea, north-eastern and middle-east Ionian Sea also suffered several MHWs especially from January to March 2020 with continuous 70–90-day events and intensity up to 0.5°C, and several events in summer and autumn 2020 up to 1°C (Figure 4B for the north Adriatic [DJ1]). The south Ionian Sea also experienced important MHW events in May (48-day duration), August-September (48-day duration), and October (20-day duration) 2020, while the north-western and middle-western Ionian Sea suffered MHWs in August–September 2020 during 45 and 34 days, respectively. In the Aegean Sea, very long-duration and intense MHWs occurred from January to March and from September/October to November/December 2020 (lasting 84–99 days with intensity exceeding 1°C) as well as additional events in spring/summer. Further south, in the Cretan Passage, a very intense event reaching 3°C above the threshold occurred in May 2020 and a 73-day duration event in September–October 2020. Finally, the Levantine basin suffered a very intense MHW in May (up to 4°C) as well as a very intense and very long-duration event of 125–130 days from end-August to end-December 2020 (Figure 4C for the south-east Levantine basin [DL4]).
Annual Indices
Annual MHW characteristics (mean and maximum intensities, mean duration and frequency) are computed from 1982 to 2020. The 2D maps of the MHW indices in the Mediterranean are shown for the year 2020 (Figures 5A–D) and highlight the strong sub-regional variability in the ocean basin, with major differences between the western and eastern sub-basins. Concerning the temperature characteristics, the annual mean intensity in the Mediterranean Sea in 2020 varying between 0.23 and 1.39°C above the threshold with maxima reached in the Levantine basin, Aegean Sea, north Adriatic Sea, and north WMed (Figure 5A). The annual maximum intensity in 2020 oscillates between 0.57 and 5.16°C above the threshold with maxima found in the EMed, particularly in south of Crete Island, Rhode gyre, and north Cyprus (Figure 5B). Regarding the time component, the mean duration averaged in 2020 ranges between 6.1 and 96.5 days with maxima experienced in the Gulf of Lion, north Aegean Sea and Levantine basin (Figure 5C). The number of events in 2020 varies between 2 and 14 with high numbers found in the WMed (Figure 5D). The total days of MHWs oscillates between 20 and 304, which correspond to 0.5 and 10 months, respectively, over the year 2020 (not shown). Note that the extremely high maximum of total days has been found locally along the Greek coast of the Peloponnese.
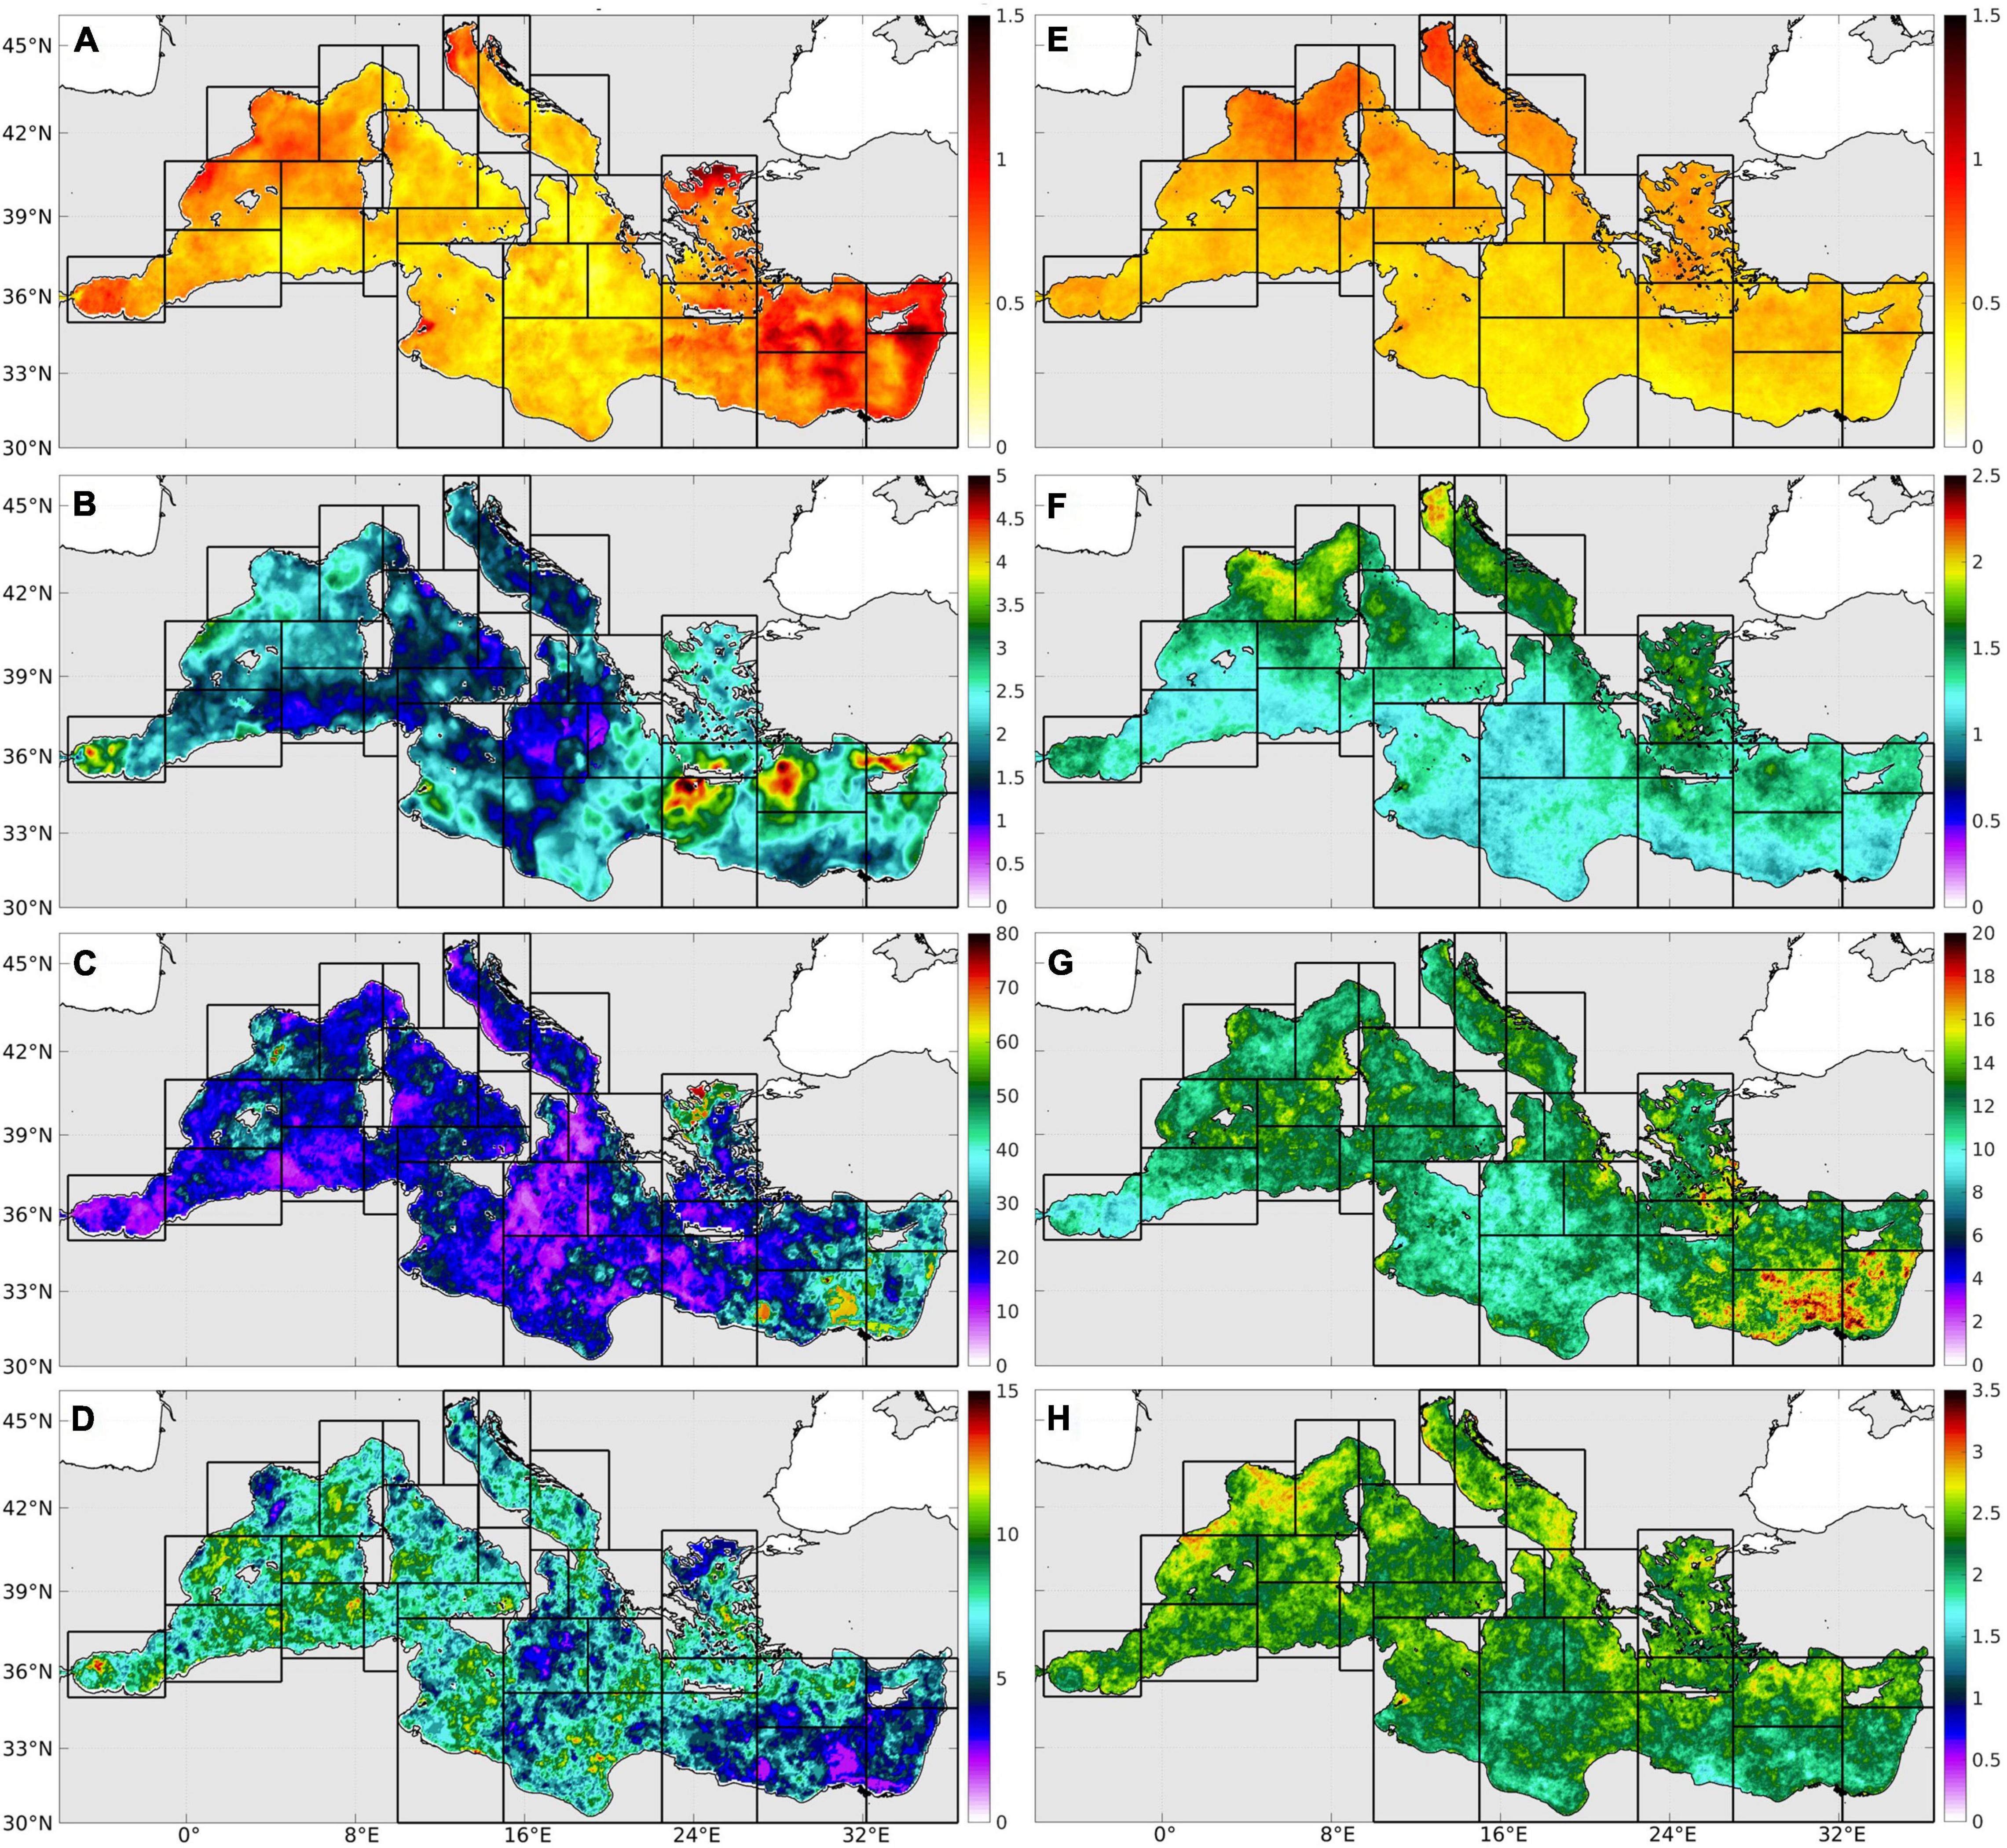
Figure 5. Annual MHW indices in 2020 (A–D) and averaged over the period 1982–2020 (E–H): mean intensity (A,E) and maximum intensity (B,F) (in °C), mean duration (C,G) (in days), and number of events (D,H).
The 2D maps of the annual MHW indices averaged over the whole period 1982–2020 (Figures 5E–H) also show a strong spatial variability in the Mediterranean Sea highlighting longitudinal and latitudinal differences in MHW characteristics. The MHW mean and maximum intensities over 1982–2020 (Figures 5E,F) shows values ranging over 0.32–0.89 and 0.88–2.26°C, respectively, and strong differences between the western and eastern Mediterranean Sea and between the northern and southern sub-basins. For both temperature indices, the maxima are found in the northern WMed (Gulf of Lion and Ligurian Sea) and Adriatic Sea (particularly in the northern sub-region); high values are also detected in the Aegean Sea. The minima are found in the southern EMed (Ionian Sea and Levantine sub-basin) for the mean intensity and in the southern Mediterranean (southern WMed, southern-middle Ionian Sea, and southern Levantine sub-basin) for the maximum intensity. The MHW mean duration over 1982–2020 (Figure 5G) oscillates between 7.7 and 22.6 days with maximum values found in the eastern Mediterranean (Levantine basin) as well as in several coastal areas of the northern WMed, Adriatic Sea and EMed (particularly in the Aegean Sea). The minimum values of MHW duration are identified in the Alboran Sea and southern Ionian Sea. The MHW frequency over 1982–2020 (Figure 5H) varies between 1.4 and 5 annual events with maximum values in the northern WMed as well as in many places of the WMed, Adriatic Sea, and EMed. The minimum values of MHW frequency are found in the southern EMed. The annual MHW total days averaged over 1982–2020 (Figure 6A) oscillates between 18 and 51 days with maxima detected in the northern WMed, Adriatic Sea, Aegean Sea, Levantine basin as well as in coastal areas (e.g., along the western, southern and north-eastern Greek coasts) and minima in the Alboran Sea and southern Ionian Sea.
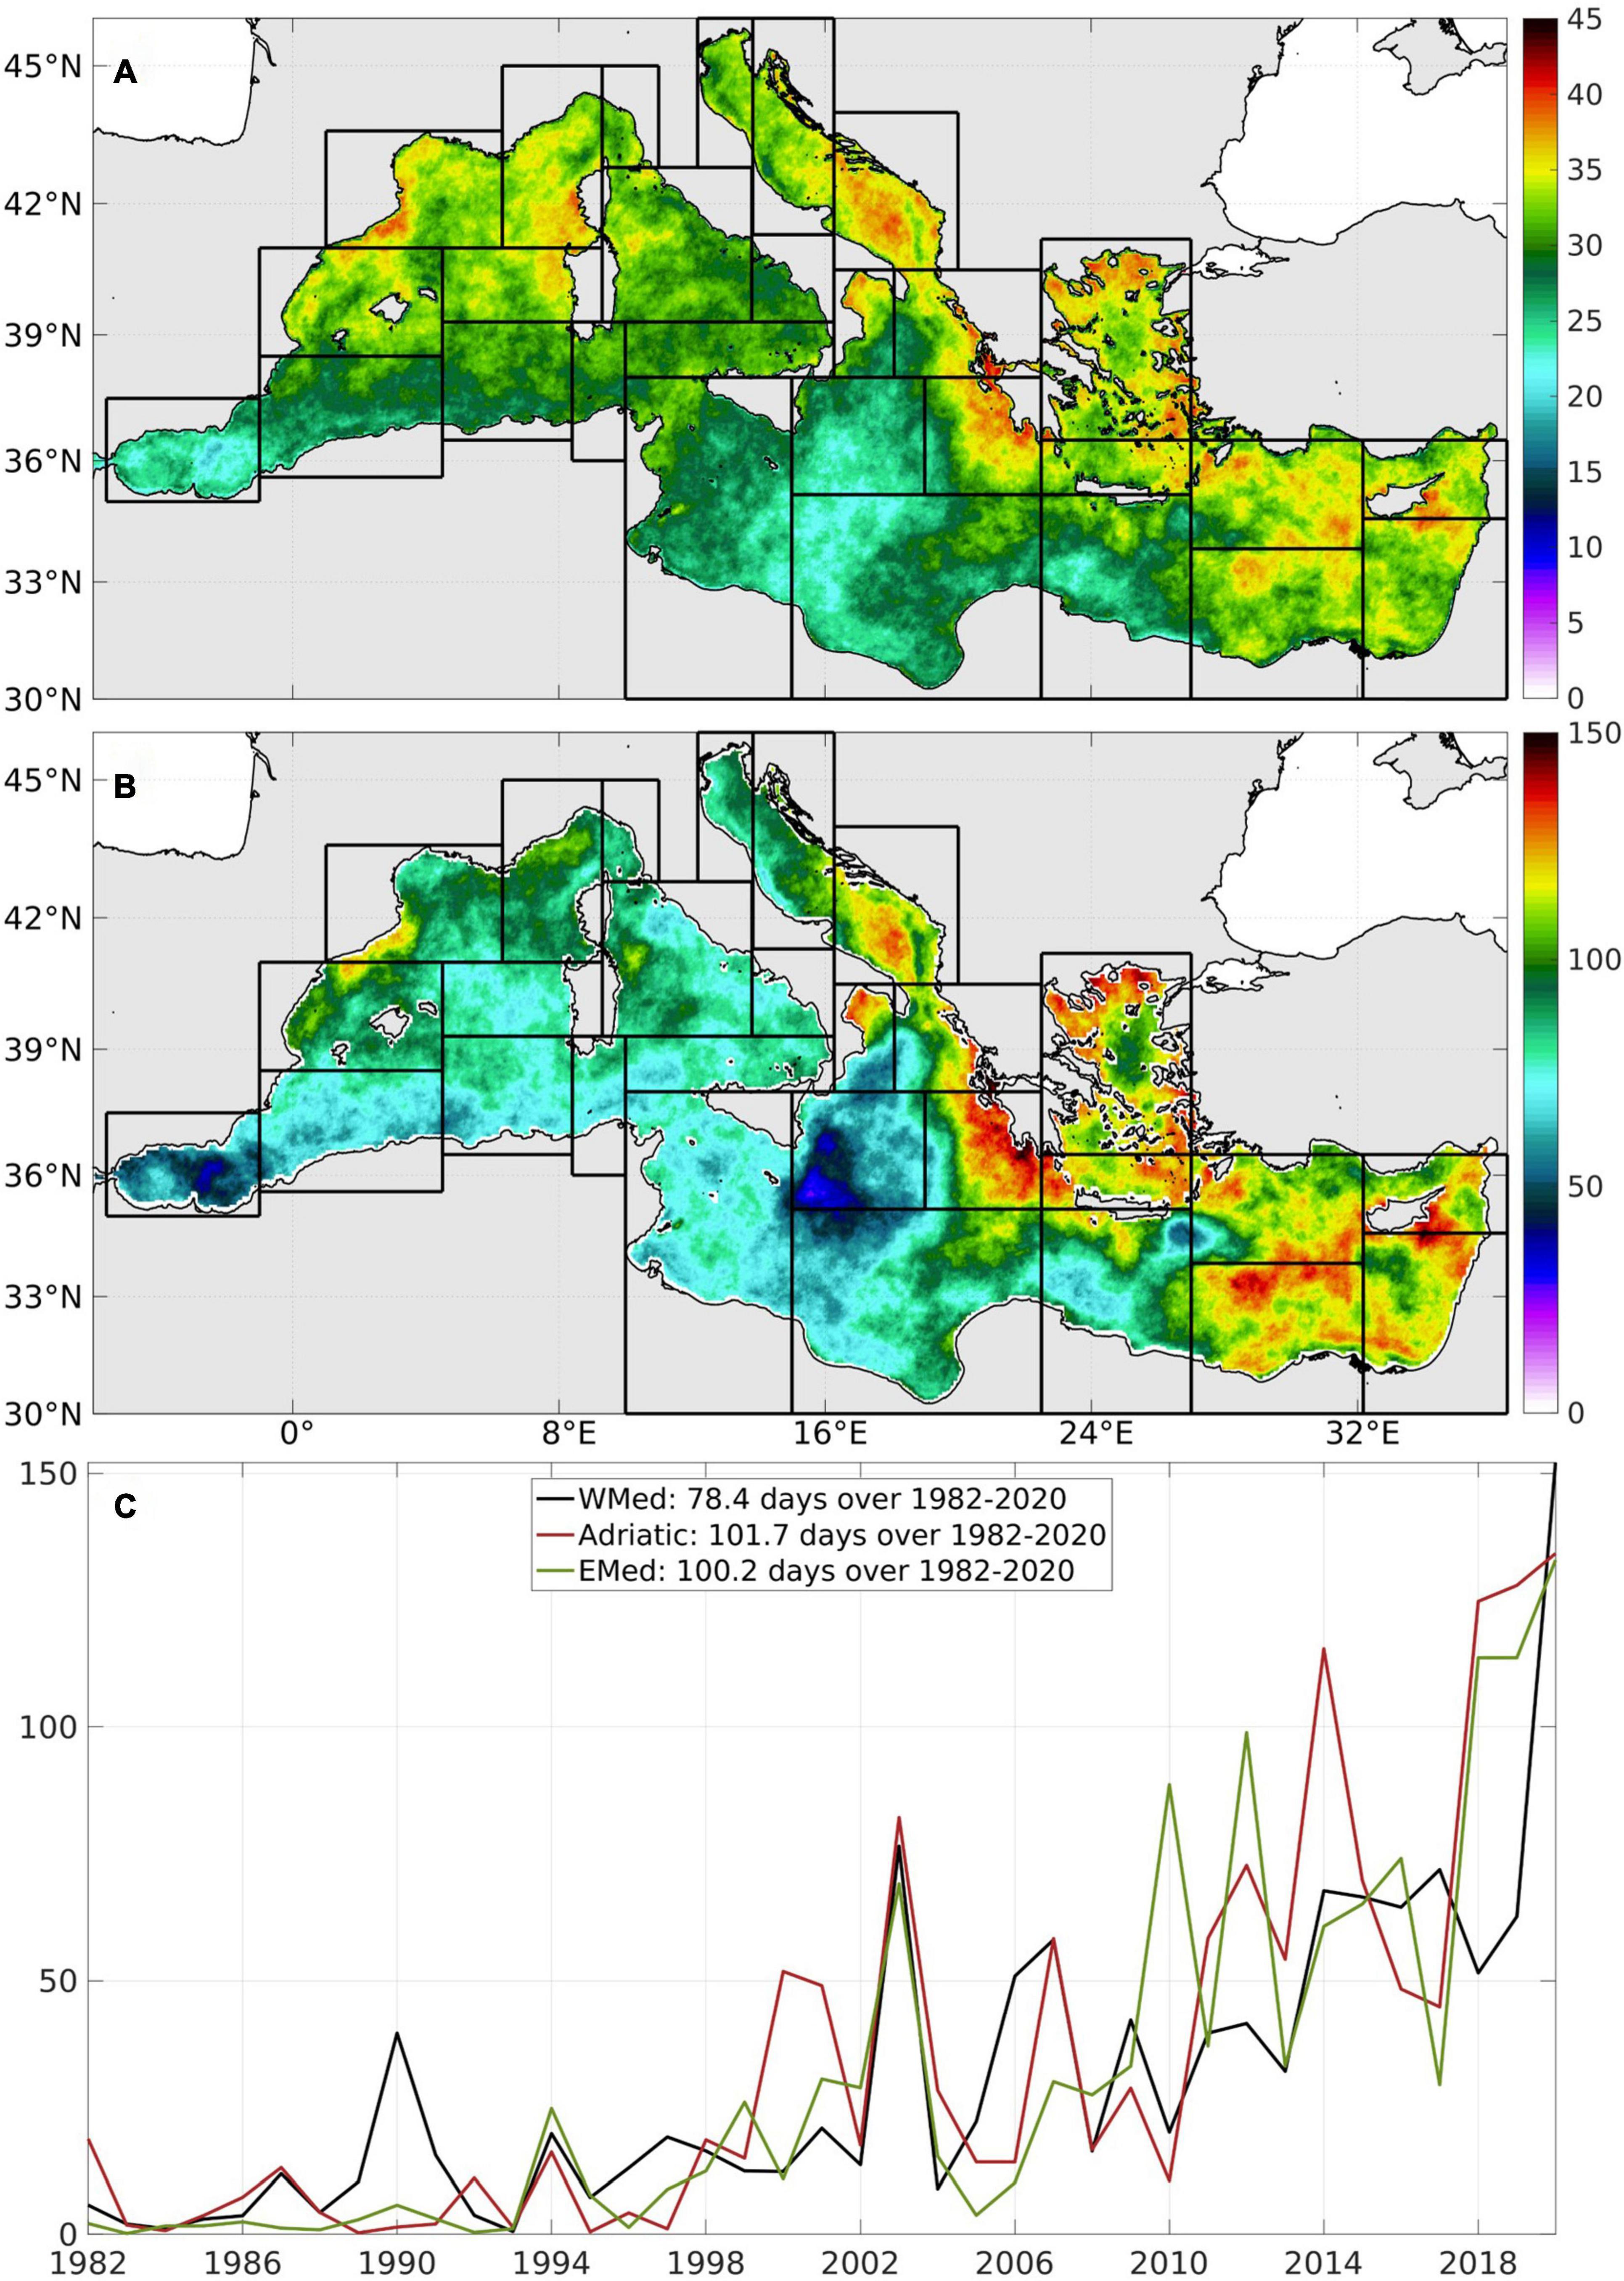
Figure 6. Annual MHW total days: mean (A) and linear trend with 95% confidence level (B) over the period 1982–2020, as well as sub-basin integrated time series from 1982 to 2020 in the WMed, Adriatic Sea and EMed with associated trend values over the period (C).
For every MHW parameter, the sub-regionally integrated time series are also computed from 1982 to 2020 to follow their long-term evolution in response to global change. The results are presented and discussed in the next section.
From Seasonal to Decadal Variability
The sub-regional variability from seasonal to interannual and decadal temporal scales is analyzed through Hövmoller representations of the annual MHW indices from 1982 to 2020 as well as through integrated diagrams over the period 1982–2020 (Figures 7, 8). The sub-regional decadal variability of the annual MHW indices is also highlighted comparing the four decades 1982–1991, 1992–2001, 2002–2011, and 2012–2020 and computing the linear trends with 95% confidence level over the entire period 1982–2020 in the different sub-regions. The level of significance and confidence intervals are calculated using the effective number of degrees of freedom, according to the methodology from Chelton (1983). The proposed sub-period division follows the temporal evolution of SST values that are gradually increasing from one decade to the next (Ibrahim et al., 2021) and the increase of the annual MHW total days over the sub-periods (Figures 6B,C). Averaged over the Mediterranean Sea, the mean SSTs from the CMEMS satellite products (described in Section “39-Year Satellite Products”) over the decades 1982–1991, 1992–2001, 2002–2011, and 2012–2020 increase with values of 19.06, 19.4, 19.85, and 20.22°C, respectively. The annual MHW total days averaged over the whole basin also increase from 1982 to 2020 with mean values of 5.7, 12.8, 35.1, and 75.9 days over the four sub-periods, respectively. This decadal increase of SST and MHW total days is also observed in the WMed, Adriatic Sea and EMed sub-basins (not shown). The four sub-periods analysis also allows highlighting the accelerating intensification rate in MHW intensity, duration and frequency. Associated estimations are provided in Tables 2, 3.
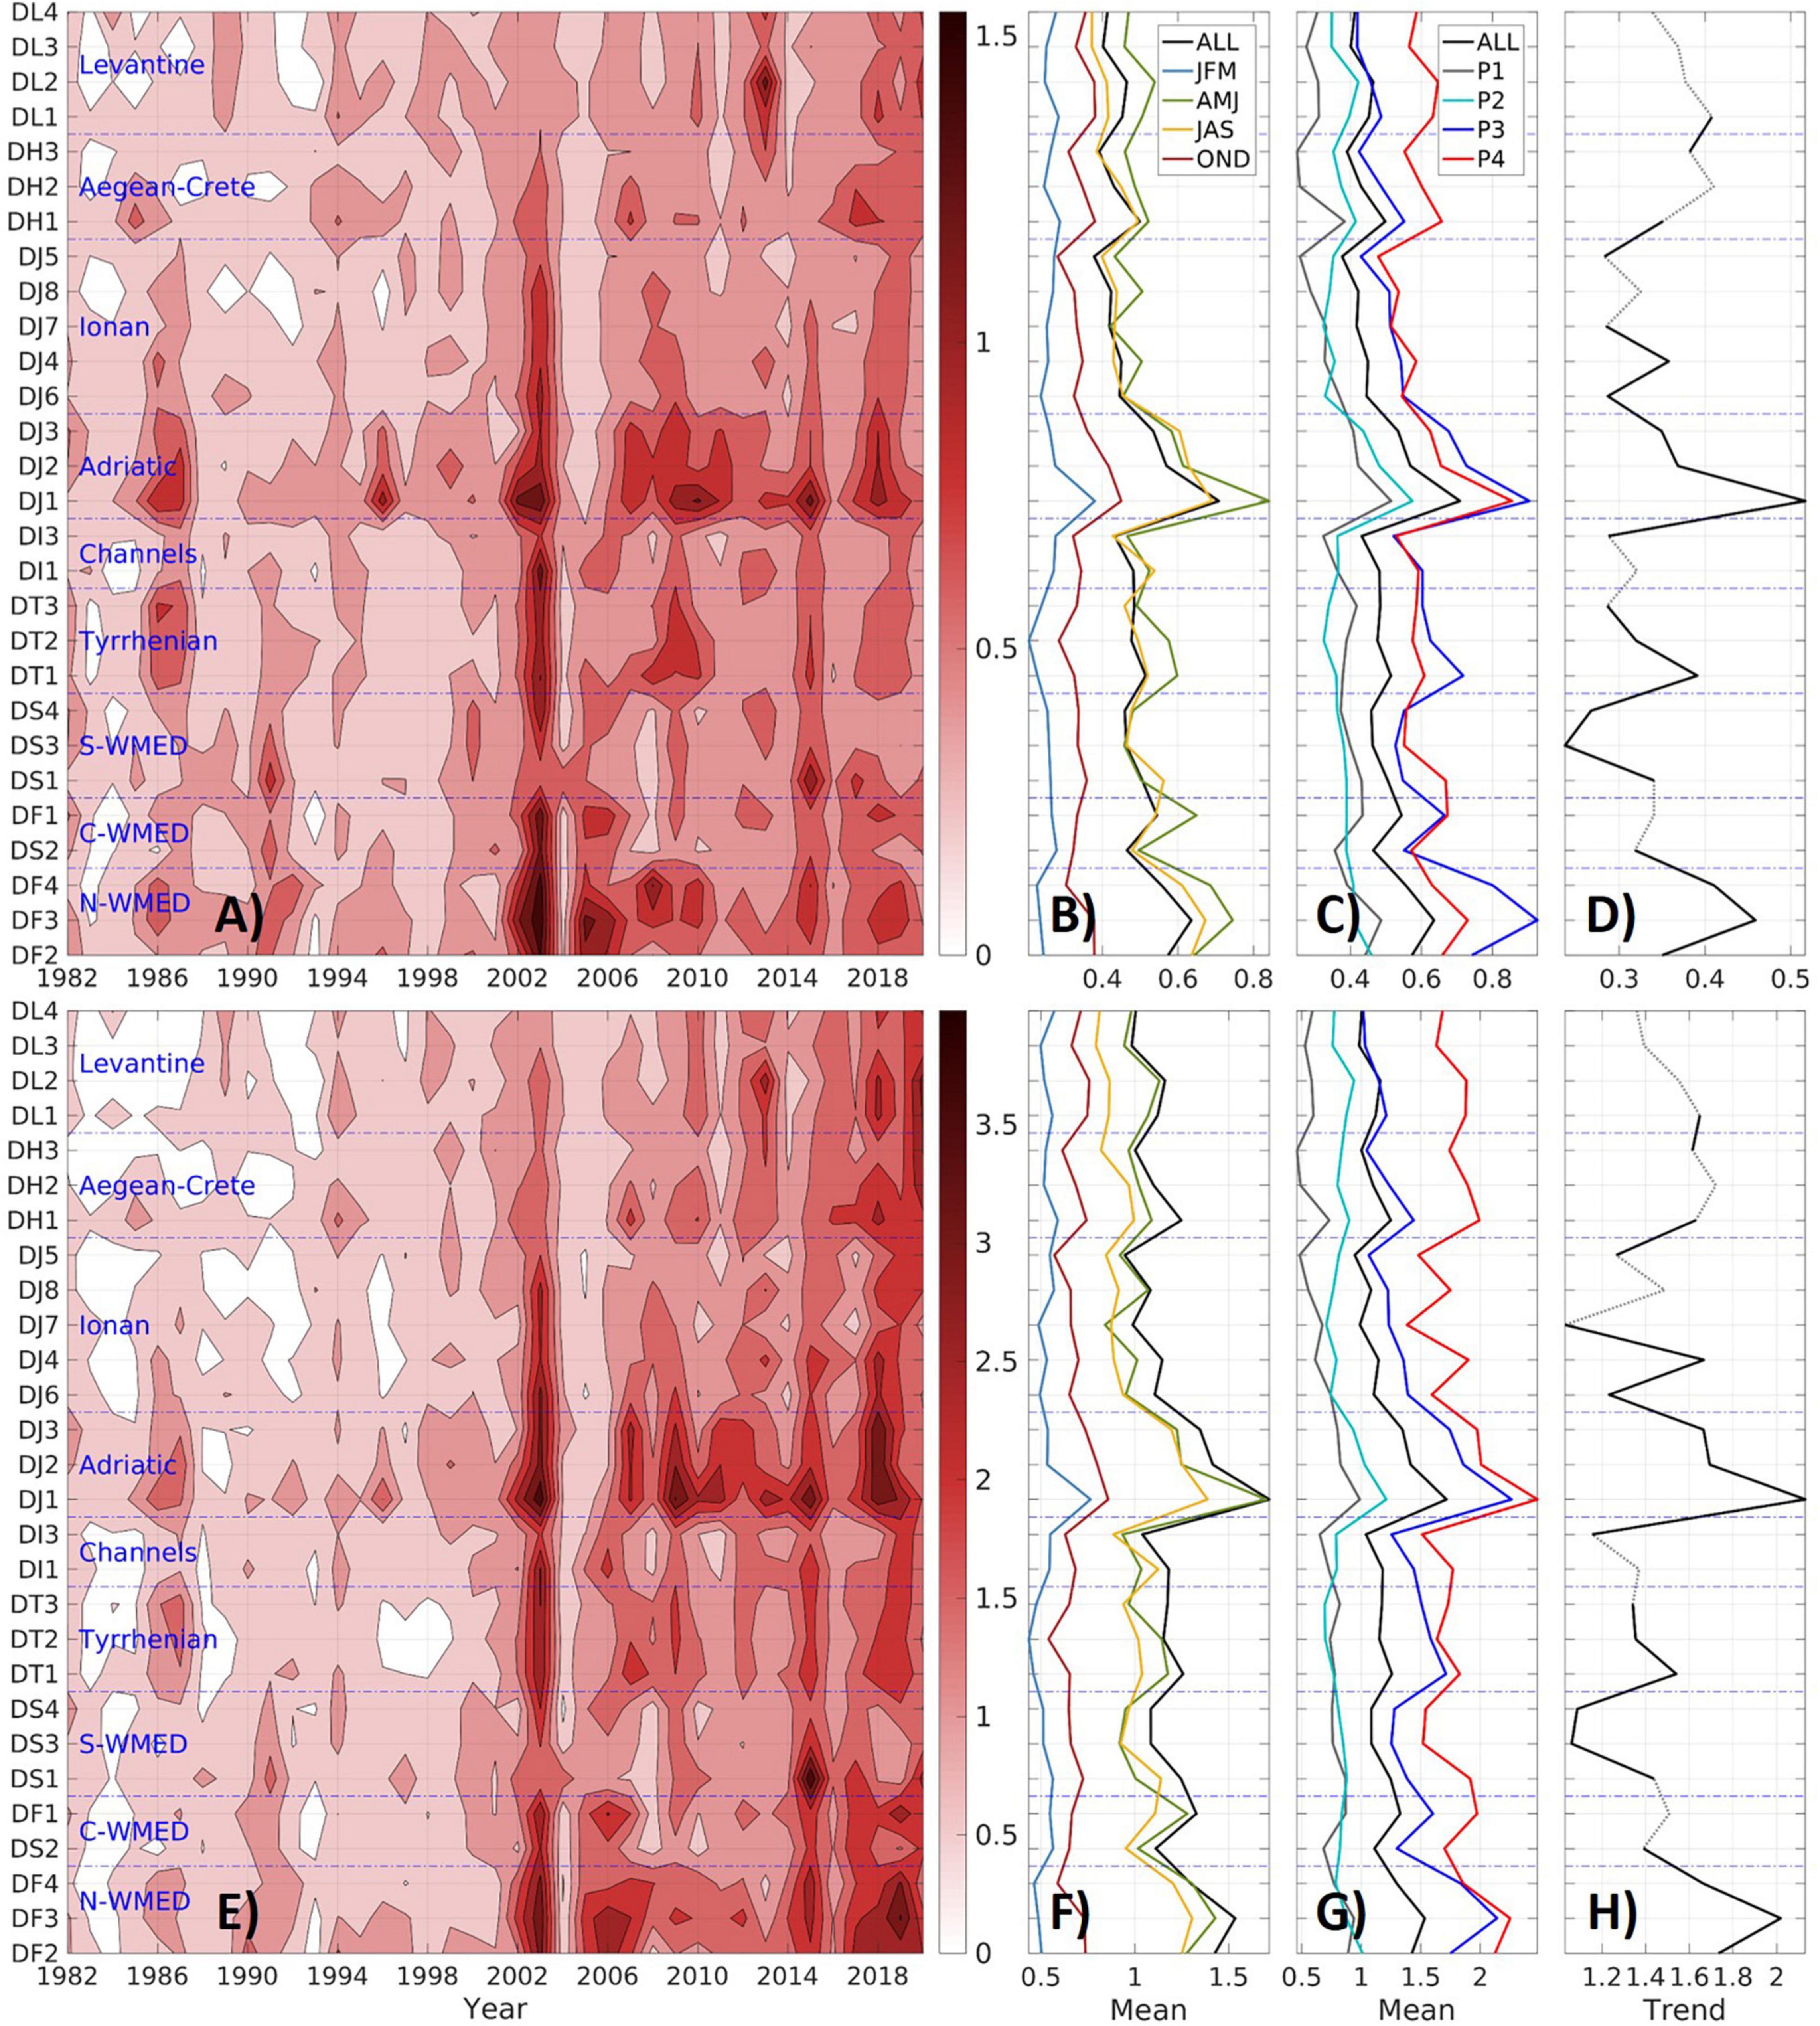
Figure 7. Mean intensity (A–D) and maximum intensity (E–H) (in °C): sub-regional annual means from 1982 to 2020 (A,E), seasonal means (B,F) over 1982–2020 (ALL: all seasons; JFM: winter; AMJ: spring; JAS: summer; OND: autumn), period-averages over 1982–1991 [P1], 1992–2001 [P2], 2002–2011 [P3], 2012–2020 [P4] and 1982–2020 [ALL] (C,G) and linear trends over 1982–2020 (D,H) with 95% confidence (black solid line).
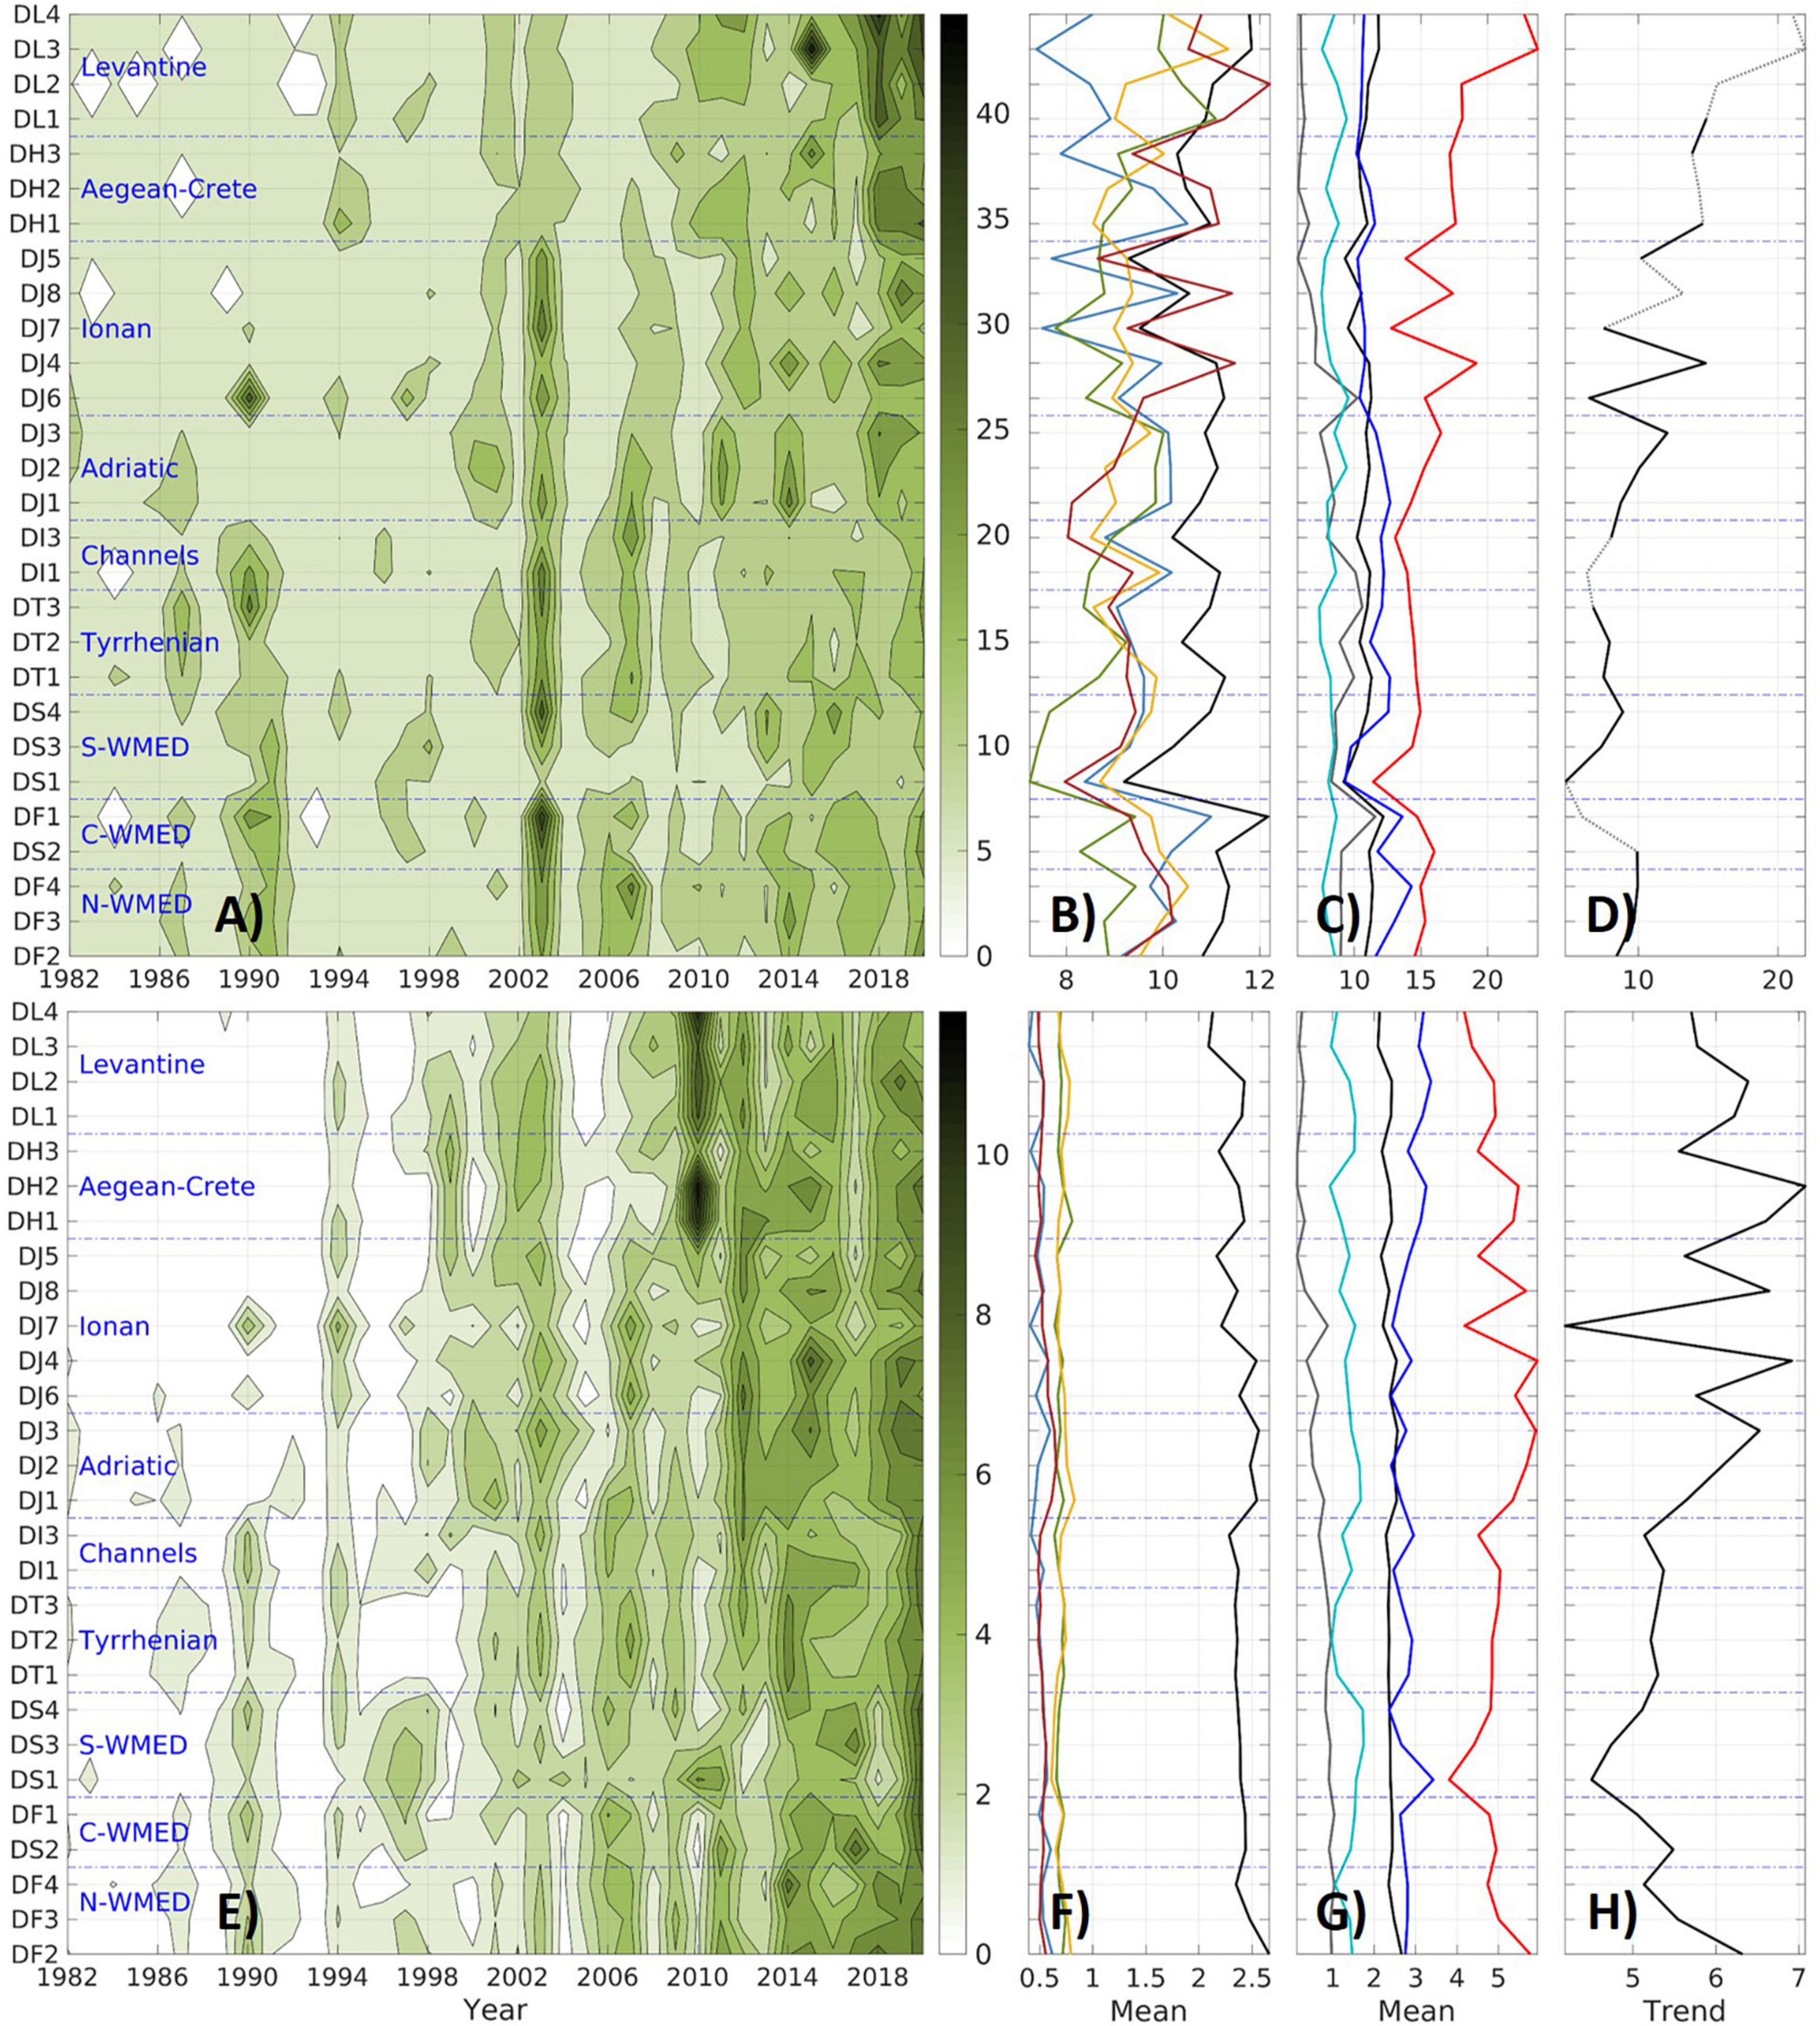
Figure 8. Same as Figure 7 for mean duration (A–D) (in days) and number of events (E–H).
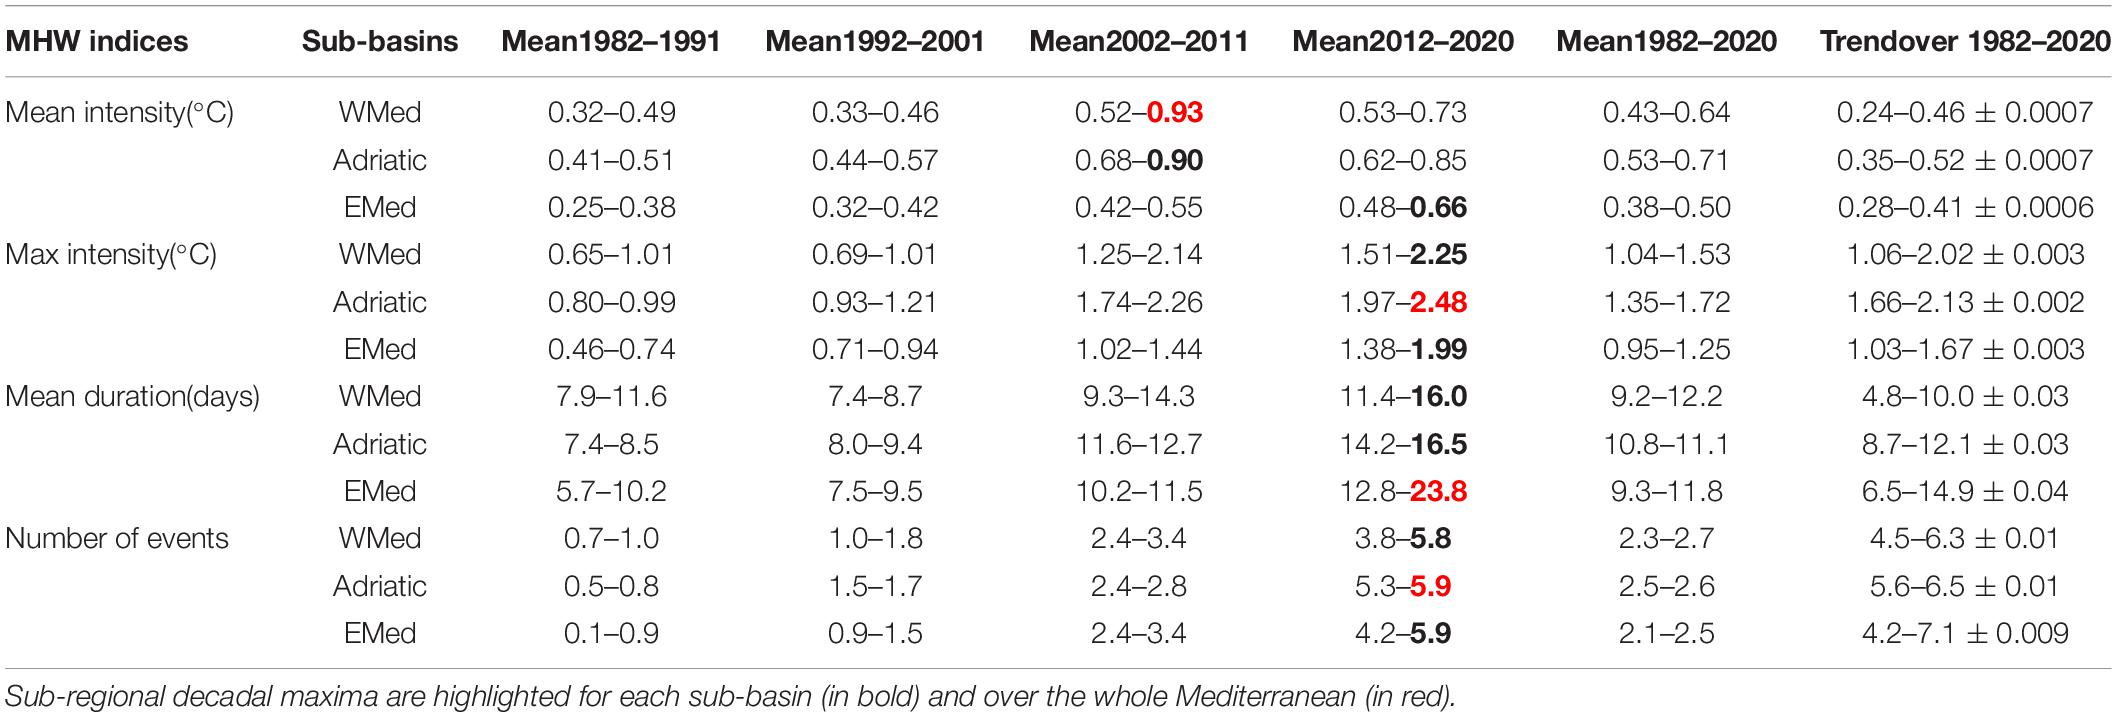
Table 2. Ranges of the mean values over the sub-periods 1982–1991, 1992–2001, 2002–2011, and 2012–2020, as well as over the whole period 1982–2020 and linear trends with 95% confidence level (only) over 1982–2020 of sub-regional MHW indices in the WMed, Adriatic Sea, and EMed.
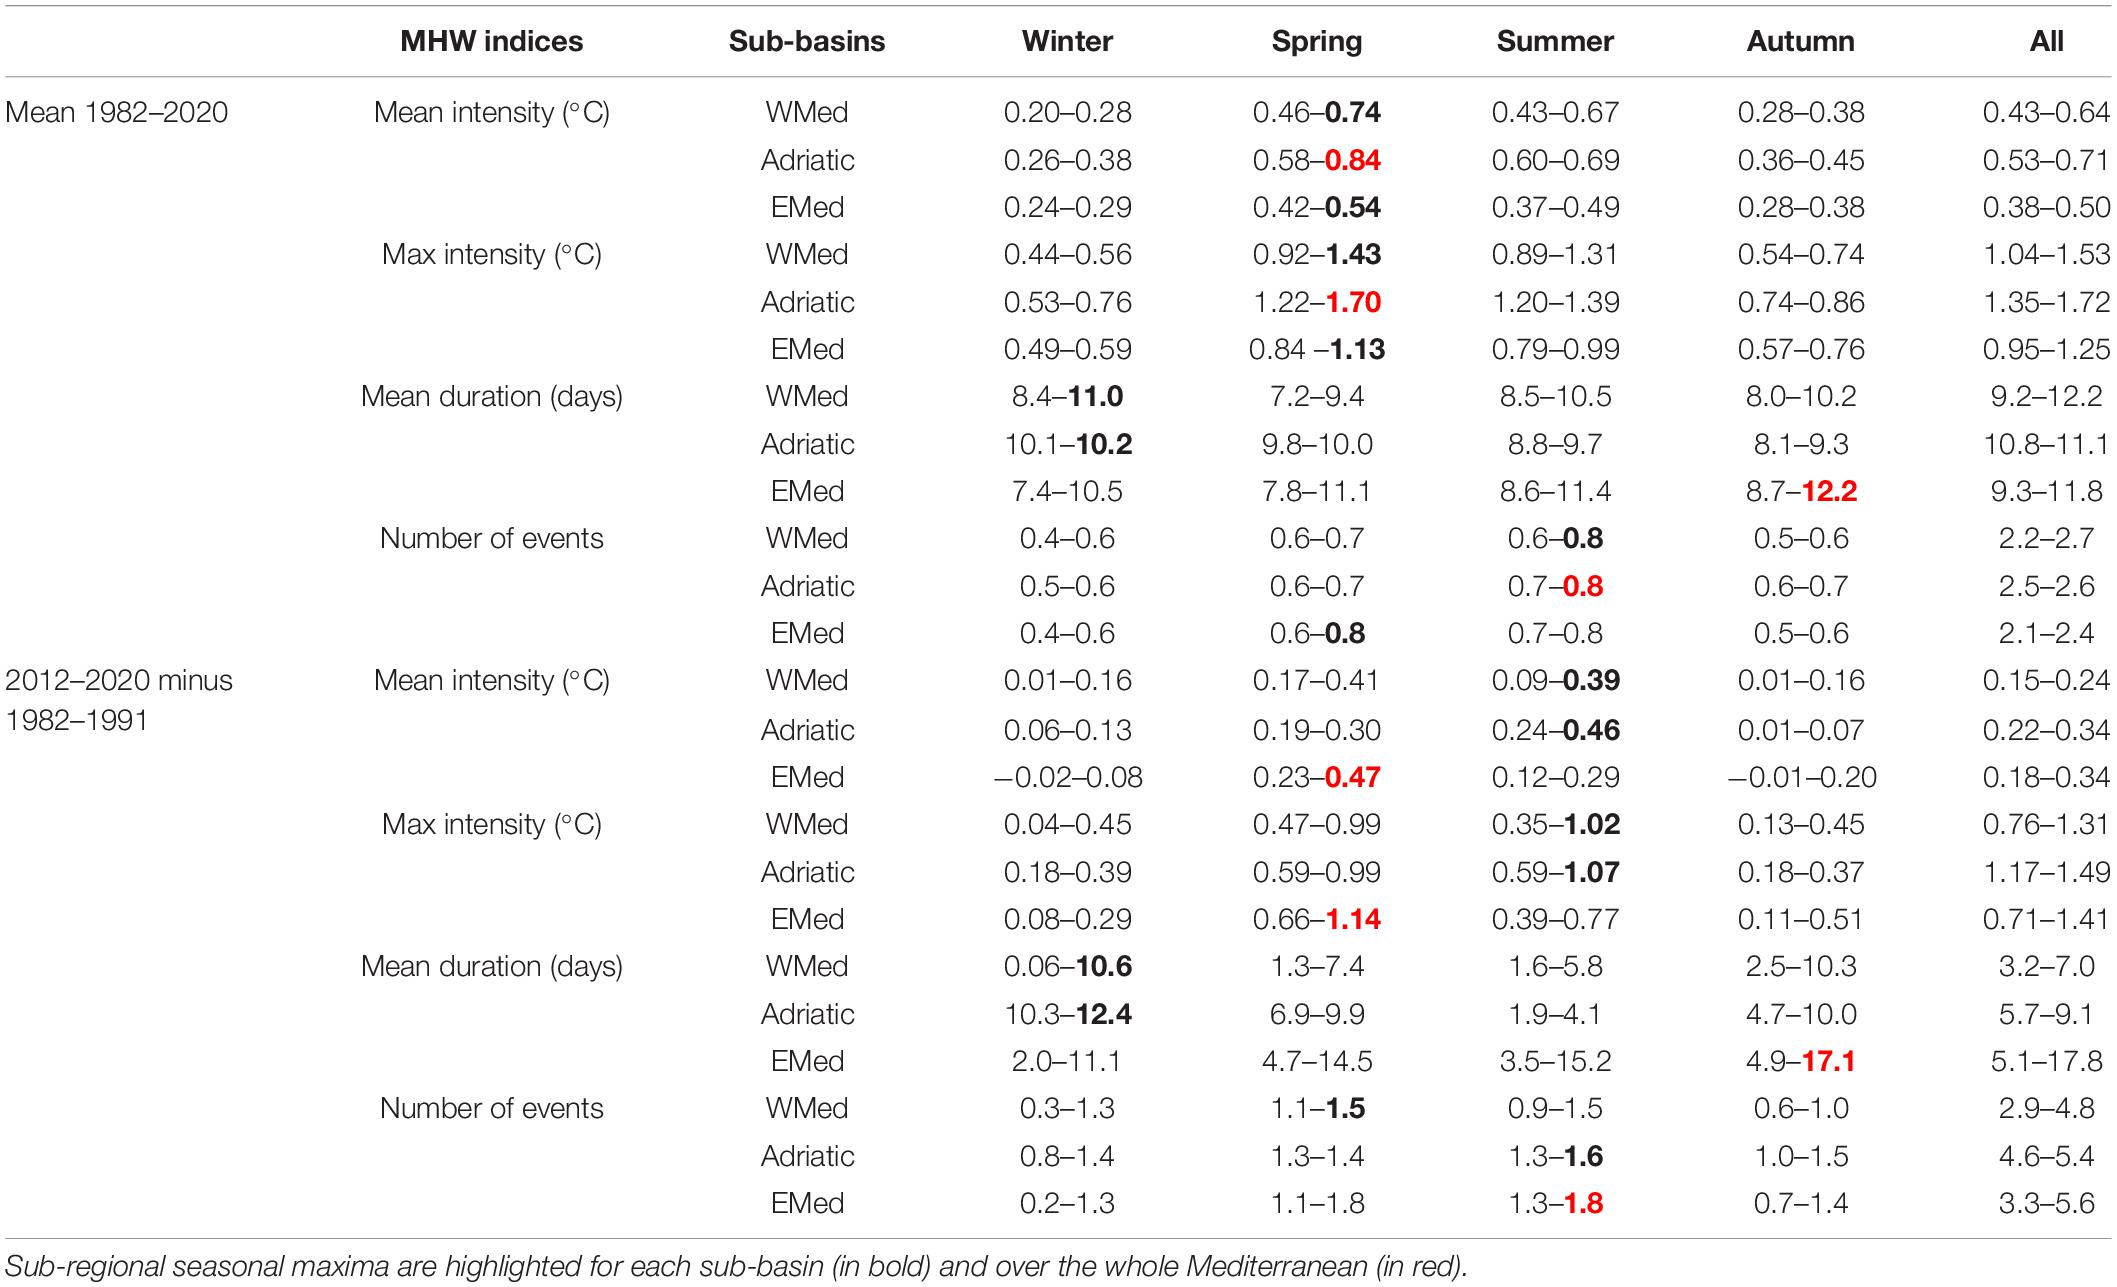
Table 3. Ranges of the seasonal mean values over 1982–2020 of sub-regional MHW indices in the WMed, Adriatic Sea and EMed, as well as the differences between the seasonal means over the decades 2012–2020 and 1982–1991.
Regarding the temperature MHW characteristics during the period 1982–2020, the sub-regionally integrated mean and maximum intensities reach annual mean values up to 1.54°C (in north WMed in DF3 in 2003) and 3.98°C (in south WMed in DS1 in 2015), respectively (Figures 7A,E). Both MHW indices have strong temporal variability over 1982–2020 experiencing remarkable events, interannual variability and substantial increase over the period, particularly in recent years. Among the most extreme events, the MHWs which were related to the heat waves in 2003 and 2006 in most of sub-regions (e.g., Sparnocchia et al., 2006; Olita et al., 2007; Garrabou et al., 2009; Hobday et al., 2018; Smale et al., 2019; Holbrook et al., 2020) are well marked. The mean (maximum) intensity is higher than 1°C (2.5°C) in most of the WMed, Adriatic Sea and north-middle Ionian Sea in 2003 and in the northern WMed in 2006. In 2013, as also observed by Ibrahim et al. (2021), the EMed experienced particularly intense MHW, in particular the north-eastern Levantine with mean (maximum) intensity larger than 1°C (2.5°C). The year 2015 also shows very high mean and maximum intensity values in several sub-regions of the WMed including the Alboran Sea [as also observed in Darmaraki et al. (2019) at basin scale], as the years 2018 and 2019 in the northern WMed, Adriatic Sea and eastern EMed. More recently, in 2020, as addressed above and also observed by Ibrahim et al. (2021) in the EMed, MHWs with maximum intensity exceeding 2.5°C have been detected in the sub-regions of the WMed (such as the Alboran Sea and Gulf of Lion) and EMed (such as the northern and north-eastern Levantine basin, southern Aegean Sea and Cretan Passage). It is also worth noting that the north Adriatic suffered very intense events with MHW maximum intensity exceeding 2.5°C many years over the last two decades. Although the temperature MHW characteristics and their changes have strong sub-regional variability with maxima in trend values reached in the Adriatic Sea and northern WMed, all sub-regions are experiencing increase in MHW mean and maximum intensities. The significant trend values with 95% confidence level over the period 1982–2020, which are observed in the Adriatic Sea and most of the WMed and EMed sub-regions, range over 0.24–0.52 and 1.03–2.13°C, respectively (Table 2 and Figures 7D,H). No significant values are found in MHW mean and maximum intensities in some sub-regions of the EMed (north-eastern, southern and south-eastern Levantine basin, southern Aegean Sea, middle-eastern Ionian Sea) and WMed (Sardinia Channel and Algero-Provençal sub-region) (Figures 7D,H). The increase of temperature characteristics of MHWs has accelerated in recent years. Comparing the four decades, the mean values through the sub-periods increase in the 28 sub-regions of the Mediterranean Sea (Table 2 and Figures 7C,G). More precisely, the sub-regional values of annual mean and maximum intensities are much higher during the two last decades (2002–2011 and 2012–2020) than the two first ones (1982–1991 and 1992–2001) in the WMed, Adriatic Sea and EMed. The sub-regional maxima of the annual mean intensity are found in the WMed and Adriatic Sea during the decade 2002–2011 due to the extremely warm and long-duration event in 2003 in these sub-basins. Otherwise, the last decade is the sub-period when the annual mean intensities are the largest in the EMed and the maximum intensities are the highest in the WMed, Adriatic Sea and EMed. Seasonal variability is also highlighted through estimations of seasonal means over the period 1982–2020 and the four sub-periods in both MHW temperature indices (Table 3 and Figures 7B,F). The seasonal mean and maximum intensities are the largest in spring (with sub-regional values ranging over 0.42–0.84 and 0.84–1.70°C, respectively) and the smallest in winter (with values over 0.20–0.38 and 0.44–0.76°C, respectively) in the WMed, Adriatic Sea and EMed. The difference of sub-regional seasonal means between the most recent (2012–2020) and the oldest (1982–1991) decades of the study are higher in summer for the WMed and Adriatic Sea and in spring for the EMed. The maximum differences between the two sub-periods in mean and maximum intensities are found for the EMed in spring with values up to 0.47 and 1.14°C, respectively.
Concerning the MHW occurrence, the sub-regionally integrated mean duration and frequency reach annual values up to 44.7 days (in EMed in DL3 in 2015) and 11.8 events (in EMed in DH2 in 2010) (Figures 8A,E). Both related-time variables show extreme events, interannual variability and significant increase over the period 1982–2020. Among the years with the longest annual mean duration of MHWs exceeding 1 month are the year 2003 in the WMed sub-regions (such as the Balearic Sea and Algerian sub-regions) affected by the extreme event in summer, the year 2015 in the southern Levantine sub-basin, and the recent years from 2018 to 2020 in the eastern EMed, particularly in the Aegean Sea and Levantine basin. The spatial variability is also highlighted through the 28 sub-regional estimates. All sub-regions experienced positive increases over the 39-year period in mean duration and frequency. The MHW mean duration trend values are statistically significant at the 95% level in the Adriatic Sea and most of the sub-regions of the WMed and EMed ranging from 4.8 to 14.9 days over 1982–2020 (Table 2 and Figures 8D,H). There are no significant changes in MHW mean duration in some sub-regions of the EMed and WMed, as for the sub-regional MHW mean and maximum intensity trend values (Figures 8D,H). The sub-regional MHW frequency trend estimations are positively significant at 95% confidence level in all sub-regions of the Mediterranean Sea with values varying from 4.2 to 7.1 annual events over 1982–2020 and maxima reached in the EMed (Table 2 and Figures 8D,H). These estimates lead to a positive trend of sub-regional annual total days of 55.0–125.5 ± 0.2 days over the 39-year period (not shown). The four sub-periods comparison also highlights the increase over the last four decades from 1982 to 2020 and the strong acceleration rate in the last decade when the mean duration and number of events are much higher in all sub-regions than during the three previous decades (Table 2 and Figures 8C,G). The analysis of seasonal variations over the whole period (Table 3 and Figures 8B,F) shows that the MHW duration reaches its maximal sub-regional mean over 1982–2020 in winter in the WMed and Adriatic Sea (11.0 and 10.2 days, respectively) and in autumn in the EMed (12.2 days). The differences of sub-regional mean duration between the 2012–2020 and 1982–1991 sub-periods are the highest in winter in the WMed and Adriatic Sea (10.6 and 12.4 days, respectively) and in autumn in the EMed (17.1 days). The seasonal means over the whole period and differences between the most recent and the oldest sub-periods of discrete numbers of events tend to be the smallest in autumn-winter and the highest in spring-summer with values oscillating over 0.4–0.8 and 0.2–1.8 event per year, respectively.
All annual MHW indices (mean and maximum intensities, mean duration and number of events) are substantially increasing over the period 1982–2020 with positive linear trends which are significant at 95% confidence level in many sub-regions of the Mediterranean Sea (Table 2 and Figures 7D,H, 8D,H). Although these significant increases affect most of the sub-regions, the Mediterranean experiences a strong sub-regional variability in MHW intensity, duration and frequency with significant sub-regional trends that are the highest in the Adriatic Sea and WMed for the intensity and the largest in the EMed for the duration and frequency. Additionally, these results show an acceleration in the increase of duration and number of events in the last decade (2012–2020) leading to an accelerated increasing of MHW total days in all Mediterranean sub-regions with significant local trend values ranging from 24 to 177 days over the period 1982–2020 and with higher acceleration in the Adriatic Sea and EMed than in the WMed (Figures 6B,C). In the WMed, the highest trends in MHW mean and maximum intensities, mean duration and events are found in the north WMed including the Gulf of Lion [DF2] and Ligurian Sea [DF3]. In the Adriatic Sea, the highest trends in mean and maximum intensities are found in the North Adriatic [DJ1]. The EMed is the place of the highest trends in duration and number of events, particularly in coastal areas (not shown).
These annual indices at sub-regional scale allow following the long-term evolution in intensity and occurrence of MHWs on an annual basis. It is worth mentioning that these estimations are annual and sub-regional averages, thus they include but do not reflect local event (in time and/or in space). Local estimations would be much higher with even more alarming results than the estimates obtained in this study.
Depth Penetration of Marine Heat Waves
Depth Propagation
The penetration of MHW into the ocean sub-surface is addressed through the analysis of vertical hydrographic profiles from profiling floats in the Mediterranean over the period 2012–2020 (see Section “Marine Heat Wave Profiles”), when the oceanic basin is relatively well-sampled at seasonal and annual scales in the different sub-regions (Figure 2B). However, the Sicily Strait (DI3) and north Adriatic (DJ1) sub-regions are not addressed in this section due to lack of profiles and insufficient coverage (Figure 2B).
The medians of the sub-regional distributions of Ta, Sa, and ρa MHW profiles over the period 2012–2020 as a function of depth (Figures 9A,C,E) highlight the vertical penetration of MHWs. Ta from MHW profiles are positive at surface and sub-surface in all sub-regions with higher values at surface (with sub-regional values oscillating between 0.64 and 2.82°C) decreasing with depth (Figure 9A). The thermal propagation in depth shows a strong spatial variability over the period. Ta are more intense and reach deeper layer in the EMed than in the WMed. While the medians of the Ta distributions over 2012–2020 are positive until 50–150 m in the WMed and around 200 m in the middle and south Adriatic Sea, they reach deeper layers in the EMed, until 400 m in the northeast Levantine basin [DL2] and 700 m in the north Aegean Sea [DH1]. The medians of the Sa distributions over 2012–2020 at surface and sub-surface are generally negative in the WMed until 100–250 m depth and in the Levantine sub-regions in the eastern EMed reaching 100–150 m depth (Figure 9C). In the Adriatic Sea, Ionian Sea, Aegean Sea, and Cretan passage, the medians for Sa are positive with high values at surface (up to 0.97) and reaching 200–800 m depth. The ρa distributions over 2012–2020 show negative median values for all sub-regions with sub-regional vertical pattern similar as Ta (Figure 9E), with negative values higher at surface (ranging from −0.01 to −0.95 kg/m3) than at sub-surface, and reaching 50–300 m depth in the WMed and 100–800 m depth in the EMed. In order to identify the ocean processes that could be involved in the vertical propagation of MHWs at sub-regional scale, the seasonal distributions of MHW profiles are also examined. The uneven spatio-temporal coverage of the profiling float network is challenging when analyzing such data (Figure 2B). Some caution has to be taken, in particular for the study at seasonal scale with a reduced number of profiles in the sub-regions (Figures 10D,H,L,P).
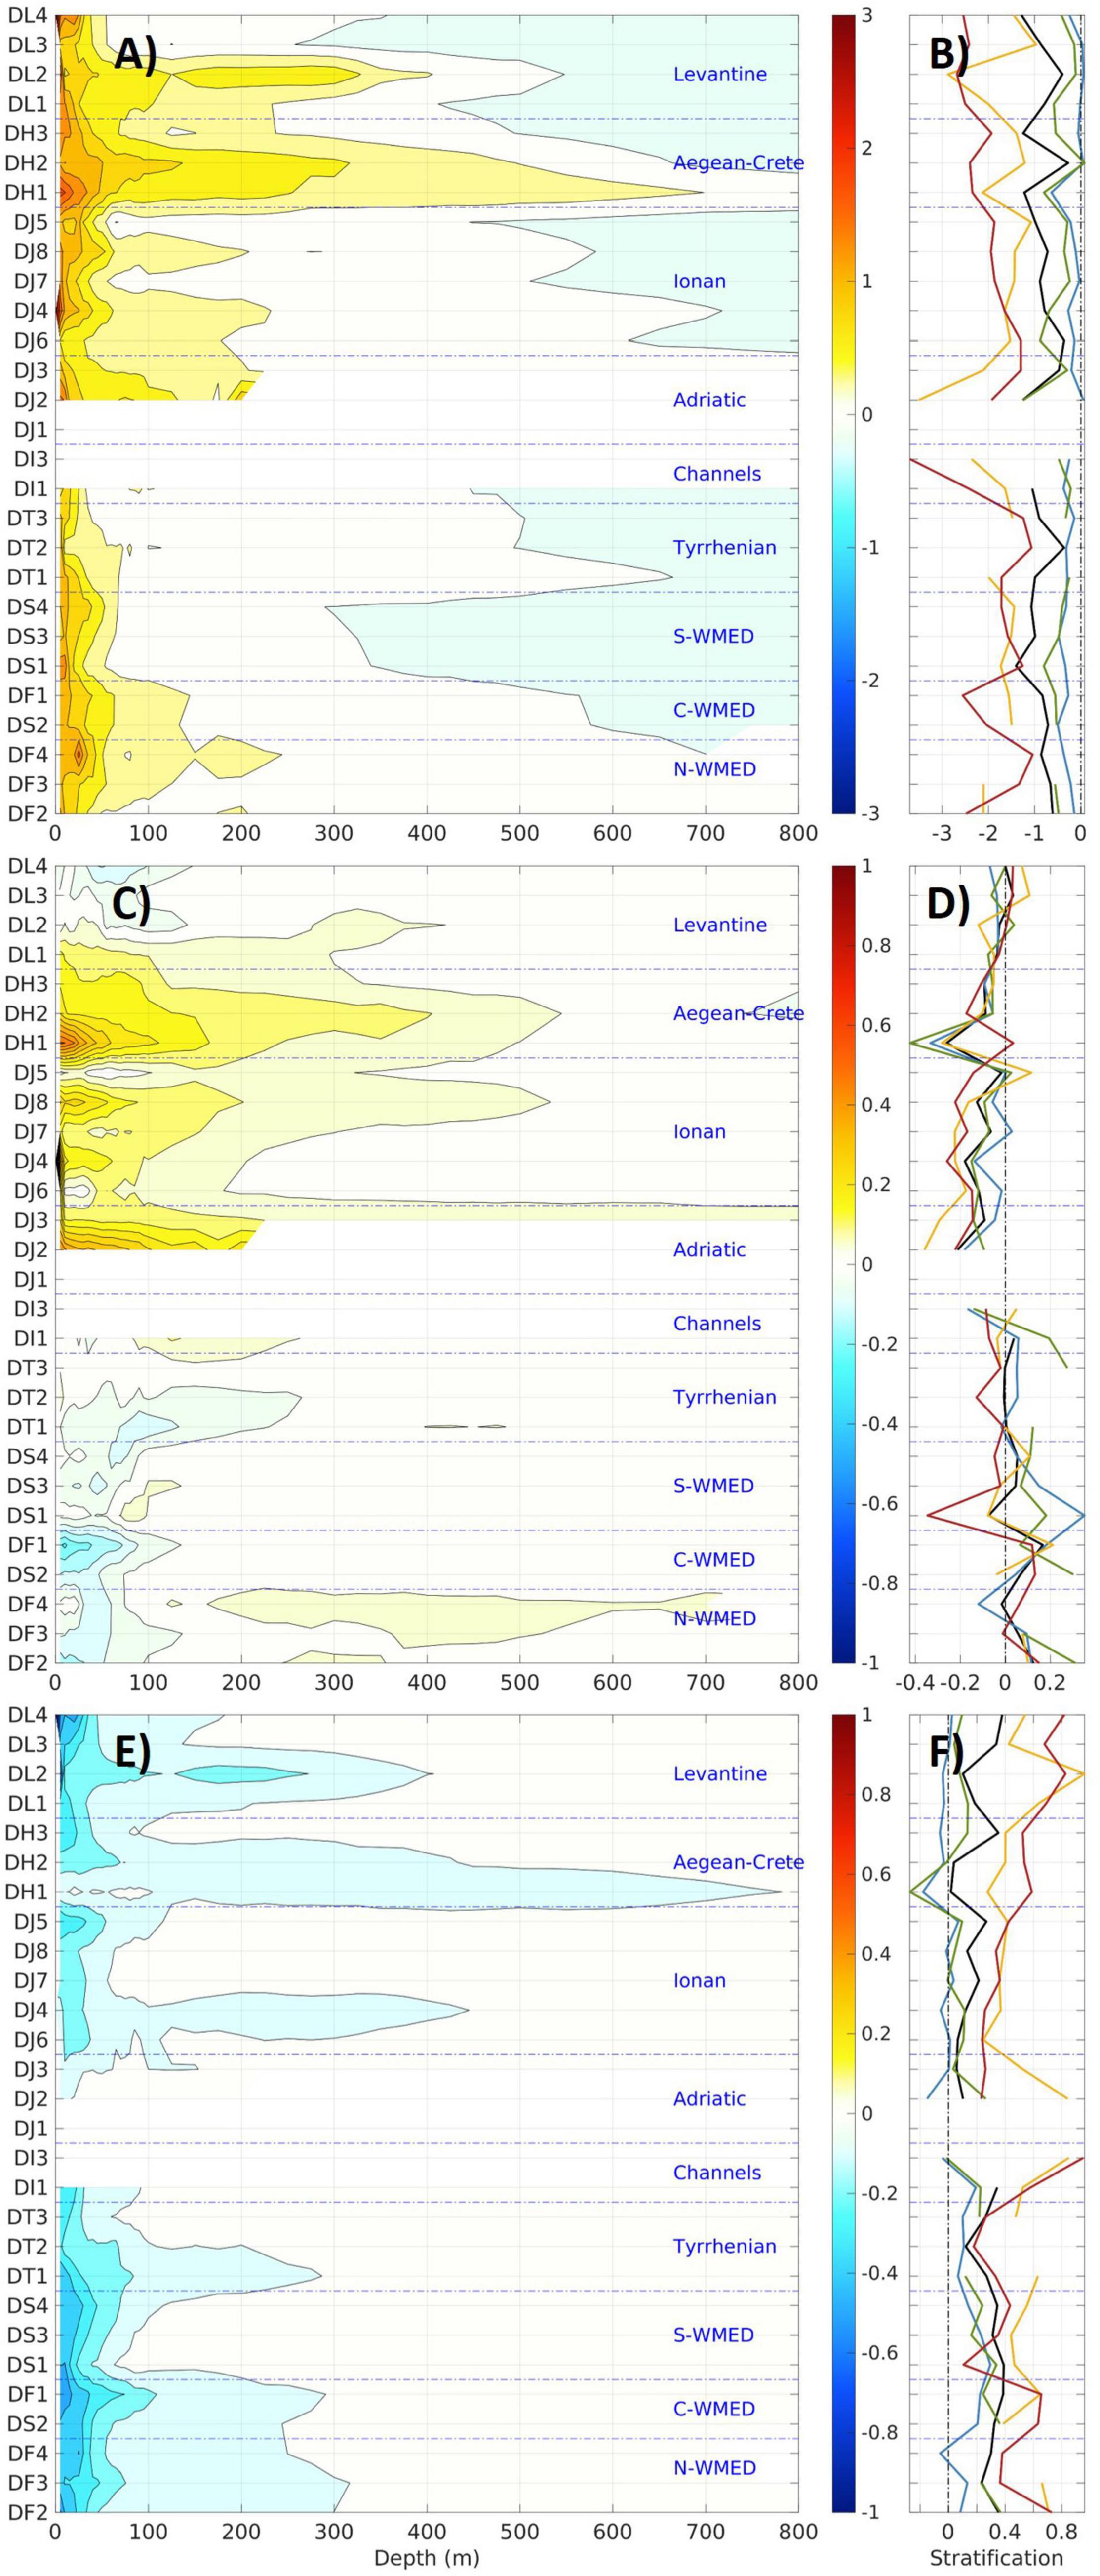
Figure 9. Temperature (A,B) (in °C), salinity (C,D) and density (E,F) (in kg/m3) anomalies: medians of the sub-regional distributions from MHW profiles over the period 2012–2020 as a function of depth (A,C,E) and associated upper-ocean stratification (B,D,F).
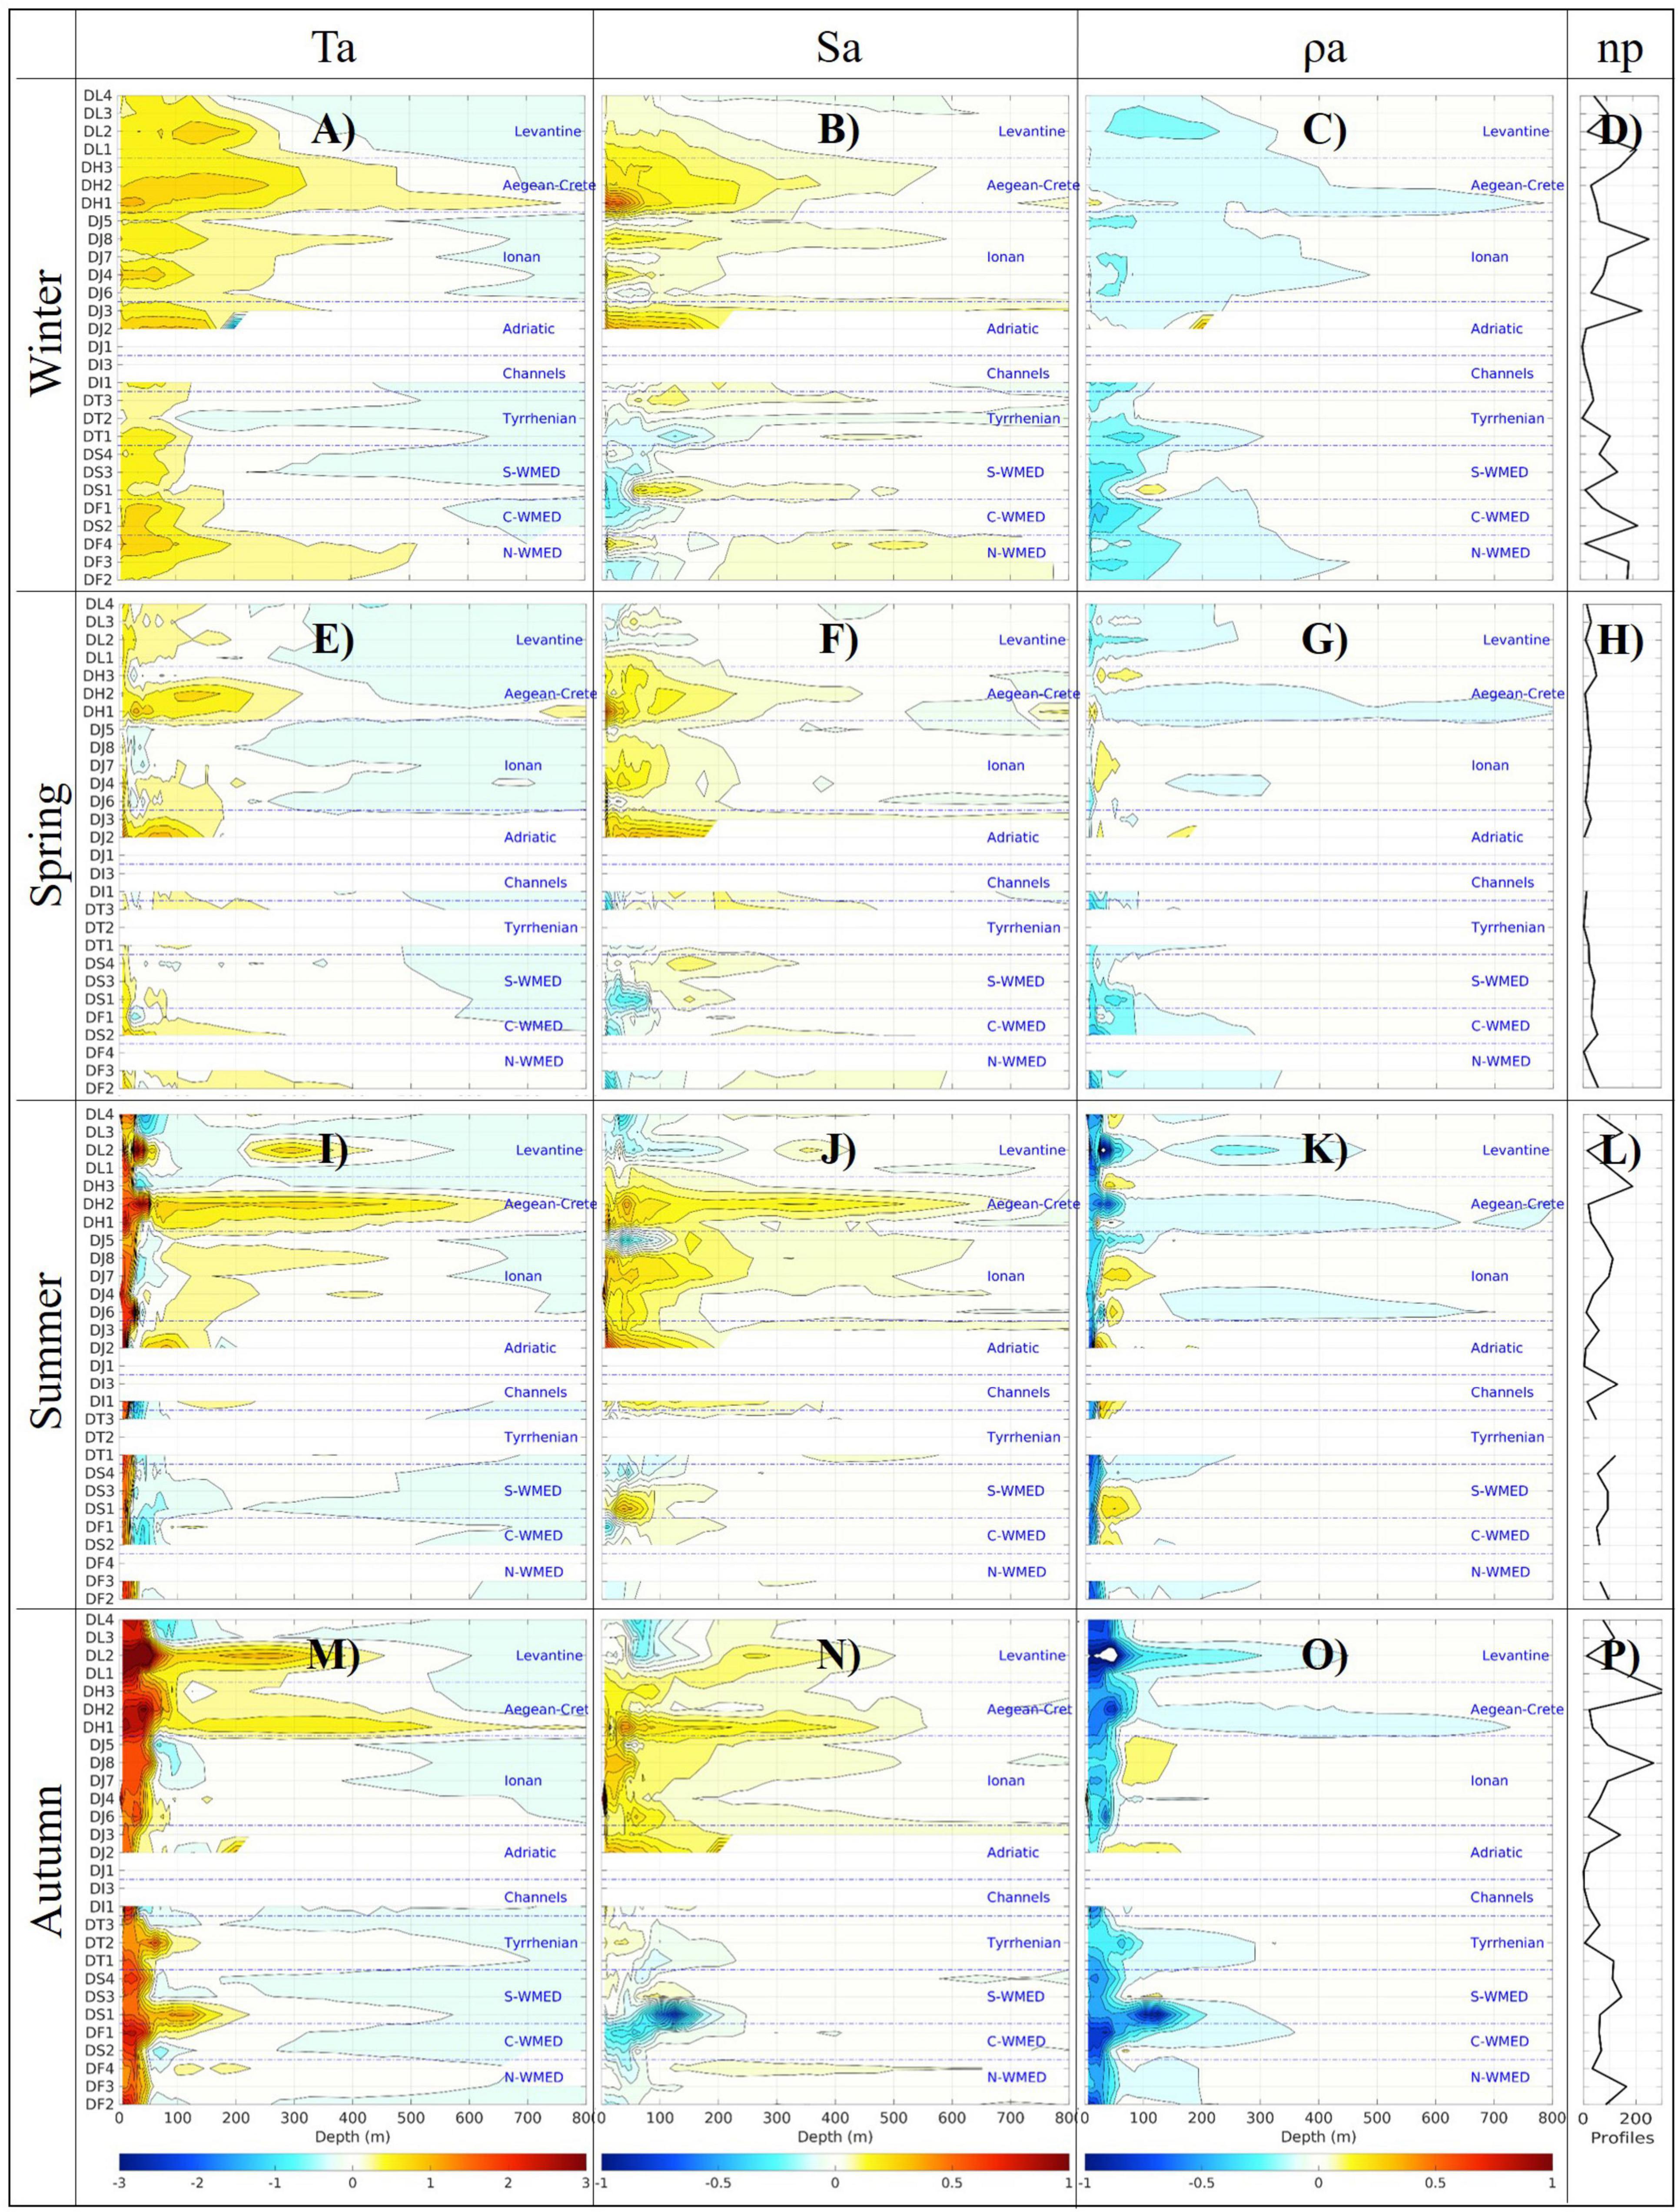
Figure 10. Same as Figure 9 for temperature (A,E,I,M), salinity (B,F,J,N), and density (C,G,K,O) anomalies for the winters (A–C), springs (E–G), summers (I–K), and autumns (M–O) over the period 2012–2020, and associated seasonal number of profiles [np] (D,H,L,P).
The seasonal distributions of MHW profile anomalies show seasonal variations in the vertical extent of MHWs (Figure 10). The Ta of MHW profiles have a strong seasonal variability in its vertical structure (Figures 10A,E,I,M). The highest median values of positive Ta are found in summer (until 4.33°C) in the upper 30 m layer and in autumn (maximum of 5.25°C) at surface and sub-surface in the upper 50–100 m. In winter, the Ta median values are less intense at surface (maximum around 1.19°C) but reach deeper layer (until 700 m). The vertical propagation in winter may be induced by vertical mixing in convection areas (e.g., Gulf of Lion [DF2], Ligurian Sea [DF3], Cretan Sea [DH2], and Rhode Gyre [DL1]). Note that the Aegean Sea (DH1 and DH2) has a different behavior from other regions in summer and autumn with the deepest positive Ta reaching 800 m. The western part of the Aegean Sea (where are mostly located the MHW profiles of the sub-region [DH1], Figure 2B) and the north-eastern corner of the Crete Island are areas of downwelling during the summer and autumn seasons (Bakun and Agostini, 2001) that may contribute to the vertical propagation. Downwelling processes in late-autumn/early-winter could also explain the depth penetration until 200 m in the African side of the Alboran Sea (Bakun and Agostini, 2001). The Sa of MHW profiles have not well-marked seasonality although variations are found (Figures 10B,F,J,N). The ρa vertical distributions also follow the Ta patterns at seasonal scales (Figures 10C,G,K,O), with more intense values in summer and autumn (with maximum median values of −1.16 and −1.43 kg/m3, respectively) in the upper 30 and 100 m layers, respectively, and with deeper vertical extent in intermediate and deep layers in winter, when vertical mixing drives the weak stratification enabling MHWs to extend deeper than the surface mixed layer (Schaeffer and Roughan, 2017). Downwelling could also contribute to the vertical propagation of MHWs (as in the southern coast of the Mediterranean) while upwelling would prevent them (such as in Gulf of Lion, eastern Aegean Sea, and off the west coast of Greece). The sub-regions where various upward and downward ocean processes may occur (e.g., convection, downwelling, and upwelling) would require further analyses at local scale.
Ocean Stratification Changes
The changes in T, S, and ρ upper-ocean stratifications are characterized here by the difference between the shallowest and 150 m depth changes (Figures 9B,D,F) over the whole period 2012–2020 and per season over the period. As observed above (Figures 9, 10), most of the T, S, and ρ changes in MHW profiles occur in the upper 150 m layer. Thus, vertical gradients between the surface and 150 m depth appear appropriate to assess the impact of MHWs on the upper-ocean stratification changes in the Mediterranean Sea. The temperature stratification is negative (with sub-regional values over the period varying between −0.27 and −1.4°C) and associated with positive Ta for all seasons and sub-regions (Figure 9B). The T increase is higher at surface than in sub-surface leading to the temperature stratification increase (with higher sub-regional values in summer and autumn reaching −3.50 and −3.70°C, respectively). In the EMed (WMed), the salinity stratification over 2012–2020 is generally negative (positive) reaching sub-regional maximum of −0.26 (0.17) with associated positive (negative) Sa (Figure 9D). The S increase (decrease) in EMed (WMed) is higher at surface than in sub-surface reducing (enhancing) the salinity stratification. The density stratification, which is induced by both temperature and salinity stratifications, is positive (with sub-regional values over 2012–2020 ranging over 0.02–0.39 kg/m3) and combined with negative ρa values for all seasons and sub-regions (Figure 9F), indicating that the density decrease is higher at surface than at 150 m depth enhancing the upper-ocean stratification. As for the temperature stratification, the seasonal upper-ocean density stratifications are higher in summer and autumn with values reaching 0.96 and 0.95 kg/m3, respectively.
In the WMed, the surface T intensification is associated with S decrease of which the weak wind stress may be the major cause of evaporation decrease through latent heat-flux (Benthuysen et al., 2018). The stronger T increase and S decrease at surface have a cumulated effect on the ρ decrease. In the EMed, the T increase is associated with S increase that may be induced by reduction in fresh water inputs (e.g., precipitation or wind conditions). At surface, the S increase does not compensate the T increase effect on ρ decrease. In both WMed and EMed, the ρ decrease induced by MHWs is more important at surface than below enhancing the ocean stratification, in particular in summer and autumn, which correspond to periods of preconditioning phase for deep convection (Testor et al., 2018). The decrease in density of surface and intermediate layers as well as the related increase of ocean stratification hinder any further outflow sinking (Schröder et al., 2006). Such changes modify the hydrographic properties of the Mediterranean Outflow Water flowing into the Atlantic Ocean (Somot et al., 2006) of which heat and salt contents are in turn modified (Curry et al., 2003) impacting its thermohaline circulation.
Coastal Marine Heat Waves
Coastal Near-Shore Response
The ocean response to global warming in the coastal near-shore waters is addressed in the Balearic Islands using the near-shore fixed moorings at Cala Millor (Mallorca Island) and Son Bou (Menorca Island) beaches over the period 2012–2020. MHWs have been identified (as described in Section “Near-Shore Coastal Marine Heat Waves”) in the 2012–2020 time series of temperature from the fixed mooring as well as from the nearest satellite grid point to the monitoring site and the satellite off-shore point (Figure 1B). The near-shore satellite points are located at 1.4 and 0.1 km from the Cala Millor and Son Bou moorings, respectively. The off-shore points, which are in deep waters at a nearly equivalent distance from the continental shelf-break as their corresponding near-shore point, are situated at 43.5 and 15.7 km from the Cala Millor and Son Bou near-shore points, respectively. MHW indices (mean and maximum intensities, mean duration, count and total days) are estimated for the mooring, near-shore and off-shore satellite time series over the common monitored period from 2012 to 2020 (Table 4).
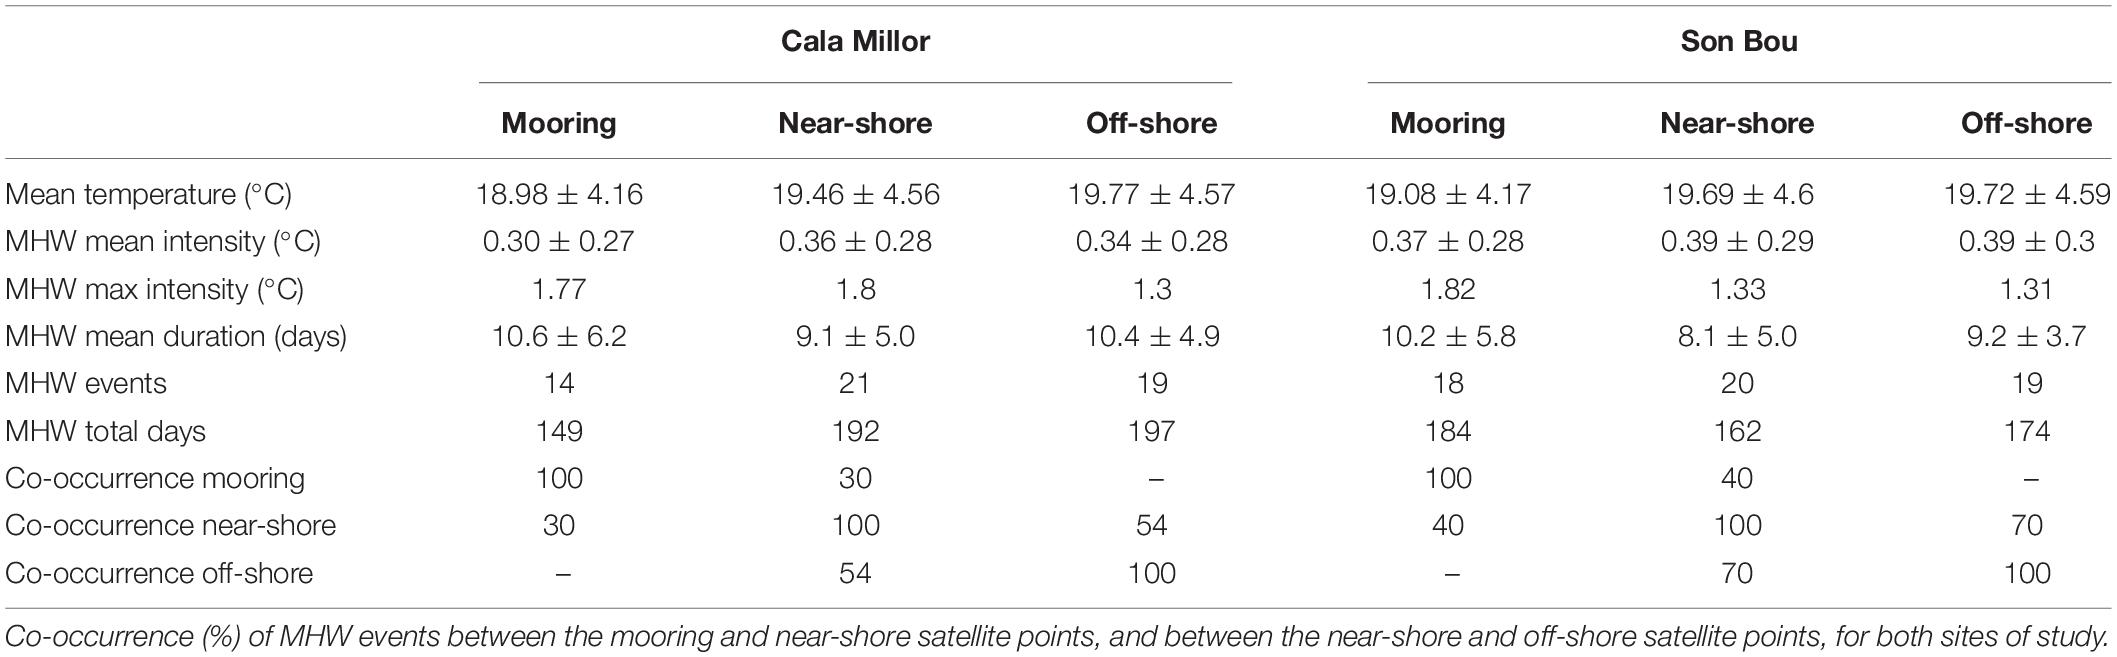
Table 4. Statistics on temperature and detected MHWs from the mooring, near-shore and off-shore satellite points over the common monitored period from 2012 to 2020 for both sites of study.
The in situ temperature time series show the marked seasonal variability with values varying from 12.57 to 27.65°C at Cala Millor and from 12.85 to 27.78°C at Son Bou (not shown, Table 4). The remote sensed temperature time series at the near-shore satellite grid point display warmer temperatures than in situ records ranging from 12.81 to 28.44°C and from 12.76 to 28.3°C in the two monitoring sites, respectively (not shown, Table 4). At Cala Millor and Son Bou, the daily mean time series of in situ and near-shore satellite SST are highly correlated (0.97 and 0.96, respectively) with a mean absolute error of 0.75 and 0.82°C, respectively. Differences between datasets are expected since in situ measurements are recorded at 17 m depth, while satellite data provide sea surface estimations; in this sense, deviation of values along the water column may occur, particularly during warmer seasons when the ocean is more stratified (Guillén et al., 2018). Moreover, in situ data are daily averaged from hourly measurements, including the diurnal fluctuations while satellite data are night-time images (Buongiorno Nardelli et al., 2013). Finally, additional differences are intrinsically related to the instrumentation and data processing (e.g., sensor type, calibration, quality-control procedure, correction or post-processing). The temperature time series at the off-shore satellite point have more amplitude than at the near-shore point with values oscillating between 12.73 and 28.8°C at Cala Millor and between 12.79 and 28.36°C at Son Bou over the period 2012–2020. The daily mean time series of near-shore and off-shore satellite data are fully correlated with a mean absolute error of 0.21 and 0.13°C at Cala Millor and Son Bou, respectively.
At Cala Millor, the total days of detected MHWs over 2012–2020 are higher in the satellite surface data (192 near-shore and 197 off-shore) than in the mooring data at 17 m depth (149) from which fewer events are detected. While the mean intensities of MHWs detected over 2012–2020 at the satellite near-shore and off-shore points have values of around 0.36 and 0.34°C at surface, respectively, the mean intensity of MHWs identified in the mooring at sub-surface has a smaller value of 0.30°C. At surface, the maximum intensity of the MHWs detected with the satellite from 2012 to 2020 reaches a warmer value near-shore (1.80°C) than off-shore (1.30°C). In the near-shore environment, the maximum intensities reach values of 1.80 and 1.77°C in satellite surface and mooring sub-surface data, respectively. At Cala Millor, in the near-shore area, the satellite surface point experienced higher MHW total days and maximum intensity over 2012–2020 than the mooring sub-surface point. At Son Bou beach, the MHW total days are higher in the mooring in sub-surface (184) than in the satellite surface data (162 near-shore and 174 off-shore). The mean intensity of the MHWs detected at surface from the satellite near-shore and off-shore data (0.39°C) is warmer than the mean intensity of the MHWs identified at sub-surface in mooring data (0.37°C). The MHW maximum intensity reached over 2012–2020 is warmer at the mooring (1.82°C) than at satellite grid points (1.33°C near-shore and 1.31°C off-shore). At Son Bou beach, the sub-surface near-shore waters as detected by the mooring show higher MHW total days and maximum intensity than the surface near-shore and off-shore waters as observed by satellites.
At both sites of study, the near-shore satellite point displays MHWs that reach higher maximum intensity than the off-shore point, among their respective detected events. The differences between near-shore and off-shore thermal signals suggest that further physical processes that are not involved in large-scale dynamics should be considered to understand the evolution of coastal MHWs, such as local wave and wind action as well as coastal orientation and configuration (e.g., embayment, headland, and bathymetry) that introduce eddies and perturbations to global circulation patterns (Schumann et al., 1995; Schlegel et al., 2017a). Moreover, the MHW characteristics, as detected in the near-shore environment, differ from the mooring location to the closest satellite point. As mentioned above, the difference between in situ data and satellite product may be attributed to the difference in datasets as well as in monitoring depths. Additionally, the thermal behavior of the coastal near-shore waters is different in the two beaches. At Cala Millor (Son Bou) beach, the total days of MHW events and the maximum intensity reached over the period 2012–2020 are higher (smaller) in the near-shore surface waters as detected by satellite than in the sub-surface waters as detected by the mooring (Table 4). The difference of behavior between the two sites may be attributed to specific local features and physical processes of the coast. In particular, the morphodynamic differences between both study sites and their exposure to different wind and wave at both large and local scales are potentially the drivers of such differences. Thus, the coastal near-shore response to MHW in sub-surface would strongly depend on the location.
Co-occurrence
Figure 11 shows the time-span along the year of MHW at mooring, near-shore and off-shore satellite points at both Cala Millor and Son Bou beaches for single years. At first sight, there is not a clear seasonal variability on MHW events at the different locations in terms of duration and months of detection. Additionally, the occurrence (frequency and length) in MHW events varies between the different locations. To determine the relation of detected MHW events between the coastal mooring, near-shore and corresponding off-shore satellite points, the co-occurrence of events is computed for each study site. The percentage of co-occurrence is calculated for the study time-interval (Table 4) in such a way that two events at different locations co-occur when they coincide in time at least 20% of the duration of the longest event. This minimum percentage of overlapping allows implicitly including the MHW duration. The values stand for the intercomparison between the off-shore and near-shore points, and between the near-shore and mooring points for each area of study.
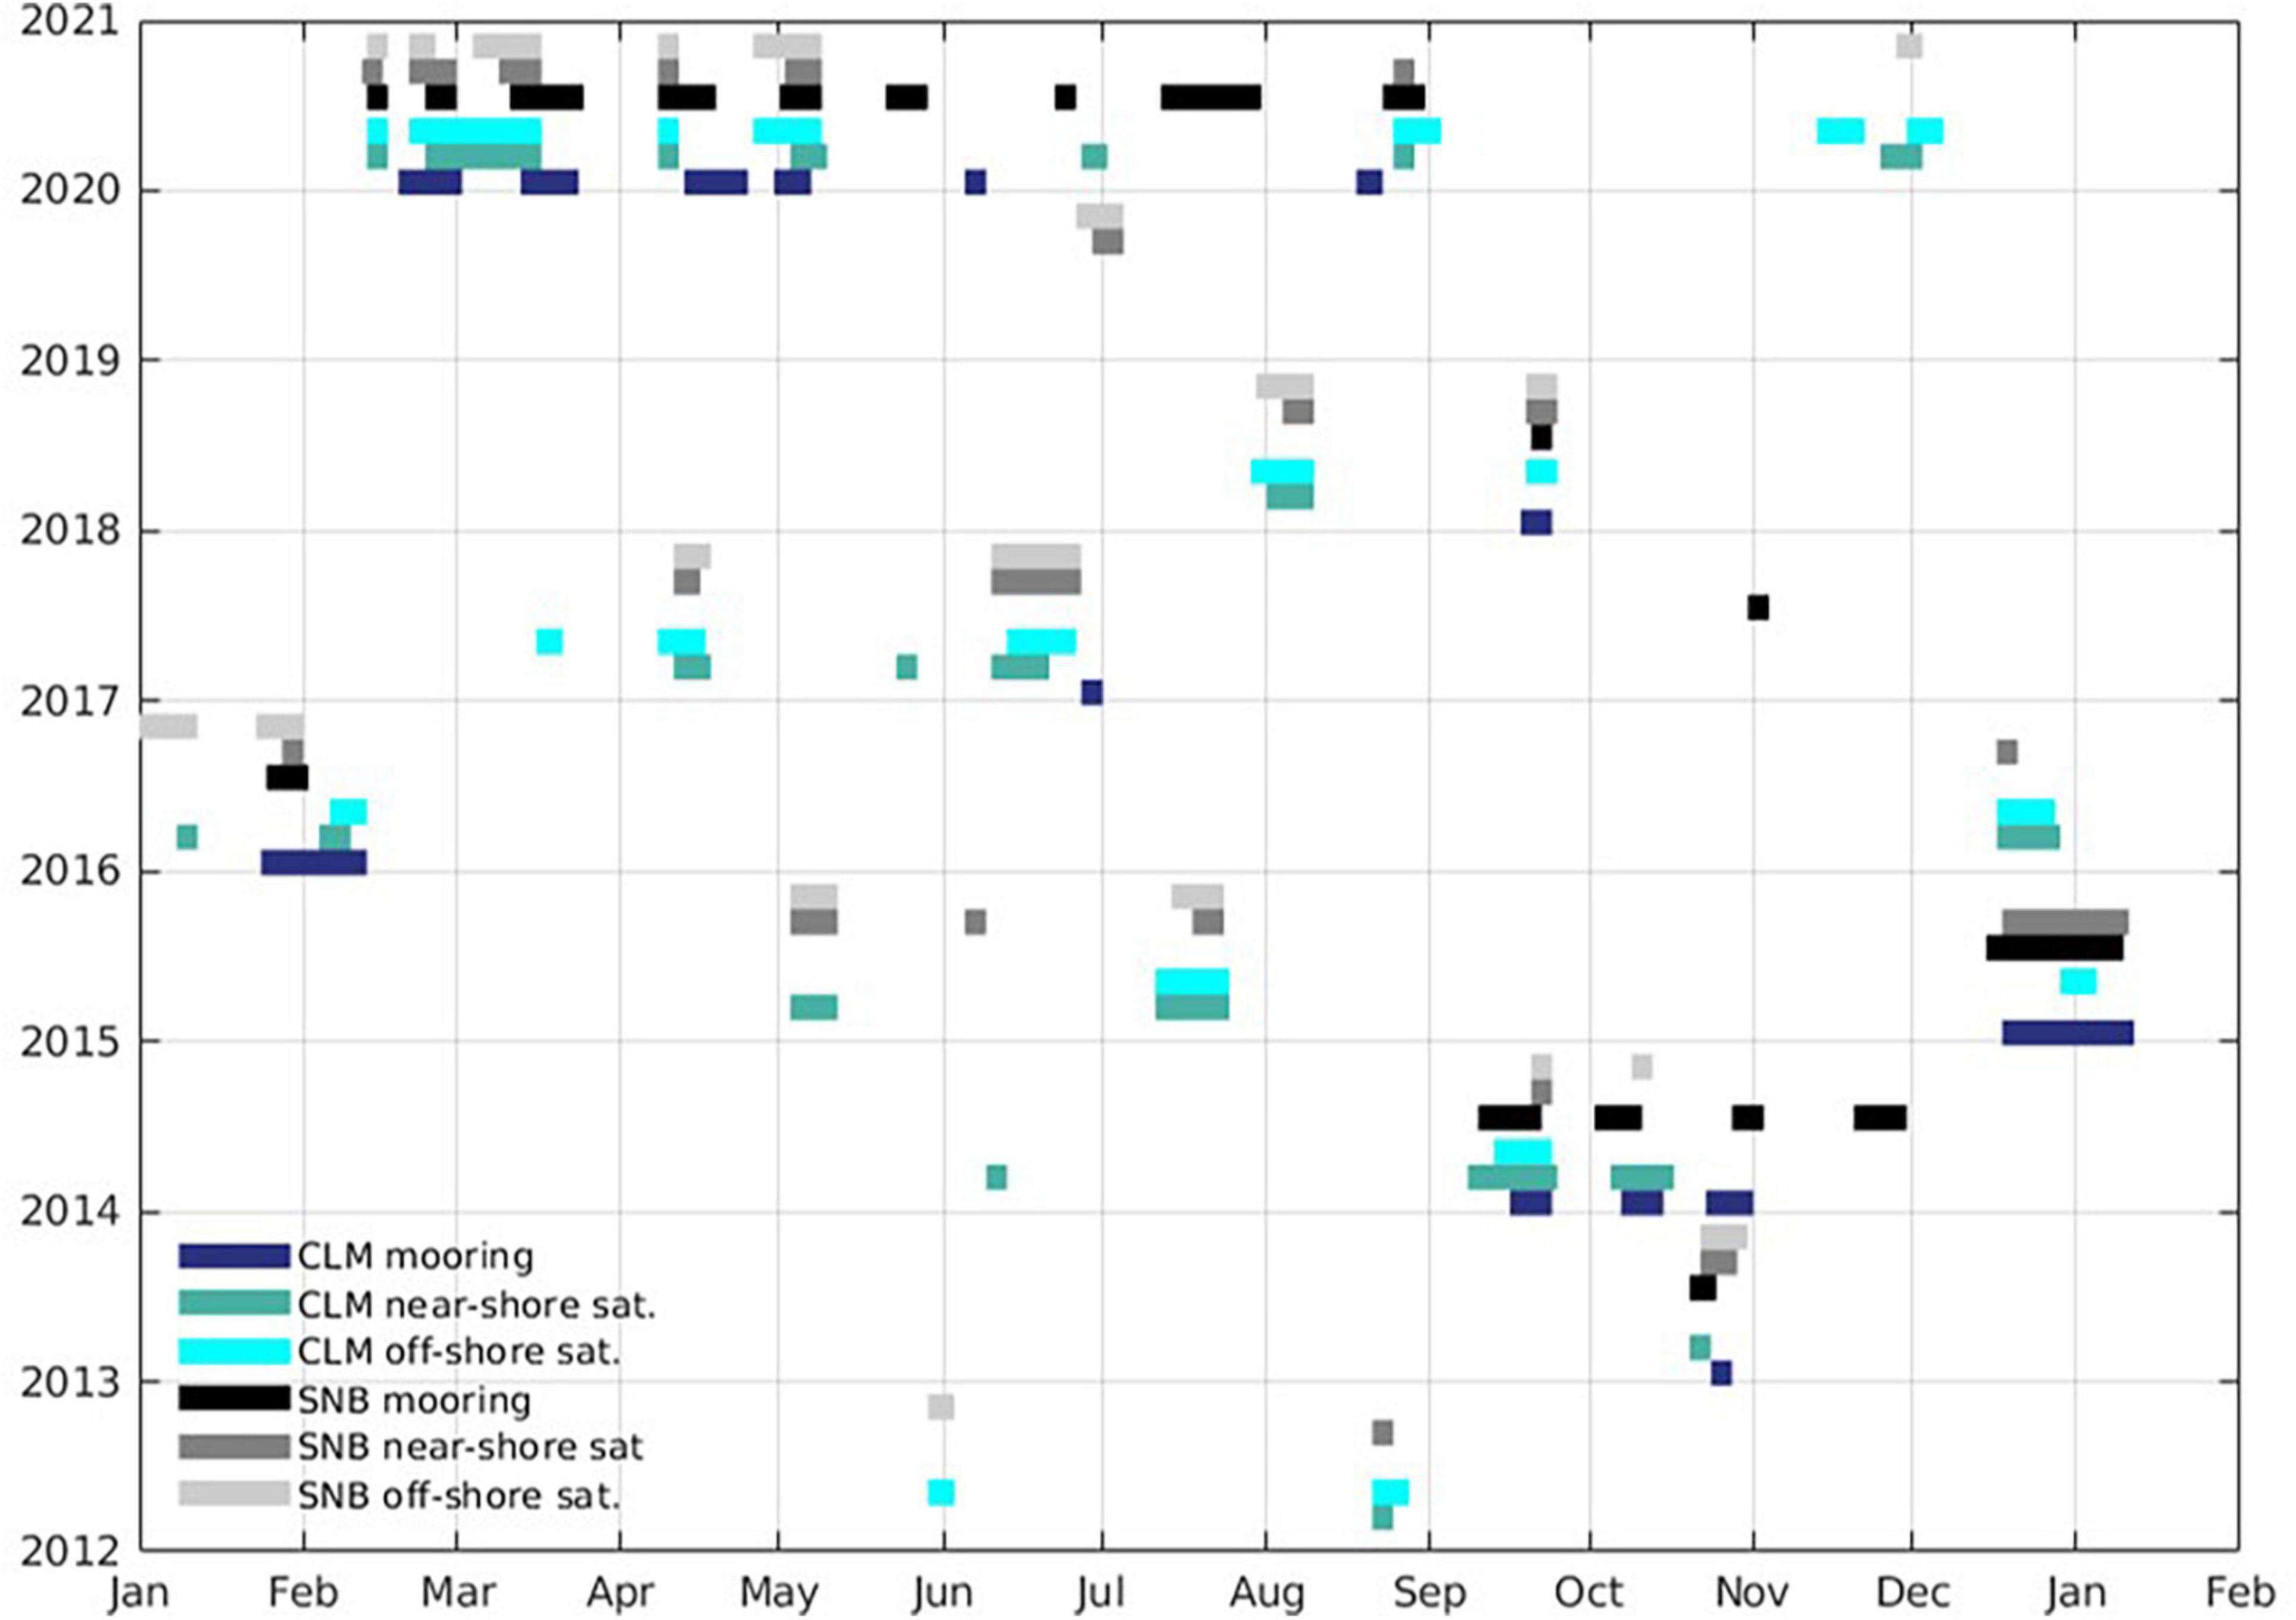
Figure 11. Time-span of MHW events from the mooring, near-shore and off-shore satellite points for single years for Cala Millor (blue colors) and Son Bou (gray colors) beaches.
The co-occurrences of registered events decrease when approaching the coast with values at Cala Millor and Son Bou between the offshore and near-shore points of 54 and 70%, respectively, and between the near-shore and mooring points of 33 and 40%, respectively. The decreasing concomitance toward the coast for both sites enhances the relevance of local scale processes on the evolution and propagation of MHWs in coastal areas. As aforementioned, the difference in MHW co-occurrences between the near-shore and off-shore locations as well as inside the near-shore environment may be related to the nature and variability of physical ocean processes, the near-shore water circulation being subject to the influence of morphodynamic features (e.g., bathymetry, shallow waters, coasts, and lands) and local response to external forcing (e.g., wind, wave, and current). At this stage, the atmospheric and oceanic conditions of co-occurrence and no co-occurrence as well as their seasonality have not been identified and would require further analysis supported by long-term observations and numerical simulations.
Discussion
In this section, the MHWs have been are identified using the recent 2012–2020 period reference due to the monitored period of the mooring data. Since SST and MHW events have substantially increased from 1982 to 2020 with a clear acceleration in recent years (as introduced in Section “Sub-Regional Approach” and shown in “Sub-Regional Marine Heat Waves”), the intensity, duration and frequency of MHWs as presently studied in coastal near-shore waters are probably underestimated. Indeed, the threshold climatologies established over the period 2012–2020 differ from the ones over 1982–2015 with warmer values (not shown). Consequently, fewer MHWs are detected using the 9-year climatology and have underestimated temperature and time characteristics. More specifically, at the satellite near-shore and off-shore points, the use of the 2012–2020 period as reference compared to the 1982–2015 period induces underestimations by 35–42, 33–43, 38–56, and 38–51% for the mean and maximum intensities, mean duration and number of events, respectively. Based on the most intense and longest MHW events given the use of a short-term climatology based on recent years, this section suggests the complex ocean behavior in the near-shore environment, where local effects strongly impact the near-shore ocean response to extreme event.
Conclusion and Perspectives
In a warming world, society is facing major climate-related challenges, risks and disasters. Among them, marine heat wave (MHW) events have devastating impacts on ecosystems, threaten economies that rely on them, and strengthen severe storms and flooding by warming the ocean. In the whole Mediterranean Sea, MHWs are increasing substantially in intensity, duration and frequency, with strong spatial variability highlighting the sub-regional response to global warming. All sub-regions are experiencing positive trends of all MHW characteristics with unprecedented intensification in recent years. The sub-regional trend estimations with 95% confidence for the MHW mean and maximum intensities, mean duration and event number oscillate over 0.06–013°C/decade, 0.26–0.55°C/decade, 1.23–3.82 days/decade and 1.1–1.8 events/decade, respectively.
The most intense and shallow events preferentially occur in summer and autumn, when the water column is the most stratified suggesting predominant air-sea fluxes (anomalous solar radiation), and high values extend at depth in winter when wind-induced vertical mixing weaken the stratification. The analysis of vertical hydrographic profiles during MHW events has showed the depth penetration of such events into the ocean interior as well as its sub-regional and seasonal variations. The upper-ocean thermal stratification is increasing due to the surface intensification of the warming signal leading to strengthen the upper-ocean density stratification. In the WMed, the salinity decrease also contributes to the density decrease in the upper layer while in the EMed, the salinity increase does not counteract the temperature increase. Thus, all sub-regions of the Mediterranean are experiencing strong surface density decrease. The resulting strengthening in upper-ocean density stratification will act as a barrier between the surface and deep water masses – modifying the ocean circulation and preventing the ocean ventilation –, and between the nutrient-poor surface and nutrient-rich sub-surface waters – impacting directly on the oceanic biological activities.
Moreover, the ocean response to climate warming also strongly varies from coastal areas to open ocean. A case study along the coasts of the Balearic Islands has showed the higher occurrence and maximum intensity in near-shore than off-shore areas. It has also highlighted that the local surface and sub-surface responses in near-shore environments may differ and strongly depend on the local features.
Giving access to relevant information on ocean state and variability at sub-regional scale through the development of tailored products to users will support the preparation for and the response to climate change, in particular in coastal zones (Juza and Tintoré, 2021). To support the achievement of international initiatives (e.g., UN SDG149 and UN Decade of Ocean Science for Sustainable Development) and to respond to both science and society needs, SOCIB has implemented a visualization tool to detect extreme warm temperature events in real-time and to follow their long-term evolution in response to global warming in the Mediterranean Sea. The event-based monitoring at sub-regional scale is a very valuable tool that can offer targeted information for diverse ocean stakeholders (e.g., general public, recreation, aquaculture, environmental agencies, and policy decision-makings) in real-time using observations or with short-term predictability using model forecasts, such as the 10-day forecasts from the Copernicus Marine Service Mediterranean Sea analysis and forecast model (Clementi et al., 2021).
Providing four-dimensional and continuous datasets, regional and coastal numerical simulations in the Mediterranean Sea (e.g., Copernicus Marine Service MED-MFC in the Mediterranean, Simoncelli et al., 2019; Clementi et al., 2021; SOCIB WMOP in the western Mediterranean, Juza et al., 2016b) are valuable data products that could help to better understand the drivers of MHWs and ocean response to warming signals, and thus to improve their predictability. They could complement observations in poorly or unevenly sampled dynamical regions (e.g., deep convection areas, upwelling and downwelling zones, permanent currents or mesoscale eddies) to better characterize the ocean processes involved in the MHW propagation (both vertical extent and horizontal advection), to estimate their contributions and thus to enhance the predictability depending on the sub-regional dynamics. This model-based analysis could be supported by observational platforms deployed in specific dynamical areas such as the fixed mooring and gliders in the deep convection area in Gulf of Lion (MOOSE network10; Testor et al., 2018), the SOCIB gliders in the Ibiza Channel (Heslop et al., 2012) or the fixed mooring in the Sicily Strait (Schroeder et al., 2017).
The coastal ocean is a crucial area [as internationally recognized through the Coastal Working Group of EuroGOOS (El Serafy, 2020) or the CoastPredict programme11 as a contribution to the UN Decade of Ocean Science] which is highly sensitive to climate change with major societal, economic and environmental impacts. Given the ocean response to global warming from sub-regional to local scales, long-term time series from additional in situ platforms such as coastal fixed moorings (e.g., the network operated by Puertos del Estado12) and repeated cruise fixed stations (e.g., the RADMED monitoring program13 along the Iberian coast) could provide long-term based climatologies and relevant information at local scale in coastal areas. Additionally, in complement to satellite products, high temporal resolution in situ measurements at local scale could provide a more accurate representation of the thermal signal near the coast, capturing diurnal fluctuations and local-scale deviations that affect coastal ecological processes (Leichter et al., 2006; Castillo and Lima, 2010).
Better understanding the ocean behavior in response to extreme events, improving their prediction, fostering their monitoring and facilitating access to ocean information from local to sub-regional scales will help to implement adaptive management, to establish adaptation strategy and to support the marine conservation and sustainable management of the oceans in a warming world.
Data Availability Statement
The datasets used in this study can be found in online repositories. The names of the repository/repositories and accession number(s) can be found in the article/Supplementary Material.
Author Contributions
MJ contributed to the conception and design of the study, data processing, interpretation of the data, scientific discussion, and writing of the manuscript. ÀF-M contributed to data processing, interpretation of the data, scientific discussion, and writing section. JT contributed to scientific discussion and revision of the manuscript. All authors contributed to the article and approved the submitted version.
Funding
Part of this work was supported by the EuroSea project (www.eurosea.eu), which has received funding from the European Union’s Horizon 2020 Research and Innovation Programme under grant agreement No. 862626.
Conflict of Interest
The authors declare that the research was conducted in the absence of any commercial or financial relationships that could be construed as a potential conflict of interest.
Publisher’s Note
All claims expressed in this article are solely those of the authors and do not necessarily represent those of their affiliated organizations, or those of the publisher, the editors and the reviewers. Any product that may be evaluated in this article, or claim that may be made by its manufacturer, is not guaranteed or endorsed by the publisher.
Acknowledgments
We gratefully acknowledge the two reviewers for their careful reading and very relevant comments that helped us to improve the manuscript. The sub-regional and local marine heat waves of this study are computed using the following free and open access data: (1) near real-time and reprocessed satellite products distributed by CMEMS (https://marine.copernicus.eu/), (2) quality-controlled in situ hydrographic profiles from the EN4.2.1 dataset distributed by Met-Office (https://www.metoffice.gov.uk/hadobs/en4/), (3) the monthly climatology of temperature and salinity from SeaDataNet (www.seadatanet.org), and (4) mooring data collected and distributed by SOCIB (www.socib.es).
Footnotes
- ^ https://marine.copernicus.eu
- ^ https://resources.marine.copernicus.eu/product-detail/SST_MED_SST_L4_REP_OBSERVATIONS_010_021/INFORMATION [accessed November 22, 2021]
- ^ https://resources.marine.copernicus.eu/product-detail/SST_MED_SST_L4_NRT_OBSERVATIONS_010_004/INFORMATION [accessed November 22, 2021]
- ^ https://catalogue.marine.copernicus.eu/documents/QUID/CMEMS-SST-QUID-010-004-006-012-013.pdf
- ^ www.metoffice.gov.uk/hadobs/en4/
- ^ https://www.seadatanet.org/
- ^ https://doi.org/10.12770/3f8eaace-9f9b-4b1b-a7a4-9c55270e205a
- ^ https://doi.org/10.25704/ra9h-5127
- ^ https://un.org/sustainabledevelopment/sustainable-development-goals/
- ^ www.moose-network.fr/
- ^ https://www.coastpredict.org/
- ^ www.puertos.es
- ^ www.ieo.es
References
Álvarez-Ellacuria, A., Orfila, A., Gómez-Pujol, L., Simarro, G., and Obregon, N. (2011). Decoupling spatial and temporal patterns in short-term beach shoreline response to wave climate. Geomorphology 128, 199–208.
Arias-Ortiz, A., Serrano, O., Masqué, P., Lavery, P. S., Mueller, U., Kendrick, G. A., et al. (2018). A marine heatwave drives massive losses from the world’s largest seagrass carbon stocks. Nat. Clim. Change. 8, 338–344.
Bakun, A., and Agostini, V. N. (2001). Seasonal patterns of wind-induced upwelling/downwelling in the Mediterranean sea. Sci. Mar. 65, 243–257.
Bensoussan, N., Chiggiato, J., Buongiorno Nardelli, B., Pisano, A., and Garrabou, J. (2019). Insights on 2017 marine heat waves in the Mediterranean Sea. copernicus marine service ocean state report: issue 3. J. Operational Oceanogr. 12, 101–108.
Benthuysen, J. A., Oliver, E. C., Feng, M., and Marshall, A. G. (2018). Extreme marine warming across tropical Australia during austral summer 2015–2016. J. Geophys. Res. Oceans 123, 1301–1326. doi: 10.1002/2017jc013326
Bethoux, J. P., Gentili, B., Morin, P., Nicolas, E., Pierre, C., and Ruiz-Pino, D. (1999). The Mediterranean sea: a miniature ocean for climatic and environmental studies and a key for the climatic functioning of the North Atlantic. Prog. Oceanogr. 44, 131–146. doi: 10.1016/s0079-6611(99)00023-3
Bond, N. A., Cronin, M. F., Freeland, H., and Mantua, N. (2015). Causes and impacts of the 2014 warm anomaly in the NE Pacific. Geophys. Res. Lett. 42, 3414–3420. doi: 10.1002/2015gl063306
Buongiorno Nardelli, B., Tronconi, C., Pisano, A., and Santoleri, R. (2013). High and Ultra-High resolution processing of satellite sea surface temperature data over Southern European Seas in the framework of MyOcean project. Remote Sens. Environ. 129, 1–16. doi: 10.1016/j.rse.2012.10.012
Capotondi, A., Alexander, M. A., Bond, N. A., Curchitser, E. N., and Scott, J. D. (2012). Enhanced upper ocean stratification with climate change in the CMIP3 models. J. Geophys. Res. Atmospheres 117:4031.
Castillo, K., and Lima, F. (2010). Comparison of in situ and satellite-derived (MODIS-Aqua/Terra) methods for assessing temperatures on coral reefs. Limnol. Oceanogr. Methods 8, 107–117. doi: 10.4319/lom.2010.8.0107
Cerrano, C., Bavestrello, G., Bianchi, C. N., Cattaneo-Vietti, R., Bava, S., Morganti, C., et al. (2000). A catastrophic mass-mortality episode of gorgonians and other organisms in the Ligurian Sea (North-western Mediterranean), summer 1999. Ecol. Lett. 3, 284–293. doi: 10.1046/j.1461-0248.2000.00152.x
Chelton, D. B. (1983). Effects of sampling errors in statistical estimation. Deep Sea Res. Part A Oceanogr. Res. Pap. 30, 1083–1103. doi: 10.1016/0198-0149(83)90062-6
Clementi, E., Aydogdu, A., Goglio, A. C., Pistoia, J., Escudier, R., Drudi, M., et al. (2021). Mediterranean sea physical analysis and forecast (CMEMS MED-Currents, EAS6 system) (Version 1) [Data set]. Copernicus Monit. Environ. Mar. Serv.
Coma, R., Ribes, M., Serrano, E., Jiménez, E., Salat, J., and Pascual, J. (2009). Global warming-enhanced stratification and mass mortality events in the Mediterranean. Proc. Natl. Acad. Sci. 106, 6176–6181. doi: 10.1073/pnas.0805801106
Curry, R., Dickson, B., and Yashayaev, I. (2003). A change in the freshwater balance of the Atlantic Ocean over the past four decades. Nature 426, 826–829. doi: 10.1038/nature02206
D’Ortenzio, F., and Ribera d’Alcalá, M. R. (2009). On the trophic regimes of the Mediterranean sea: a satellite analysis. Biogeosciences 6, 139–148. doi: 10.5194/bg-6-139-2009
Darmaraki, S., Somot, S., Sevault, F., and Nabat, P. (2019). Past variability of Mediterranean sea marine heatwaves. Geophys. Res. Lett. 46, 9813–9823. doi: 10.1029/2019gl082933
El Serafy, G. (2020). “Aim, activities and early outcomes of the coastal working group of the european global ocean observing system (EuroGOOS),” in Proceedings of the EGU General Assembly Conference Abstracts (Germany: EGU).
Elzahaby, Y., and Schaeffer, A. (2019). Observational insight into the subsurface anomalies of marine heatwaves. Front. Mar. Sci. 6:745.
Enríquez, A. R., Marcos, M., Álvarez-Ellacuria, A., Orfila, A., and Gomis, D. (2017). Changes in beach shoreline due to sea level rise and waves under climate change scenarios: application to the Balearic Islands (western Mediterranean). Nat. Hazards Earth Syst. Sci. 17, 1075–1089. doi: 10.5194/nhess-17-1075-2017
Enríquez, A. R., Marcos, M., Falqués, A., and Roelvink, D. (2019). Assessing beach and dune erosion and vulnerability under sea level rise: a case study in the Mediterranean sea. Front. Mar. Sci. 6:4. doi: 10.9753/icce.v32.management.4
Frajka-Williams, E., Rhines, P. B., and Eriksen, C. C. (2014). Horizontal stratification during deep convection in the Labrador sea. J. Phys. Oceanogr. 44, 220–228. doi: 10.1175/jpo-d-13-069.1
Frölicher, T. L., Fischer, E. M., and Gruber, N. (2018). Marine heatwaves under global warming. Nature 560, 360–364. doi: 10.1038/s41586-018-0383-9
Fu, W., Randerson, J. T., and Moore, J. K. (2016). Climate change impacts on net primary production (NPP) and export production (EP) regulated by increasing stratification and phytoplankton community structure in the CMIP5 models. Biogeoscience 13, 5151–5170.
Garrabou, J., Coma, R., Bensoussan, N., Bally, M., Chevaldonné, P., Cigliano, M., et al. (2009). Mass mortality in North-western Mediterranean rocky benthic communities: effects of the 2003 heat wave. Glob. Change Biol. 15, 1090–1103.
Gómez-Pujol, L., Orfila, A., Álvarez-Ellacuria, A., and Tintoré, J. (2011). Controls on sediment dynamics and medium-term morphological change in a barred microtidal beach (Cala Millor, Mallorca, Western Mediterranean). Geomorphology 132, 87–98.
Good, S. A., Martin, M. J., and Rayner, N. A. (2013). EN4: quality controlled ocean temperature and salinity profiles and monthly objective analyses with uncertainty estimates. J. Geophys. Res. 118, 6704–6716.
Gouretski, V., and Reseghetti, F. (2010). On depth and temperature biases in bathythermograph data: development of a new correction scheme based on analysis of a global ocean database. Deep Sea Res. I Oceanogr. Res. Pap. 57, 812–833.
Guillén, J., Arin, L., Salat, J., Puig, P., Estrada, M., Palanques, A., et al. (2018). Coastal oceanographic signatures of heat waves and extreme events of dense water formation during the period 2002-2012 (Barcelona, NW Mediterranean). Sci. Mar. 82, 189–206.
Gupta, A. S., Thomsen, M., Benthuysen, J. A., Hobday, A. J., Oliver, E., Alexander, L. V., et al. (2020). Drivers and impacts of the most extreme marine heatwave events. Sci. Rep. 10:19359.
Herrmann, M., Sevault, F., Beuvier, J., and Somot, S. (2010). What induced the exceptional 2005 convection event in the northwestern Mediterranean basin? Answers from a modeling 956 study. J. Geophys. Res. Oceans 115:C12051. doi: 10.1029/2010JC006162
Heslop, E. E., Ruiz, S., Allen, J., López-Jurado, J. L., Renault, L., and Tintoré, J. (2012). Autonomous underwater gliders monitoring variability at “choke points” in our ocean system: a case study in the Western Mediterranean sea. Geophys. Res. Lett. 39:L20604.
Hobday, A. J., Alexander, L. V., Perkins, S. E., Smale, D. A., Straub, S. C., Oliver, E. C., et al. (2016). A hierarchical approach to defining marine heatwaves. Prog. Oceanogr. 141, 227–238. doi: 10.1016/j.pocean.2015.12.014
Hobday, A. J., Oliver, E. C., Gupta, A. S., Benthuysen, J. A., Burrows, M. T., Donat, M. G., et al. (2018). Categorizing and naming marine heatwaves. Oceanography 31, 162–173.
Holbrook, N. J., Gupta, A. S., Oliver, E. C., Hobday, A. J., Benthuysen, J. A., Scannell, H. A., et al. (2020). Keeping pace with marine heatwaves. Nat. Rev. Earth Environ. 1, 482–493.
Holbrook, N. J., Scannell, H. A., Gupta, A. S., Benthuysen, J. A., Feng, M., Oliver, E. C., et al. (2019). A global assessment of marine heatwaves and their drivers. Nat. Commun. 10:2624. doi: 10.1038/s41467-019-10206-z
Houpert, L., Durrieu, De Madron, X., Testor, P., Bosse, A., D’ortenzio, F., et al. (2016). Observations of open-ocean deep convection in the northwestern Mediterranean Sea: seasonal and interannual variability of mixing and deep water masses for the 2007–2013 period. J. Geophys. Res. 121, 8139–8171.
Hughes, T. P., Kerry, J. T., Baird, A. H., Connolly, S. R., Dietzel, A., Eakin, C. M., et al. (2018). Global warming transforms coral reef assemblages. Nature 556, 492–496. doi: 10.1038/s41586-018-0041-2
Ibrahim, O., Mohamed, B., and Nagy, H. (2021). Spatial variability and trends of marine heat waves in the Eastern Mediterranean sea over 39 years. J. Mar. Sci. Eng. 9:643. doi: 10.3390/jmse9060643
Johnson, C. R., Banks, S. C., Barrett, N. S., Cazassus, F., Dunstan, P. K., Edgar, G. J., et al. (2011). Climate change cascades: shifts in oceanography, species’ ranges and subtidal marine community dynamics in eastern Tasmania. J. Exp. Mar. Biol. Ecol. 400, 17–32.
Jones, T., Parrish, J. K., Peterson, W. T., Bjorkstedt, E. P., Bond, N. A., Ballance, L. T., et al. (2018). Massive mortality of a planktivorous seabird in response to a marine heatwave. Geophys. Res. Lett. 45, 3193–3202. doi: 10.1002/2017gl076164
Juza, M., and Tintoré, J. (2021). Multivariate sub-regional ocean indicators in the Mediterranean sea: from event detection to climate change estimations. Front. Mar. Sci. 8:610589.
Juza, M., Escudier, R., Vargas-Yáñez, M., Mourre, B., Heslop, E., Allen, J., et al. (2019). Characterization of changes in Western Intermediate Water properties enabled by an innovative geometry-based detection approach. J. Mar. Syst. 191, 1–12. doi: 10.1016/j.jmarsys.2018.11.003
Juza, M., Mourre, B., Lellouche, J. M., Tonani, M., and Tintoré, J. (2016a). From basin to sub-basin scale assessment and intercomparison of numerical simulations in the Western Mediterranean sea. J. Mar. Syst. 149, 36–49. doi: 10.1016/j.jmarsys.2015.04.010
Juza, M., Mourre, B., Renault, L., Gómara, S., Sebastián, K., Lora, S., et al. (2016b). SOCIB operational ocean forecasting system and multi-platform validation in the Western Mediterranean sea. J. Operational Oceanogr. 9, S155–S166.
Lavigne, H., D’ortenzio, F., Ribera, D., Alcalà, M., Claustre, H., Sauzède, R., et al. (2015). On the vertical distribution of the chlorophyll a concentration in the Mediterranean sea: a basin-scale and seasonal approach. Biogeosciences 12, 5021–5039. doi: 10.5194/bg-12-5021-2015
Lee, T., Hobbs, W. R., Willis, J. K., Halkides, D., Fukumori, I., Edward, K., et al. (2010). Record warming in the South Pacific and western Antarctica associated with the strong central-Pacific El Niño in 2009–10. Geophys. Res. Lett. 37:L19704.
Leichter, J. J., Helmuth, B., and Fischer, A. M. (2006). Variation beneath the surface: quantifying complex thermal environments on coral reefs in the Caribbean, Bahamas, and Florida. J. Mar. Res. 64, 563–588. doi: 10.1357/002224006778715711
Lionello, P., and Scarascia, L. (2018). The relation between climate change in the Mediterranean region and global warming. Reg. Environ. Change 18, 1481–1493. doi: 10.1007/s10113-018-1290-1
Malanotte-Rizzoli, P., Manca, B. B., d’Alcala, M. R., Theocharis, A., Brenner, S., Budillon, G., et al. (1999). The Eastern Mediterranean in the 80s and in the 90s: the big transition in the intermediate and deep circulations. Dyn. Atmospheres Oceans 29, 365–395. doi: 10.1016/s0377-0265(99)00011-1
Manca, B., Burca, M., Giorgetti, A., Coatanoan, C., Garcia, M. J., and Iona, A. (2004). Physical and biochemical averaged vertical profiles in the Mediterranean regions: an important tool to trace the climatology of water masses and to validate incoming data from operational oceanography. J. Mar. Syst. 48, 83–116. doi: 10.1016/j.jmarsys.2003.11.025
Mayot, N., D’Ortenzio, F., d’Alcala, M. R., Lavigne, H., and Claustre, H. (2016). Interannual variability of the Mediterranean trophic regimes from ocean color satellites. Biogeosciences 13, 1901–1917.
Mills, K. E., Pershing, A. J., Brown, C. J., Chen, Y., Chiang, F. S., Holland, D. S., et al. (2013). Fisheries management in a changing climate: lessons from the 2012 ocean heat wave in the Northwest Atlantic. Oceanography 26, 191–195.
Moore, J. K., Fu, W., Primeau, F., Britten, G. L., Lindsay, K., Long, M., et al. (2018). Sustained climate warming drives declining marine biological productivity. Science 359, 1139–1143. doi: 10.1126/science.aao6379
Mosetti, F. (1983). Caratteristiche fondamentali dell’idrologia dell’Adriatico. Boll. Ocean. Teor. Appl. 2, 169–194.
Olita, A., Sorgente, R., Natale, S., Gaberšek, S., Ribotti, A., Bonanno, A., et al. (2007). Effects of the 2003 European heatwave on the central Mediterranean sea: surface fluxes and the dynamical response. Ocean Sci. 3, 273–289.
Oliver, E. C., Donat, M. G., Burrows, M. T., Moore, P. J., Smale, D. A., Alexander, L. V., et al. (2018). Longer and more frequent marine heatwaves over the past century. Nat. Commun. 9:1324. doi: 10.1038/s41467-018-03732-9
Ozer, T., Gertman, I., Kress, N., Silverman, J., and Herut, B. (2017). Interannual thermohaline (1979–2014) and nutrient (2002–2014) dynamics in the Levantine surface and intermediate water masses, SE Mediterranean sea. Glob. Planet. Change 151, 60–67.
Pinardi, N., Zavatarelli, M., Adani, M., Coppini, G., Fratianni, C., Oddo, P., et al. (2015). Mediterranean sea large-scale low-frequency ocean variability and water mass formation rates from 1987 to 2007: a retrospective analysis. Prog. Oceanogr. 132, 318–332. doi: 10.1016/j.pocean.2013.11.003
Pisano, A., Marullo, S., Artale, V., Falcini, F., Yang, C., Leonelli, F. E., et al. (2020). New evidence of Mediterranean climate change and variability from sea surface temperature observations. Remote Sens. 12:132. doi: 10.1371/journal.pone.0010633
Pisano, A., Nardelli, B. B., Tronconi, C., and Santoleri, R. (2016). The new Mediterranean optimally interpolated pathfinder AVHRR SST dataset (1982–2012). Remote Sens. Environ. 176, 107–116. doi: 10.1016/j.rse.2016.01.019
Rhein, M., Rintoul, S. R., Aoki, S., Campos, E., Chambers, D., Feely, R. A., et al. (2013). “Observations: ocean,” in Climate Change 2013: the Physical Science Basis. Contribution of Working Group I to the Fifth Assessment Report of the Intergovernmental Panel on Climate Change, Observations: Ocean, Chap. 3, ed. T. F. Stocker (Cambridge: Cambridge University Press).
Robinson, A. R., Golnaraghi, M., Leslie, W. G., Artegiani, A., Hecht, A., Lazzoni, E., et al. (1991). The eastern Mediterranean general circulation: features, structure and variability. Dyn. Atmospheres Oceans 15, 215–240. doi: 10.1016/0377-0265(91)90021-7
Robinson, A. R., Leslie, W. G., Theocharis, A., and Lascaratos, A. (2001). Mediterranean sea circulation. Ocean Currents 1:19.
Santora, J. A., Mantua, N. J., Schroeder, I. D., Field, J. C., Hazen, E. L., Bograd, S. J., et al. (2020). Habitat compression and ecosystem shifts as potential links between marine heatwave and record whale entanglements. Nat. Commun. 11:536. doi: 10.1038/s41467-019-14215-w
Schaeffer, A., and Roughan, M. (2017). Subsurface intensification of marine heatwaves off southeastern Australia: the role of stratification and local winds. Geophys. Res. Lett. 44, 5025–5033. doi: 10.1002/2017gl073714
Schlegel, R. W., Oliver, E. C., Perkins-Kirkpatrick, S., Kruger, A., and Smit, A. J. (2017a). Predominant atmospheric and oceanic patterns during coastal marine heatwaves. Front. Mar. Sci. 4:323. doi: 10.1007/978-3-319-54304-8_15
Schlegel, R. W., Oliver, E., Wernberg, T., and Smit, A. J. (2017b). Nearshore and offshore co-occurrence of marine heatwaves and cold-spells. Prog. Oceanogr. 151, 189–205. doi: 10.1016/j.pocean.2017.01.004
Schroeder, K., Chiggiato, J., Bryden, H. L., Borghini, M., and Ben Ismail, S. (2016). Abrupt climate shift in the western Mediterranean Sea. Sci. Rep. 6:23009. doi: 10.1038/srep23009
Schröder, K., Gasparini, G. P., Tangherlini, M., and Astraldi, M. (2006). Deep and intermediate water in the western Mediterranean under the influence of the Eastern Mediterranean Transient. Geophys. Res. Lett. 33:L21607. doi: 10.1029/2006GL027121
Schroeder, K., Chiggiato, J., Josey, S. A., Borghini, M., Araci, S., and Sparnocchia, S. (2017). Rapid response to climate change in a marginal sea. Sci. Rep. 7:4065. doi: 10.1038/s41598-017-04455-5
Schumann, E., Cohen, A., and Jury, M. (1995). Coastal sea surface temperature variability along the south coast of South Africa and the relationship to regional and global climate. J. Mar. Res. 53, 231–248. doi: 10.1016/j.scitotenv.2020.143740
Short, J., Foster, T., Falter, J., Kendrick, G. A., and McCulloch, M. T. (2015). Crustose coralline algal growth, calcification and mortality following a marine heatwave in Western Australia. Cont. Shelf Res. 106, 38–44. doi: 10.1016/j.csr.2015.07.003
Simoncelli, S., Fratianni, C., Pinardi, N., Grandi, A., Drudi, M., Oddo, P., et al. (2019). Mediterranean Sea Physical Reanalysis (CMEMS MED-Physics). Copernicus Monitoring Environment Marine Service (CMEMS). Available online at: https://doi.org/10.25423/MEDSEA_REANALYSIS_PHYS_006_004 (accessed November 22, 2021).
Smale, D. A., Wernberg, T., Oliver, E. C., Thomsen, M., Harvey, B. P., Straub, S. C., et al. (2019). Marine heatwaves threaten global biodiversity and the provision of ecosystem services. Nat. Clim. Chang. 9, 306–312. doi: 10.1038/s41558-019-0412-1
Smith, W. H., and Sandwell, D. T. (1997). Global sea floor topography from satellite altimetry and ship depth soundings. Science 277, 1956–1962.
Somot, S., Houpert, L., Sevault, F., Testor, P., Bosse, A., Taupier-Letage, I., et al. (2018). Characterizing, modelling and understanding the climate variability of the deep water formation in the North-Western Mediterranean sea. Clim. Dyn. 51, 1179–1210. doi: 10.1007/s00382-016-3295-0
Somot, S., Sevault, F., and Déqué, M. (2006). Transient climate change scenario simulation of the Mediterranean sea for the twenty-first century using a high-resolution ocean circulation model. Clim. Dyn. 27, 851–879.
Sparnocchia, S., Schiano, M. E., Picco, P., Bozzano, R., and Cappelletti, A. (2006). The anomalous warming of summer 2003 in the surface layer of the Central Ligurian Sea (Western Mediterranean). Ann. Geophys. 24, 443–452.
Testor, P., Bosse, A., Houpert, L., Margirier, F., Mortier, L., Legoff, H., et al. (2018). Multiscale observations of deep convection in the northwestern Mediterranean Sea during winter 2012–2013 using multiple platforms. J. Geophys. Res. Oceans 123, 1745–1776.
Tintoré, J., Medina, R., Gómez-Pujol, L., Orfila, A., and Vizoso, G. (2009). Integrated and interdisciplinary scientific approach to coastal management. Ocean Coast. Manag. 52, 493–505.
Tintoré, J., Vizoso, G., Casas, B., Heslop, E., Pascual, A., Orfila, A., et al. (2013). SOCIB: the Balearic Islands coastal ocean observing and forecasting system responding to science, technology and society needs. Mar. Technol. Soc. J. 47, 101–117.
Vargas-Yáñez, M., Juza, M., Balbín, R., Vélez Belchí, P., García-Martínez, M. C., Moya, F., et al. (2020). Climatological hydrographic properties and water mass transports in the Balearic channels from repeated observations over 1996–2019. Front. Mar. Sci. 7:568602.
Vargas-Yáñez, M., Juza, M., Garcia-Martinez, M., Moya Ruiz, F., Balbín, R., Ballesteros, E., et al. (2021). Long-term changes in the water mass properties and sea level in the Balearic channels over the period 1996-2019. Front. Mar. Sci. 8:640535.
Verdura, J., Linares, C., Ballesteros, E., Coma, R., Uriz, M. J., Bensoussan, N., et al. (2019). Biodiversity loss in a Mediterranean ecosystem due to an extreme warming event unveils the role of an engineering gorgonian species. Sci. Rep. 9:5911. doi: 10.1038/s41598-019-41929-0
von Schuckmann, K., Le Traon, P.-Y., Smith, N., Pascual, A., Djavidnia, S., Gattuso, J. P., et al. (2020). Copernicus marine service ocean state report, issue 4. J. Operat. Oceanogr. 12, S1–S123.
Wernberg, T. (2021). “Marine heatwave drives collapse of kelp forests in Western Australia,” in Ecosystem Collapse and Climate Change. Ecological Studies (Analysis and Synthesis), Vol 241, eds J. G. Canadell and R. B. Jackson (Cham: Springer). doi: 10.1016/j.cub.2020.01.051
Wernberg, T., Bennett, S., Babcock, R. C., De Bettignies, T., Cure, K., Depczynski, M., et al. (2016). Climate-driven regime shift of a temperate marine ecosystem. Science 353, 169–172. doi: 10.1126/science.aad8745
Wernberg, T., Smale, D. A., Tuya, F., Thomsen, M. S., Langlois, T. J., De Bettignies, T., et al. (2013). An extreme climatic event alters marine ecosystem structure in a global biodiversity hotspot. Nat. Clim. Change 3, 78–82.
Keywords: marine heat waves, Mediterranean sub-regions, event detection, long-term changes, depth propagation, coastal near-shore waters
Citation: Juza M, Fernández-Mora À and Tintoré J (2022) Sub-Regional Marine Heat Waves in the Mediterranean Sea From Observations: Long-Term Surface Changes, Sub-Surface and Coastal Responses. Front. Mar. Sci. 9:785771. doi: 10.3389/fmars.2022.785771
Received: 29 September 2021; Accepted: 13 January 2022;
Published: 02 March 2022.
Edited by:
Laurent Coppola, UMR 7093 Laboratoire d’Océanographie de Villefranche (LOV), FranceReviewed by:
Félix Margirier, Georgia Institute of Technology, United StatesBayoumy Mohamed, Alexandria University, Egypt
Copyright © 2022 Juza, Fernández-Mora and Tintoré. This is an open-access article distributed under the terms of the Creative Commons Attribution License (CC BY). The use, distribution or reproduction in other forums is permitted, provided the original author(s) and the copyright owner(s) are credited and that the original publication in this journal is cited, in accordance with accepted academic practice. No use, distribution or reproduction is permitted which does not comply with these terms.
*Correspondence: Mélanie Juza, mjuza@socib.es