Phytoplankton Community Performance Depends on the Frequency of Temperature Fluctuations
 Charlotte Kunze1*
  Miriam Gerhard1
  Marrit Jacob2
  Niklas Alexander Franke1
  Matthias Schröder1
  Maren Striebel1
- 1Institute for Chemistry and Biology of Marine Environments (ICBM), Carl-von-Ossietzky University of Oldenburg, Oldenburg, Germany
- 2Faculty of Biology/Chemistry, University of Bremen, Bremen, Germany
With increasing frequency and intensity of climate change events, it is crucial to understand how different components of temperature fluctuations affect the thermal tolerance and performance of marine primary producers. We used a controlled indoor-mesocosm set-up to test the effect of a temperature fluctuation frequency gradient on a natural phytoplankton community. Within a frequency gradient, we allowed the temperature to fluctuate from 18 ± 3°C at different rates (6, 12, 24, 36, and 48 h). The temperature fluctuation frequency gradient was contrasted to a constant temperature treatment with the same mean temperature (18°C). Phytoplankton biomass tended to increase with faster fluctuations but was lowest in the diurnal frequency treatment (24 h). In comparison with constant conditions, diurnal or slower fluctuation frequencies showed lower or comparable performance, whereas faster fluctuations showed higher performance. In addition, minor differences in community structure were observed, but species diversity remained comparable over time. Similarly, resource use efficiency and stoichiometry did not change according to fluctuation frequency treatments. We conclude that the effect of temperature fluctuations on phytoplankton biomass depends on the fluctuation frequency; this suggests that the fluctuation frequency determines how organisms average their environments. However, this trend is not driven by species identity but physiological responses. Our results also indicate that phytoplankton communities may be already well adapted to fluctuating environments and can adjust physiologically to temperature variability.
Introduction
Across systems and taxa many organisms are exposed to varying temperatures on a regular basis. Temperature variations could include gradual changes in the mean temperature, as well as deterministic or stochastic fluctuations (Moisan et al., 2002; Fujiwara and Takada, 2017). Such fluctuations can trigger functional responses at the organismal level (resource acquisition and allocation) and numerical responses (reproduction) at the level of populations (Chevin et al., 2010; Schaum et al., 2018; Bernhardt et al., 2020; Cabrerizo and Marañón, 2021). Because of the non-linearity of biological responses along the temperature gradient, the consequences of temperature fluctuations for organisms’ performances differ from those observed under constant conditions (i.e., Jensen’s inequality) (Jensen, 1906). Additionally, the realized performance of organisms in varying environments depends on their plasticity to respond to such changes (Kremer et al., 2018; Fey et al., 2021).
Acclimation as a specific case of phenotypic plasticity might hereby allow organisms to expand their thermal ranges (Berg and Ellers, 2010; Chevin et al., 2010; Fey et al., 2021) and stabilize population responses in varying environments (Miner et al., 2005; Chevin et al., 2010). Acclimation processes include e.g., altered resource allocation and can be reflected in plankton stoichiometry (Schaum et al., 2018). A divergence in acclimation speed (i.e., gradual plasticity) and phenotypic fitness effects, however, may lead to individual’s phenotypes persistently chasing after their environment, severely affecting performance (Kremer et al., 2018; Fey et al., 2021). Thus, the rate of the change and the time of exposure to less optimal temperatures are crucial mediating organisms’ performance in changing environments. A growing body of studies have shown that the duration of exposure to above-optimal temperatures can influence organisms’ performance and that the thermal range for performance can decrease when exposed to high temperatures for longer time-periods (Rezende et al., 2014; Kingsolver et al., 2015; Kingsolver and Woods, 2016; Kremer et al., 2018). These “time-dependent-effects” can have different impacts on organisms, ranging from positive effects like physiological recovery after a cold period (Colinet et al., 2018), to negative effects reducing survival and growth in ectotherms because of heat stress (Kingsolver and Woods, 2016; Pansch and Hiebenthal, 2019; Wang et al., 2019).
Variability of temperature can be divided into different components, including the magnitude (variance), the frequency, and autocorrelation (predictability of change) (Moisan et al., 2002; Fujiwara and Takada, 2017). Frequency influences not only the time of exposure to different temperatures but also the autocorrelation structure, thus color of noise. Here, autocorrelation structure refers to the relationship between consecutive observations over time and directly influences the predictability of environmental fluctuations across temporal scales, ranging from diurnal to seasonal and annual variation (Halley, 1996; Ripa and Lundberg, 1996; Massie et al., 2015). Indeed, the ability of a population or community to adapt to fluctuating conditions depends on the predictability of change (Ruokolainen et al., 2009; Duncan et al., 2013; Blasius et al., 2020): slower temperature fluctuations are more autocorrelated as a result of a lower rate of change over time and provide more time for acclimation (Koussoroplis et al., 2017; Kremer et al., 2018). Whereas, faster and less autocorrelated (thus less predictable) fluctuations are likely to create mismatches between environmental conditions and acclimation (i.e., gradual plasticity) (Kremer et al., 2018; Fey et al., 2021). Thus, fluctuation frequency is expected to be an important component of variability and, to disentangle its effect from changes in variance, it is essential to test them separately in conceptual experiments, before investigating their combined effect.
While recently the question how fluctuating temperatures influence ectotherm performance in terms of survival, reproduction, and growth has gained increasing attention (e.g., Bernhardt et al., 2018; Schaum et al., 2018; Zhang et al., 2019), only very few studies investigated the effect of fluctuation frequencies (Kremer et al., 2018; Pansch and Hiebenthal, 2019; Wang et al., 2019; Burton et al., 2020), none of them using a gradient design. For example, Kremer et al. (2018) showed that acclimation history as well as fluctuation frequency significantly affected a phytoplankton population and that population densities deviated from the predictions of a rapid acclimation model. Furthermore, both the cold and warm acclimated populations showed the lowest population density in the faster (6 h) fluctuation treatments due to the temporal overlap of plasticity and variability speed. Contrastingly, other studies on ectotherms found a detrimental effect of slower fluctuations with high autocorrelation. In a mytilid study, faster fluctuation frequency (1.5 days) helped to maintain organism’s performance whereas slower fluctuation frequency (4.5 days) led to severe reduction in growth rates (Pansch and Hiebenthal, 2019). Similarly, a study on a coccolithophore population found that faster fluctuation frequency (24 h) mitigated the heat stress effects of temperature fluctuations and resulted in lower biomass reduction than slower fluctuation frequency (48 h) (Wang et al., 2019). These contrasting results may be explained by the fact that none of this previous work focused on the frequency of temperature fluctuation as single factor, but instead emphasizes the scale-dependency of temperature fluctuations. Fluctuations can occur over various temporal scales and it is the organism’s metabolism (i.e., according to their life span and behavior) which defines how it experiences variability (Jackson et al., 2021). Such perception of changes might influence information transmitted to the next generations; a phenomenon defined as “ecological memory” (Jackson et al., 2021).
Marine phytoplankton have particularly short generation times and thus a short lifespan, which covers a similar timescale as their acclimation rates (Savage et al., 2004; Fey et al., 2021). Delays in plasticity in response to (diurnal) variability might therefore act “trans-generational” (Kremer et al., 2018; Rescan et al., 2020). When studying diverse communities, multiple mechanisms take effect, potentially mediating mismatches in realized species performance due to delays in plasticity and community related processes (e.g., complementarity in niche occupancy, competitive exclusion). Phytoplankton shows considerable differences among many traits such as a large range in cell sizes e that directly influences species-specific growth rates (Kerimoglu et al., 2012; Acevedo-Trejos et al., 2013, 2015), a high diversity in morphology (e.g., cell walls, motility), biochemistry (storage products, nutrient uptake mechanisms), and the ability to use the light spectrum differentially (Huisman and Weissing, 1995; Dickman et al., 2006; Kerimoglu et al., 2012). This allows complementary trait distribution and consequently multiple species’ co-existence (Hutchinson, 1961; Ebenhöh, 1988). Therefore, diverse communities are expected to buffer the effects of environmental variability on e.g., biomass production (Elmqvist et al., 2003; Bestion et al., 2021). Additionally, environmental variability can affect diversity by promoting species coexistence due to asynchrony in species-specific responses (Yachi and Loreau, 1999; Chesson, 2000; Loreau and Hector, 2001), or it may lead to species sorting, e.g., the replacement of less tolerant species by smaller, faster-growing taxa with high thermal breadth (Stuart-Smith et al., 2015; Hodapp et al., 2016; Smith et al., 2016; Rasconi et al., 2017; Chen et al., 2019; Bestion et al., 2021).
However, experimental studies investigating the effect of temperature fluctuation on a community level have been limited to single fluctuation scenarios in comparison with a constant regime (Burgmer and Hillebrand, 2011; Rasconi et al., 2017; Gerhard et al., 2019) or different fluctuation magnitudes (Bestion et al., 2021), lacking the consideration of different temperature fluctuation frequencies (over a continuous state-space). While Gerhard et al. (2019) found that reductions in phytoplankton community growth rate were not driven by species identity but a general physiological response to diurnal fluctuations, a few studies reported a change in species dominance as driving mechanism for alterations in phytoplankton community biomass when exposed to fluctuating temperatures in the time period of weeks (Burgmer and Hillebrand, 2011; Rasconi et al., 2017; Cabrerizo et al., 2021).
This raises the question of how phytoplankton communities are affected by alternate temperature fluctuations and whether there is a threshold in fluctuation frequencies after which mismatches in current environmental changes and physiological adjustments due to acclimation occur. Although there are multiple dimensions to temperature variability, this study focuses solely on the effects of different fluctuation frequencies on marine phytoplankton communities. We conducted a controlled indoor mesocosm experiment on a natural plankton community, including phytoplankton and microzooplankton from the North Sea and introduced temperatures that mimic natural conditions during summer (van Aken, 2008; Klein et al., 2019). Temperature treatments were chosen along a frequency gradient, fluctuating every 6, 12, 24, 36 or 48 h with the same amplitude of ±3°C, or remaining constant at 18°C. We chose temperature fluctuation frequencies with ecological relevance, which were faster (6, 12 h), slower (36, 48 h) or matching diurnal fluctuation frequency (24 h). During the experiment, we examined total plankton biomass, phytoplankton biomass and phytoplankton community composition, as well as micro-zooplankton biomass to test the following hypotheses:
H1: Along the fluctuation frequency gradient, phytoplankton performance (estimated as biomass over time) is higher in treatments with slower fluctuation frequency (slower than diurnal) providing more time for phenotypic plasticity (Koussoroplis et al., 2017; Kremer et al., 2018). Thus, a decrease in performance in fast fluctuation frequency treatments (faster than diurnal) is expected because of potential mismatches in variability speed and time required for acclimation (i.e., gradual plasticity) (Kremer et al., 2018; Fey et al., 2021).
H2: A natural and thus highly diverse phytoplankton community might buffer the temperature fluctuation effects on performance through species sorting e.g., toward more tolerant species with wide thermal tolerance (Zhang et al., 2016; Bestion et al., 2021; Cabrerizo et al., 2021). This results in moderate changes in performance among fluctuation frequencies but alterations in the community structure and thus phytoplankton species diversity. Species diversity is expected to decrease with increasing fluctuation frequency resulting in high compositional turnover in faster fluctuation frequency treatments compared to constant conditions (Burgmer and Hillebrand, 2011) and slower fluctuation frequency treatments. These changes in diversity will affect ecosystem functioning and therefore will be reflected in the resource use efficiency of the limiting nutrient, as an index of ecosystem function (Nijs and Impens, 2000; Hodapp et al., 2019).
Materials and Methods
Experimental Set-Up
The experiment was conducted in the indoor mesocosm facility of the Institute for Chemistry and Biology of the Marine Environment (ICBM), Wilhelmshaven. The so-called “Planktotrons” are 12 indoor-mesocosms of 600 L each, custom-tailored for plankton studies and made of stainless steel (Gall et al., 2017). To measure plankton community responses to temperature fluctuation frequency over a “continuous state space” (Koussoroplis et al., 2017), we chose an experimental gradient design (Figure 1). The fluctuation frequency gradient comprised one constant treatment at 18°C and five fluctuation treatments, which experienced the same mean temperature (of 18°C) as the constant but with 3°C fluctuation every 6, 12, 24, 36, and 48 h (Figure 1 and see Supplementary Figure 1 for the complete temperature time series). All treatments were replicated twice. Temperature fluctuated from 15 to 21°C in a sinus curve mimicking the North Sea’s natural temperature range during summer but introducing different frequencies (van Aken, 2008; Klein et al., 2019). While many studies used constant conditions as control to compare the experimental treatment to (e.g., Burgmer and Hillebrand, 2011; Zhang et al., 2016; Gerhard et al., 2019), here we included both, a constant treatment as well as a diurnal fluctuation frequency treatment, fluctuating from 15–21°C within 24 h and representing a more realistic control to the experiment (mimicking natural conditions during the experimental season).
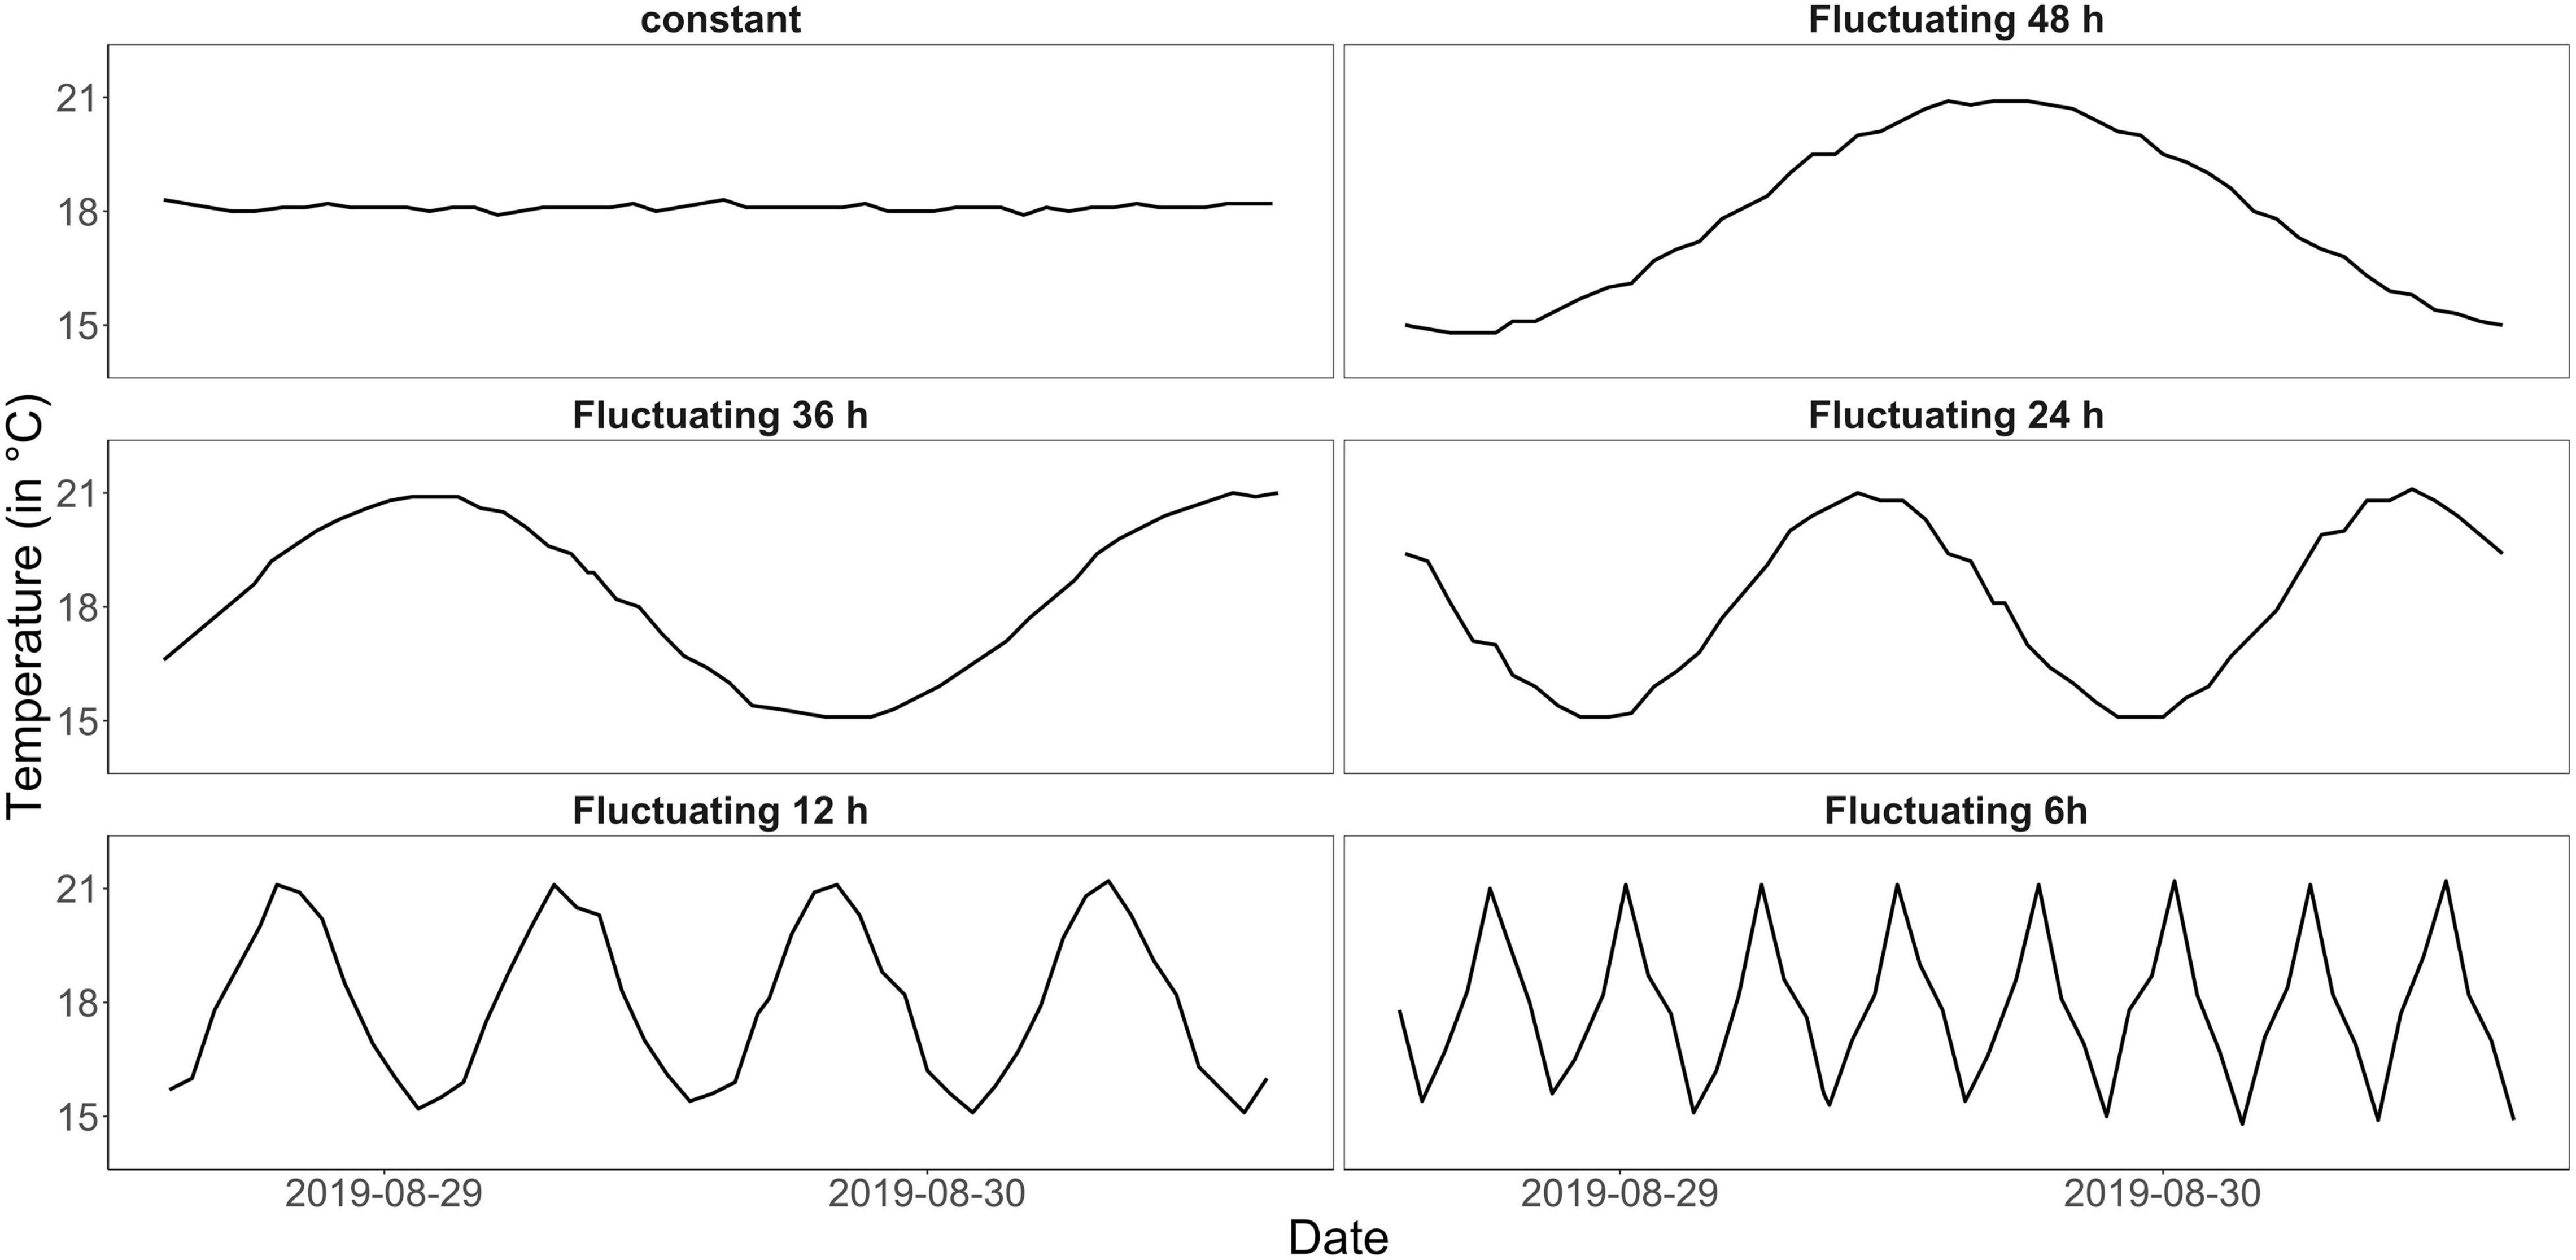
Figure 1. Measured temperature curves for the different treatments (constant control and fluctuation every 6, 12, 24, 36, and 48 h) within 50 h (data shown here for one replicate mesocosm each, from August 28 to August 30; see Supplementary Figure 1 for a complete temperature time series for each mesocosm). All treatments had the same mean temperature of 18°C and temperature fluctuations had the same amplitude of 3°C, thus were applied over the range of 15–21°C.
The experiment ran for 36 days and started with identical temperature conditions in all Planktotrons (at 18°C) on August 27, 2019. All Planktotrons were inoculated with the same initial plankton community, which was extracted 2 weeks before the experimental start in the German Bight, close to the University of Oldenburg Institute for Chemistry and Biology of the Marine Environment in Wilhelmshaven (53.514031, 8.156335). After extraction, the plankton community was kept in an outdoor basin under natural temperature and light regimes to allow sinking of suspended matter and thus preventing sediment load into the mesocosms. Before filling the mesocosms with 600 liters of the natural plankton community, meso-zooplankton was excluded by filtering through a mesh with 105 μm pore size to minimize grazing pressure on phytoplankton. Zooplankton abundances were counted regularly as a full removal of zooplankton due to its size overlap with larger phytoplankton taxa was not possible.
Light was supplied with an intensity of 119.8–131.3 μmol photons m–2 s–1 using LEDs with a near-natural light spectrum (IT2040 Evergrow with custom-specific LED composition, see Gall et al., 2017) in a 12:12 day:night cycle. Nutrients were supplied continuously to compensate sinking and grazing losses in phytoplankton to maintain constant nutrient availability over the experimental period and, by this reduce potential interactive effects between temperature and nutrients. We added 10% of the start nutrient concentration (NO3– 68.6 μg/L, PO3– 10.13 μg/L, Si2+ 324.25 μg/L measured on August 21, 2019 in the North Sea) daily at every hour using electric “1-channel dosing” pumps (Grotech) and starting at day three after the lag-phase of phytoplankton growth. Stratification of the water column was avoided by increasing the temperature 1–2°C at the bottom of the mesocosms compared to the surface, creating convection in the water column, and keeping homogenous distribution of species and temperature. Additionally, all Planktotrons were mixed using a full electric rotating paddle (Gall et al., 2017) once every hour for 3 min at intermediate intensity (changing the direction of the rotation). Temperature was continuously monitored by PT100 temperature sensors (Gall et al., 2017) in the Planktotrons (Supplementary Figure 1).
Sampling and Analysis
Samples to measure phytoplankton and zooplankton biomass and composition as well as dissolved and particulate nutrients were taken every 4th day (starting at day 0 and making a total of 10 samplings). In each sampling, a 6 L integrated water sample across the water column was taken using a tube. Samples were transferred to polyethylene bottles and processed immediately in the laboratory. Phytoplankton and zooplankton samples for microscopic counts were fixed with Lugol’s iodine (1% final concentration) and counted using an inverted microscope (Zeiss, Axiovert 10) at 400× magnification (Utermöhl, 1958). Samples for total particulate organic carbon, nitrogen, and phosphorus analysis were filtered onto pre-combusted and acid-washed glass fiber filters (GFC, Whatman) and stored at −80°C in the dark until analysis. Particulate organic phosphorous (POP) was measured using molybdate reaction after sulfuric acid digestion as described in Grasshoff et al. (1999), and particulate organic carbon (POC) and nitrogen (PON) analysis was conducted using a CHN analyzer (Thermo, Flash EA 1112). Particulate silicate (PSi) samples were filtered onto 0.45 μm membrane filters (NC45) and stored in the dark at −80°C before processing samples according to Grasshoff et al. (1999). Dissolved nutrients (PO43–, NO3–) were determined by a continuous-flow analyzer (Euro EA 3000, HEKAtech GmbH, Wegberg).
Particulate organic carbon measurements were used as an estimation of total plankton biomass (including phytoplankton and zooplankton). For estimating zooplankton and biomass, 6 L water were filtered through a 105 μm mesh and the sample split in equal shares for microscopic abundance determination and CN concentration determination. Phytoplankton biomass was determined by correcting total plankton biomass for zooplankton POC. Molar ratios were calculated using particulate concentrations of C, N, P, and Si. Thus, the stoichiometry of the plankton community was examined using total particulate nutrients, of which zooplankton amounts 6.5% and therefore reflects mainly phytoplankton stoichiometry. To determine if our system was nutrient limited, we calculated the N:P ratio of the dissolved and thus usable fraction of nutrients in the system (Supplementary Figure 3). Resource use efficiency (RUE) for the plankton community was calculated as total unit biomass formed (as standing POC) per unit total resource (sum of dissolved and particulate nutrients) for nitrogen and phosphorus (Nijs and Impens, 2000; Ptacnik et al., 2008). RUE of the limiting resource (nitrogen) was used as a proxy for ecosystem functioning (Nijs and Impens, 2000; Hodapp et al., 2019).
Data Analysis
All analyses were performed in R version 4.0.3 (R Core Team, 2020) using the packages tidyverse (Wickham et al., 2019), vegan (Oksanen et al., 2019), cowplot (Wilke, 2019), mgcv (Wood, 2011), lme4 (Bates et al., 2015) and lubridate (Grolemund and Wickham, 2011). We analyzed the effect of temperature fluctuation frequency on total plankton, phytoplankton, and zooplankton biomass, as well as phytoplankton diversity, and resource use efficiency of the limiting resource (RUE of nitrogen). To ensure equidistant intervals within the fluctuation frequency gradient, we calculated the fluctuation frequency within 48 h for each treatment. Mixed models were performed including time (experimental day) and fluctuation frequency (within 48 h) as continuous independent variables. The mesocosm ID was introduced as a random component in the models. This allowed us to take the non-independence of the data into account (repeated measures over time) and include potential idiosyncratic effects of experimental units (mesocosms). To account for the non-linear response of phytoplankton biomass, total plankton biomass and RUE of nitrogen over time (Figure 2), we used generalized additive mixed models (GAMM) within the mgcv package. A thin plate spline smoother (penalized likelihood approach) was included for time and fluctuation frequency was analyzed as linear predictor (n = 120). Only for time a smoother function was included because smoothing the fluctuation frequency resulted in a linear relationship. Introducing only one smoother, we chose a gam model without interaction. Zooplankton biomass did not correlate with phytoplankton biomass (spearman correlation, R = 0.09; p = 0.31; Supplementary Figure 2) and was therefore not included as predictor in the phytoplankton model.
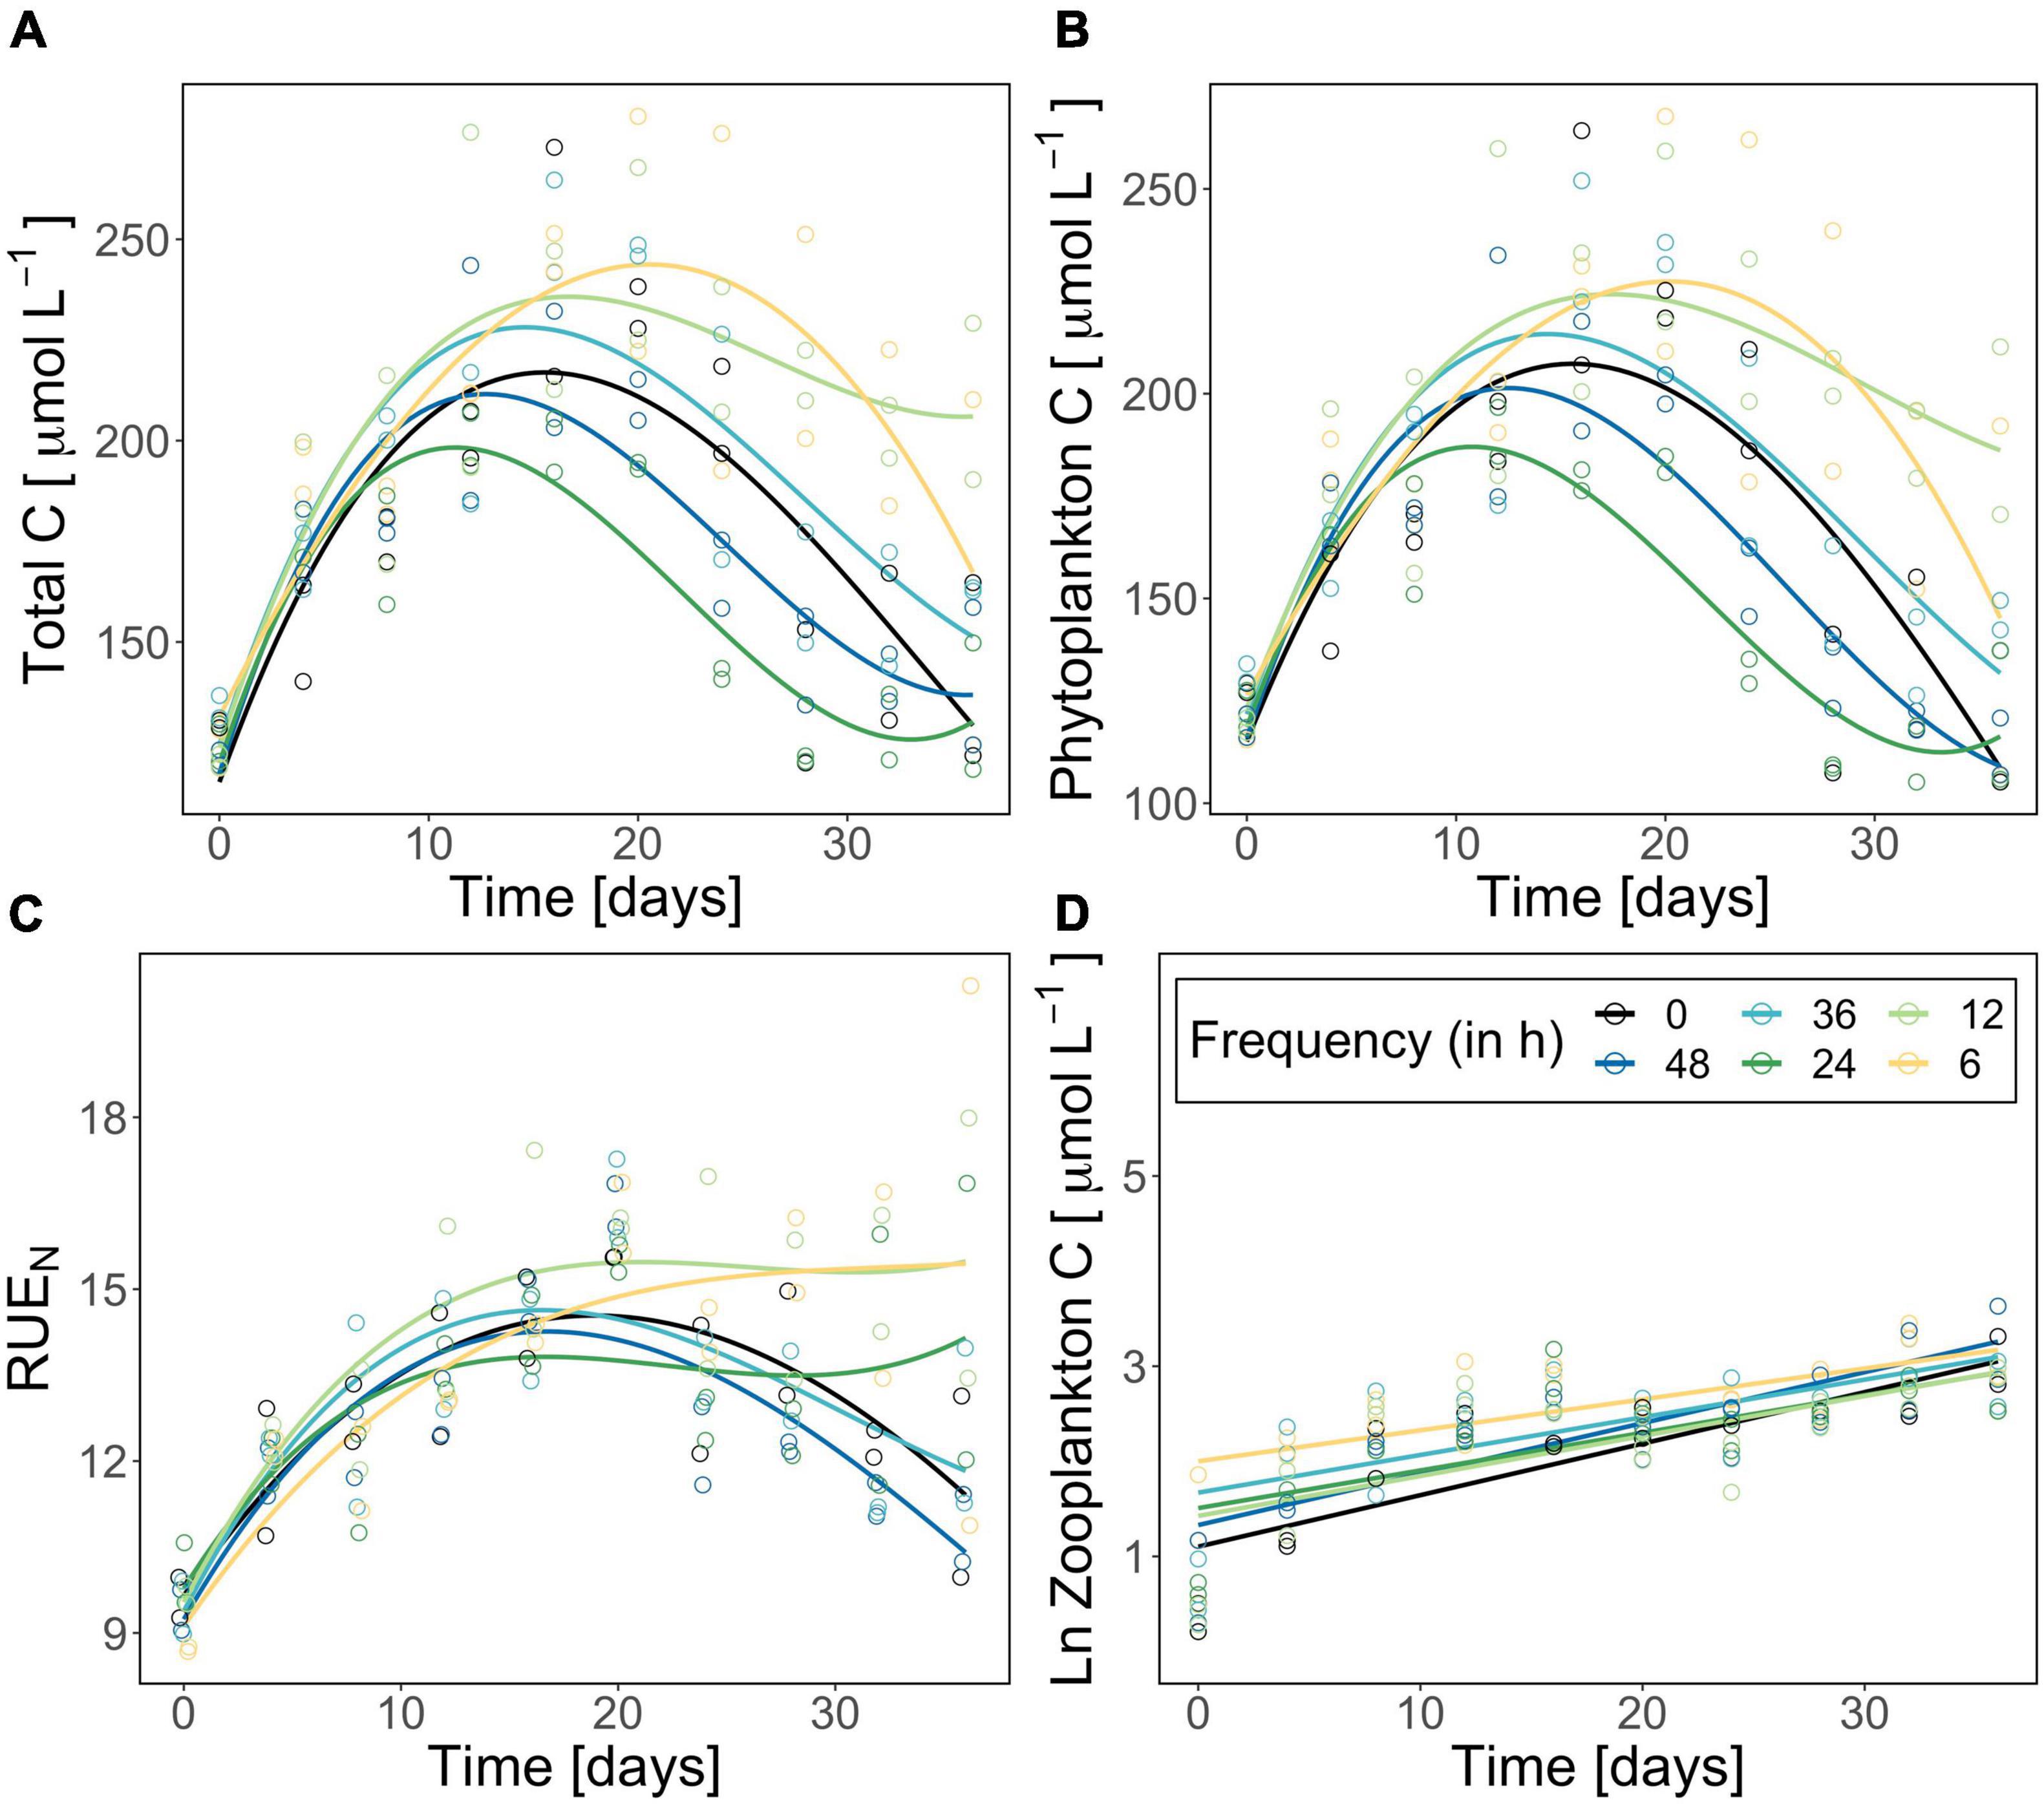
Figure 2. Total plankton biomass (carbon in μmol/L) (A), corrected phytoplankton biomass (carbon in μmol/L) (B), resource use efficiency of nitrogen (C), and ln-transformed zooplankton biomass (carbon in μmol/L) (D) during the experiment. The constant treatment is in black, fluctuation treatments are highlighted following a color gradient (dark blue fluctuation every 48 h—yellow fluctuation every 6 h). Each point represents one replicate (n = 2). Please note the different y-scales for panels (A–C). Curves/lines are loess-fits added to visualize the trend over time.
To test for fluctuation frequency effects on phytoplankton diversity and zooplankton biomass (as POC), we used linear mixed models (LMMs) within the lme4 package. Richness, inverse Simpson diversity, and compositional turnover were used as diversity indices for phytoplankton community. Compositional turnover was examined by calculating the Bray-Curtis distance of phytoplankton community composition (vegdist, vegan Package) for each treatment over time compared with the starting point. For phytoplankton diversity five samplings were included (n = 60) while for zooplankton biomass data of the 10 samplings were available (n = 120). Species diversity (richness and inverse Simpson) and zooplankton biomass were ln-transformed to get linear relations and meet requirements for LMM analysis (see Tables 1, 2). Differences in community composition (based on species relative abundance) among fluctuation frequency treatments and time were examined by performing an Analysis of Similarity (ANOSIM) using the Bray-Curtis index with 999 permutations. The SIMPER test was used as a post hoc test to identify the species explaining differences among treatments.
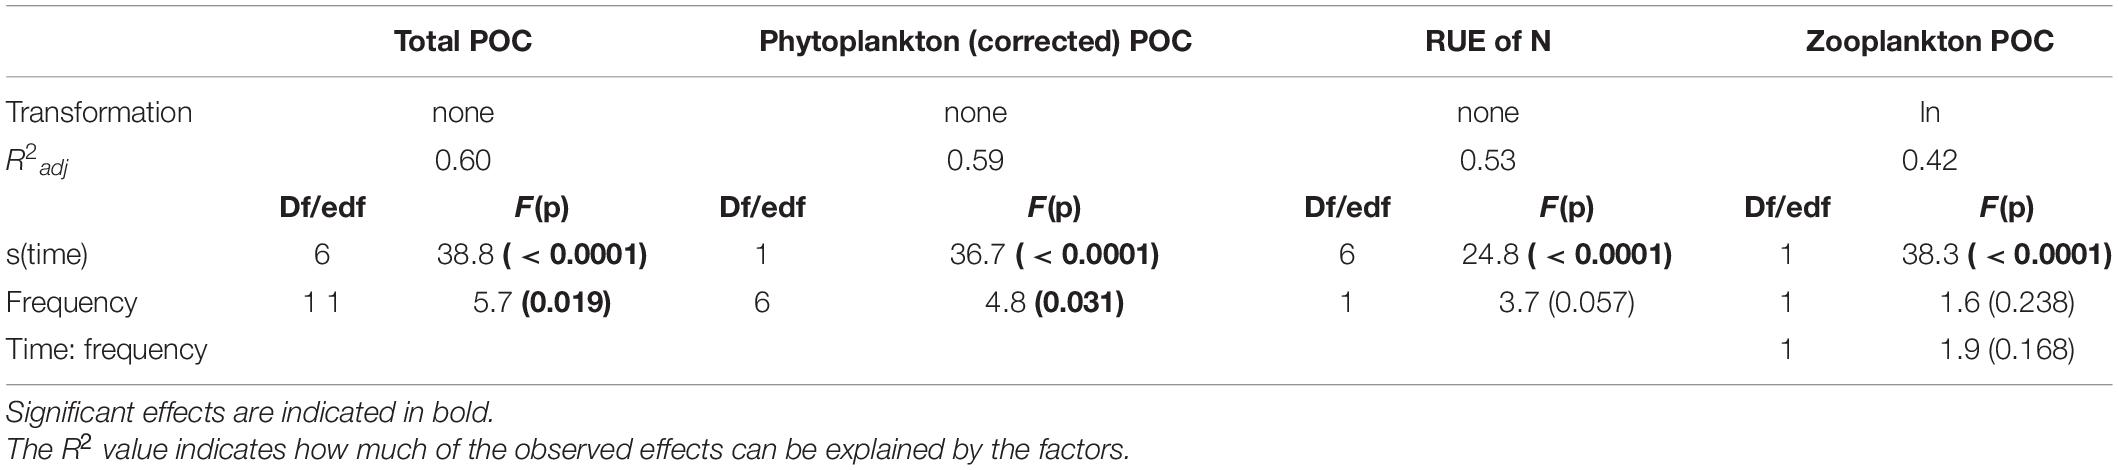
Table 1. Results of the statistical analysis for total Particulate Organic Carbon (POC), phytoplankton POC (total POC corrected for zooplankton carbon as a proxy for phytoplankton biomass), and resource use efficiency of nitrogen (RUE of N) using GAMMs, and zooplankton particulate organic carbon (POC, biomass proxy) using a linear mixed model.
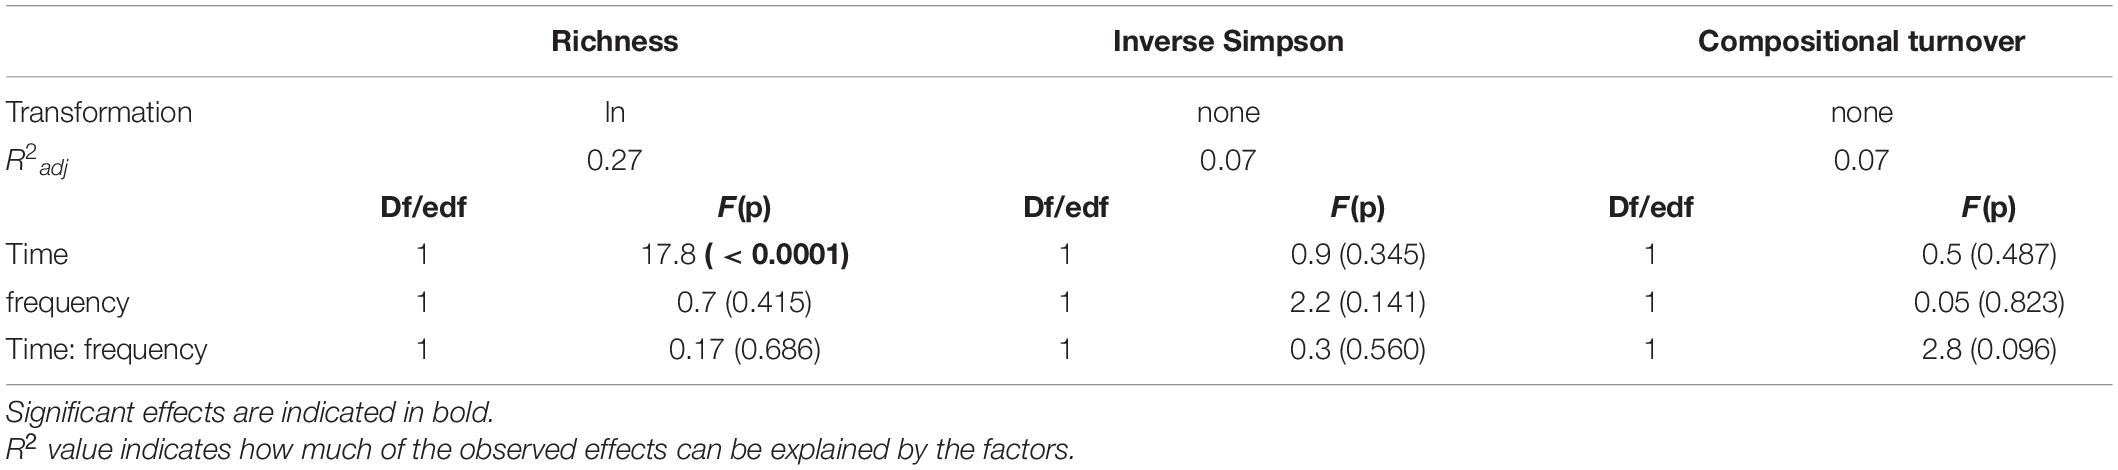
Table 2. Results of the linear mixed models (LMMs) for phytoplankton compositional structure (species richness, inverse Simpson diversity index, compositional turnover).
Results
Temperature Fluctuation Frequency Effects on Plankton Biomass, Stoichiometry and Resource Use Efficiency
Total plankton and phytoplankton biomass significantly changed over time and as an effect of the fluctuation frequency treatment (significant time effect, significant treatment effect; Table 1). Total plankton POC (as proxy for plankton biomass) followed a hump-shaped pattern over time, increasing during the first 10–20 days and decreasing afterward. Zooplankton biomass increased significantly over time but did not differ among treatments (Figure 2; significant time effect and no effect of frequency, Table 2). Phytoplankton biomass followed the same pattern as total plankton biomass since zooplankton represented only 6.5% of total plankton biomass (Figure 2), indicating that total plankton reflected the phytoplankton patterns. Fluctuation frequency increased (phyto-)plankton biomass, with faster fluctuations showing the highest concentrations (Figure 2 and Table 1). However, the biomass response was not strictly ordered by the fluctuation frequency and thus, the effect of fluctuation frequency on (phyto-)plankton biomass was only moderate. The fast fluctuation frequency treatments (6, 12 h) resulted in higher biomass than both, the constant treatment and the diurnal fluctuation treatment. In the slow fluctuation frequency treatments (36, 48 h) the biomass was either comparable to the constant treatment or slightly lower. The diurnal fluctuation frequency treatment (24 h) showed the lowest biomass (Figures 2A,B).
N:P ratios of dissolved nutrients ranged from 1 to 10 (Supplementary Figure 3) indicating that our experimental system was nitrogen limited (Koerselman and Meuleman, 1996). RUE of nitrogen changed significantly over time but did not differ significantly among treatments (significant time effect, Table 1). Besides the diurnal fluctuation treatment, RUE of nitrogen (Figure 2D) showed similar patterns as the carbon data for total (phyto-)plankton biomass. Molar N:P ratios of particulate nutrients nearly reflected the Redfield ratio (∼16:1) and were comparable in all treatments (Supplementary Figure 3). C:Si ratios decreased over time (Supplementary Figure 4). Molar C:N ratios followed the same pattern as RUE of nitrogen (Figure 2D and Supplementary Figure 5), while RUE of phosphorus reflected C:P ratios (Supplementary Figures 3, 5). RUE of nitrogen and C:N ratios in the diurnal fluctuation frequency treatment were higher than or comparable with the slower fluctuation treatments (36h and 48h), and constant conditions over time (Figure 3 and Supplementary Figure 5).
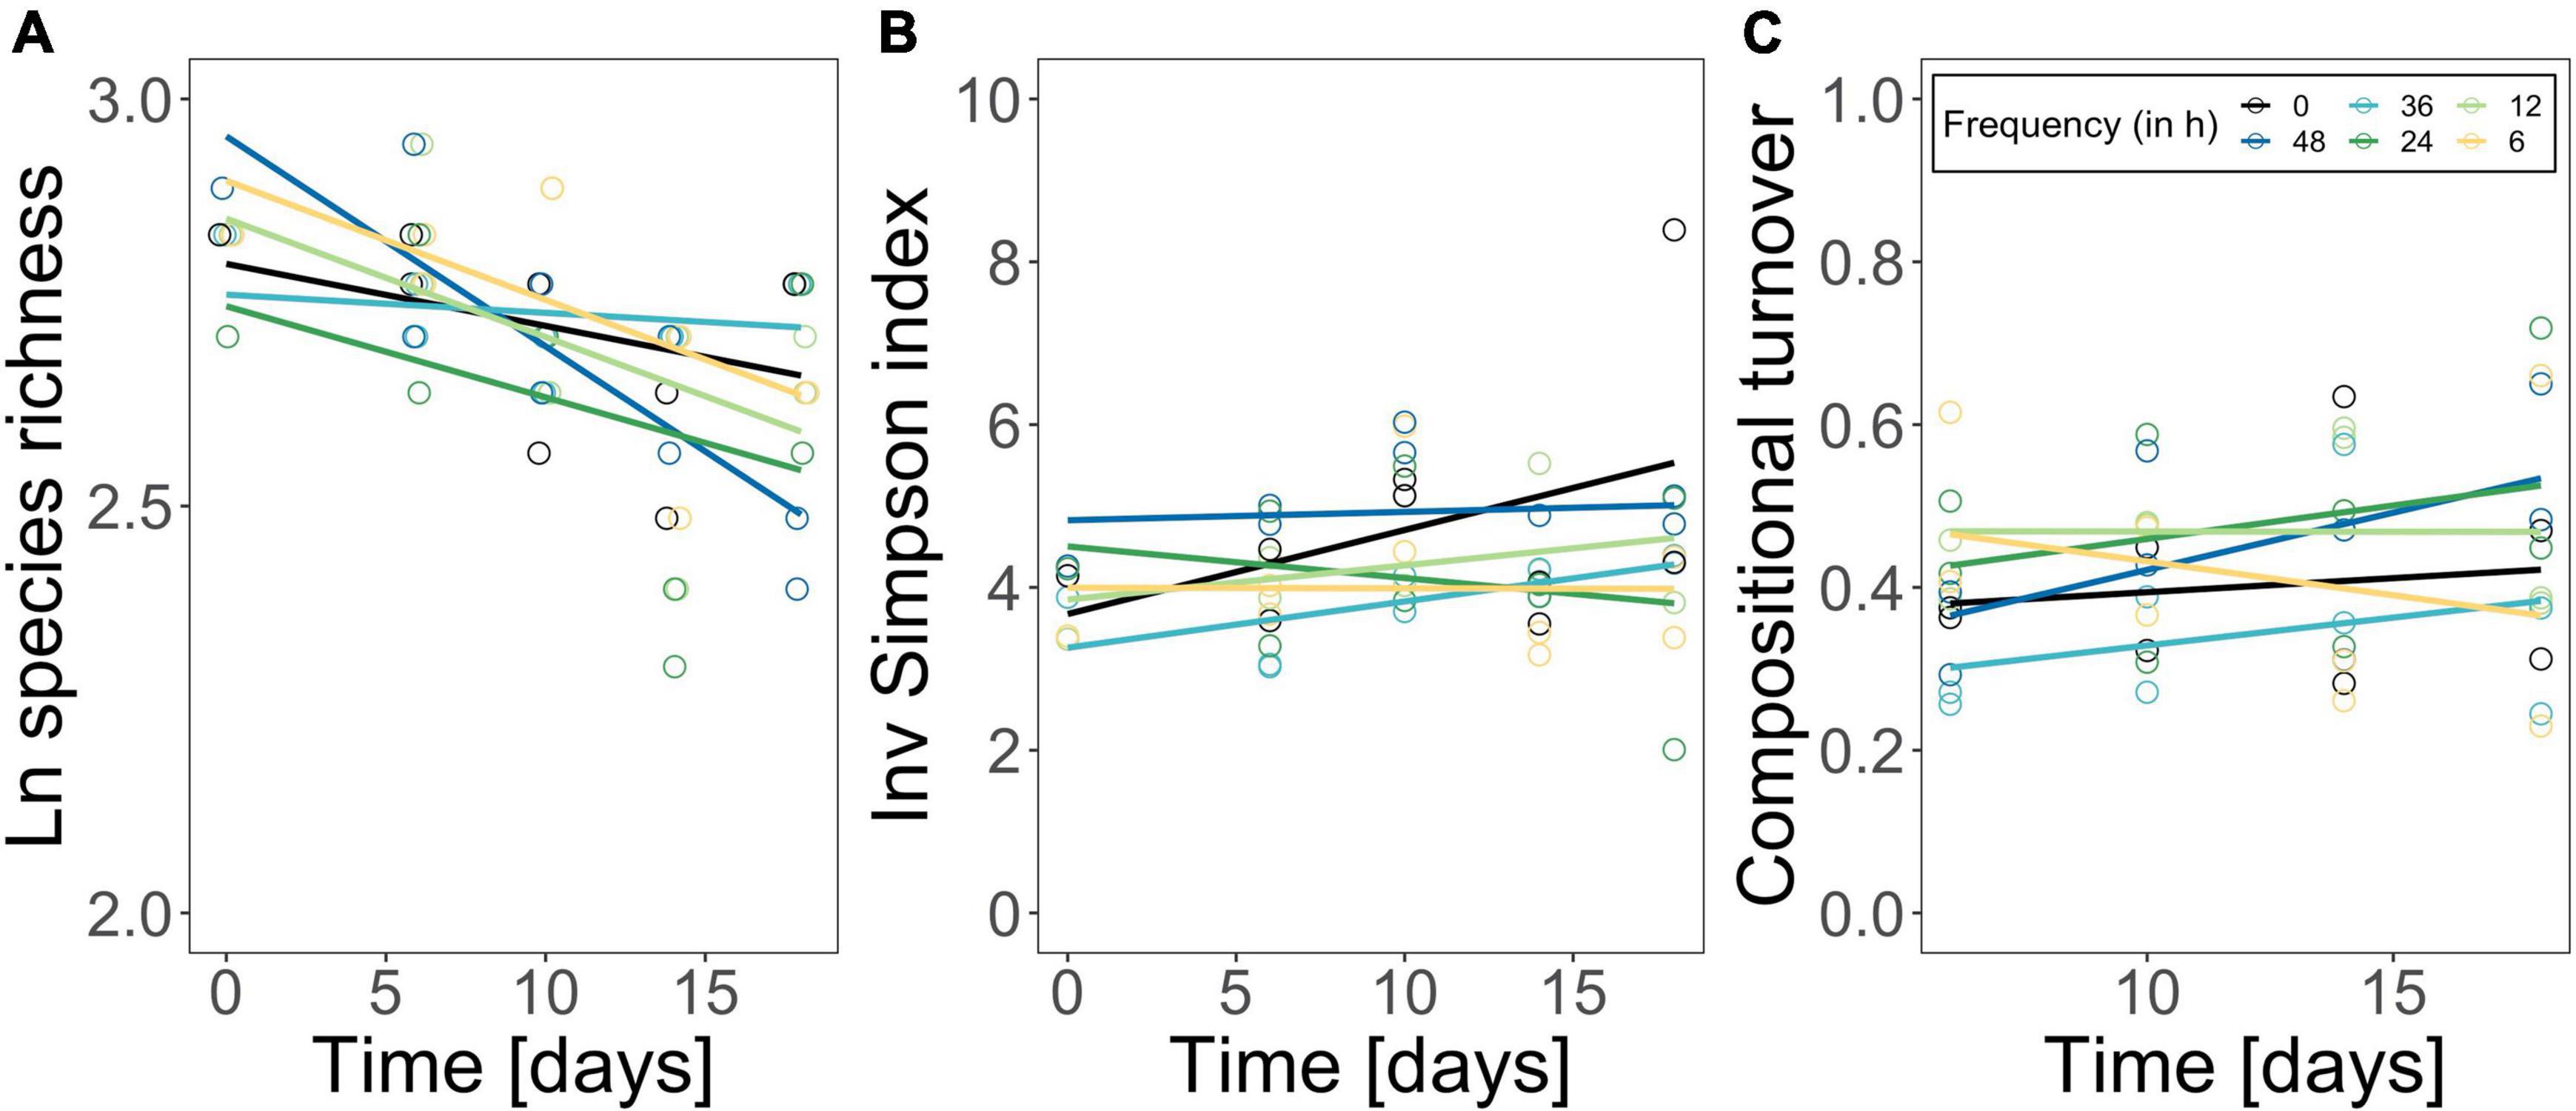
Figure 3. Logarithmized species richness (A), inverse Simpson diversity index (B) and compositional turnover (Bray-Curtis distance of phytoplankton community) (C) over time. The constant treatment is in black, fluctuation treatments are highlighted following a color gradient (dark blue fluctuation every 48 h—yellow fluctuation every 6 h). Each point represents one replicate (n = 2). Lines represent linear loess-fits added to visualize the trend over time.
Temperature Fluctuation Frequency Effects on Phytoplankton Community Structure
The phytoplankton community structure was determined as species richness, inverse Simpson index, turnover over time, and species composition. Species richness decreased over time from 17 species on average to 13 species on average, but independently of the fluctuation frequency treatments (Figure 3A; time effect, Table 2). Inverse Simpson index did not change significantly between treatments (Figure 3B and Table 2) but remained similar over time, suggesting that community evenness was maintained throughout the experiment. Compositional turnover did not change as an effect of treatments or over time (Figure 3C and Table 2) indicating that there was no change in dominating taxonomic groups due to species sorting. In addition, the performed ANOSIM showed no significant treatment effect, but a significant effect of time (R = 0.35; p = 0.001) on phytoplankton species composition. However, the dissimilarity was low, indicating that the differences over time in relative species abundance were small. Variations in Cryptomonas species’ abundance explained > 72.6 % of the differences between the initial composition and the end composition in all treatments. Although, Cryptomonas species abundance increased in all treatments (Supplementary Figure 6A), diatoms were the dominant taxonomic group in the phytoplankton community composition at the beginning and at the end of the experiment in all treatments (Supplementary Figure 6B). Most dominant zooplankton groups were calanoid and cyclopoid copepods, and ciliates.
Discussion
To predict how marine phytoplankton communities are affected by variability is one of the major challenges in marine ecology to-date (van de Waal and Litchman, 2020; Cabrerizo and Marañón, 2021). Here, we focused on the single effect of temperature fluctuations on phytoplankton performance and showed that it differed among fluctuation frequencies, even if the amplitude and mean temperature was maintained. Contrary to our expectations in H1 we found that performance increased with increasing fluctuation frequency: fast fluctuations (6, 12 h) showed greater performance, as measured by standing phytoplankton biomass, slow fluctuation frequencies (36, 48 h) had either comparable or slightly lower performance compared to the constant treatment. Whereas the diurnal fluctuation frequency (24 h) had the lowest performance compared to other treatments. Molar N:P ratios as a measure for phytoplankton stoichiometry were comparable in all treatments (rejecting H1). Contrary to our expectations in H2, we found that while species richness changed over time, it did not do so in response to the fluctuation treatments. Simpson diversity index and compositional turnover did not change according to treatments nor over time. Similarity in community structure (diversity and composition) was not supported by similar RUE across experimental treatments. Based on our results, we conclude that changes in standing biomass were driven by physiological responses, not compositional changes in phytoplankton communities.
Exploring H1: Fluctuation Frequency Effects on Phytoplankton Performance (Standing Biomass and Stoichiometry)
The results contradicted our expectations that biomass production is favored by slower temperature fluctuation frequencies and thus the autocorrelation of fluctuations. Instead, standing biomass and resource use efficiency of nitrogen (RUE) (Figure 2) was generally higher in faster fluctuation frequency treatments (6, 12 h) and lower in both, diurnal (24 h) and slower (36, 48 h) fluctuation frequency treatments. Our results indicate that effects of temperature fluctuation frequency are dependent on how organisms “average their environments” (Koussoroplis et al., 2017). Encountering suitable temperatures for growth more often might lead to an increase in realized phytoplankton biomass in faster fluctuation frequency treatments (6, 12 h), suggesting that the environment is perceived as if organisms were in more suitable conditions for a longer cumulative period of time (Koussoroplis et al., 2017). Consequently, organisms spend longer consecutive periods of time in less suitable temperatures when experiencing slower fluctuation frequencies (Feder and Hofmann, 1999; Colinet et al., 2018). These time-dependent effects are particularly relevant in studies on ectothermic populations because the environment has a direct influence on their metabolism (Kingsolver et al., 2015; Colinet et al., 2018; Pansch and Hiebenthal, 2019; Wang et al., 2019). Performance and survival might decrease with increasing duration of exposure to stressful temperatures (Niehaus et al., 2012; Rezende et al., 2014; Kingsolver et al., 2015; Koussoroplis et al., 2017), whereas a brief exposure to suboptimal temperatures may allow for higher subsequent thermal tolerance and survival e.g., due to the expression of heat shock proteins (Feder and Hofmann, 1999; Kingsolver and Woods, 2016). In our experiment, we did not cover stressful temperature ranges but used naturally occurring amplitudes for fluctuation frequency treatments (van Aken, 2008; Klein et al., 2019), suggesting that thermal stress played only a minor role. However, the duration of exposure can influence performance even for temperatures, which are far from extremes (Rezende et al., 2014). We suggest that in our experiment fluctuations with a diurnal frequency or slower (24, 36, 48 h), act to suppress growth due to longer periods in less favorable temperatures compared with faster fluctuation frequencies. Similar to our results, in a mytilid study, organisms could compensate for the exposure to low temperatures if fluctuation frequency was faster, while slower fluctuation frequency led to severe reduction in growth rates (Pansch and Hiebenthal, 2019). In a coccolithophore population slower fluctuation frequencies of 4.5 days significantly reduced performance compared with faster fluctuation frequencies of 1.5 days due to a downregulation of photosynthetic activities during cold phases (Wang et al., 2019).
Reducing the time for plasticity seemed to increase biomass production in our experiment. Plasticity is usually considered to appear during individuals lifespan, thus within one generation (Kremer et al., 2018). Phytoplankton communities, however, cover a large size gradient allowing for differences in growth rates, temperature, and nutrient prevalence (Kerimoglu et al., 2012; Acevedo-Trejos et al., 2013, 2015). One consequence of the broad range of physiological properties is the diversity of responses in physiological adjustments (i.e., phenotypic plasticity). Although we used a diverse natural phytoplankton community with a large size range here, we can assume that phytoplankton generation time is ∼1 day (Savage et al., 2004), meaning that in our experimental setup phytoplankton experienced fluctuations that acted within one generation (6, 12 h fluctuations) as well as across generations (36, 48 h fluctuations). How variability is experienced by the previous and current generation is an important aspect of phenotypic plasticity shaping the interaction between “within- and transgenerational plasticity” (Fox et al., 2019). Temperature fluctuations might therefore mediate ecological memory of phytoplankton communities (Rescan et al., 2020; Jackson et al., 2021). Considering that phytoplankton’s lifespan is on a similar timescale as their acclimation rates (Savage et al., 2004; Fey et al., 2021), slower fluctuations may allow for epigenetic plasticity (parental transmission) which affects the performance of the next generation that possess parental environmental information but perform in a novel environment (Guillaume et al., 2016; Kremer et al., 2018; Schaum et al., 2018). This effect may generate a mismatch of acclimated phenotypes and the new current environment, exacerbating the effect of temperature variability (Guillaume et al., 2016) and resulting in lower realized (community) performance (Hanson and Skinner, 2016; Kremer et al., 2018; Fey et al., 2021). Acclimation processes can alter fitness over several generations in the new conditions due to a cost-intensive chase to adjust to the environment suppressing biomass production (Anning et al., 2001; Kremer et al., 2018). For example, Bestion et al. (2021) described substantial effects on phytoplankton performance under large fluctuations when including higher fluctuation amplitudes.
Alterations in (phyto-)plankton community biomass can often be related to changes in resource allocation of the system due to plasticity in responses to changing temperatures (i.e., physiological traits) (Miner et al., 2005; Toseland et al., 2013; De Senerpont Domis et al., 2014). This can be reflected in the community stoichiometry (i.e., molar ratios). Here, N:P ratios nearly reflected the Redfield ratio (∼16) and were comparable among treatments (Supplementary Figure 5), suggesting no changes in resource allocation. In addition, carbon:nutrient ratios followed the biomass trends, while dissolved nutrients were low in all treatments (Supplementary Figure 5) indicating high nutrient conversion into biomass. We conclude that potential differences in resource allocation were limited due to low nutrient availability (Supplementary Figure 5), which reflected natural nutrient concentrations in the North Sea.
Moreover, it is important to note that neither biomass nor resource use efficiency of nitrogen were strictly ordered by the fluctuation frequency gradient. Interestingly, the lowest biomass was detected for the 24 h frequency treatment which correspond to the diurnal fluctuations experienced by the community before the experiment. However, this trend was not reflected in the resource use efficiency of the diurnal fluctuation frequency treatment (Figure 2). Our results suggest that there might be other processes involved in how communities adjust to variability in natural systems (i.e., physiological plasticity). When comparing thermal fluctuations with constant conditions in our experiment (Figure 2), the differences in biomass support the idea that deviations of expected patterns (i.e., Jensens inequality) (Jensen, 1906) might be detected when considering different frequencies of change (Koussoroplis et al., 2017). Lacking gradient designs and often choosing scenario-based set-ups in ecology, predictions on how scales of environmental change and organisms’ generation time may interact are limited. Organisms perceive environmental change at distinct scales according to their generation times, triggering various responses (Jackson et al., 2021). Although we were not able to elaborate on the evolutionary processes in plankton communities here, our results emphasize the importance of testing the different dimensions of variability in single experiments to unravel underlying mechanisms.
Exploring H2: Fluctuation Frequency Effects on Phytoplankton Community Structure and Resource Use Efficiency
Phytoplankton community structure was not significantly affected by temperature fluctuation frequency (Figure 3): species richness decreased in all treatments over the experimental period, likely due to the closed mesocosm set-up preventing species gain by immigration (Hillebrand et al., 2010). Compositional turnover over time was comparable among treatments (Figure 3) suggesting no major shifts in phytoplankton community composition driven by the fluctuation frequency gradient (Supplementary Figure 6). This was supported by a lack of differences in the species composition among treatments, but diatoms remained the dominant taxonomic group throughout the experiment (Supplementary Figure 6). Also, we did not observe a shift in species dominance toward one species with high thermal tolerance, as was reported in other studies (e.g., Zhang et al., 2016; Rasconi et al., 2017; Bestion et al., 2021; Cabrerizo and Marañón, 2021), but diversity (estimated by the inverse Simpson index) was maintained over the experimental period (Figure 3). In fact, environmental variability might facilitate species coexistence (Flöder and Sommer, 1999; Loreau and Hector, 2001; Descamps-Julien and Gonzalez, 2005) maintaining high species diversity with the capacity to compensate environmental fluctuations (Elmqvist et al., 2003; Bestion et al., 2021). Additionally, phytoplankton have a large range of complementary traits, therefore species with e.g., a smaller thermal breath are not necessarily outcompeted by their superior competitors if they are able to e.g., use nutrients more efficiently (i.e., niche partitioning) (Hutchinson, 1961; Ebenhöh, 1988). The similarity in community structure (diversity and composition) was also reflected in the resource use efficiency of nitrogen (Figures 2, 3): RUE changed over time but treatment effects were only marginal (Table 1). Instead, the resource use efficiency of nitrogen as limiting resource (RUE), a proxy for ecosystem functioning (Nijs and Impens, 2000; Hodapp et al., 2019), was genuinely high (Figure 2D). Also, RUE of nitrogen and phosphorus followed the same pattern as molar C:N and C:P ratios (Figure 2D and Supplementary Figures 3, 5), respectively, due to a continuous but low nutrient supply in our experiment, which accelerated the incorporation of available nutrients into biomass (Supplementary Figure 5). Consequently, effects on compositional structure and general ecosystem functioning were marginal. We conclude that alterations in RUE and differences in standing biomass among the fluctuation frequency treatments did not arise from shifts in compositional structure in our experiment, but that physiological mechanism may have driven the community’s responses (Berg and Ellers, 2010; De Senerpont Domis et al., 2014; Gerhard et al., 2019; Barton et al., 2020; Cabrerizo et al., 2021).
In summary, we found differences in biomass along a fluctuation frequency gradient and over time, however, these were not reflected in phytoplankton community structure or resource use efficiency and stoichiometry. Instead, our results suggest that natural marine phytoplankton communities and thus phenotypes of phytoplankton individuals are well adapted to frequencies with naturally relevant amplitudes and might acclimate relatively fast. Trends in biomass might arise from how species average their environment and due to transgenerational effects. However, in our experiment the thermal range of fluctuations might be too small to see substantial effects on performance as were found when including higher fluctuation amplitudes (Kremer et al., 2018; Bestion et al., 2021). In theory, variability effects are expected to be small if species can acclimate fast or fitness benefits of acclimated phenotypes are minor (Fey et al., 2021). However, we did not choose a scenario-based approach for our experiment but aimed to elaborate on the importance of fluctuation frequency impacts. Although, climate change is not expected to alter deterministic variability such as seasonal, diurnal or annual fluctuation, stochastic fluctuations may increase not only in intensity, but also amplitude and frequency, affecting directly the autocorrelation of change and therefore triggering different responses in marine phytoplankton (Ruokolainen et al., 2009; Duncan et al., 2013; Blasius et al., 2020). With proceeding climate change, nutrient limitation will constrain phytoplankton production and ultimately alter the ability to acclimate to variability in phytoplankton (e.g., physiological adjustments due to plasticity) (van de Waal and Litchman, 2020). Also, other abiotic stressors such as pCO2 and physical processes such as current, mixing and a higher species turnover may amplify the effect of variability.
Conclusion
Our study shows that the frequency of temperature fluctuations can significantly alter phytoplankton biomass production. Although, we detected differences in standing biomass among faster fluctuation frequency and slower fluctuation frequency treatments, we did not observe a clear threshold in our frequency gradient after which mismatches in fluctuation frequency and plasticity occur. Furthermore, only minor changes in composition and diversity could be observed, which were reflected in resource use efficiency of nitrogen, indicating that ecosystem functioning could be maintained. We conclude that not compositional shifts, but physiological mechanisms may drive community’s responses. Our results suggest that natural marine phytoplankton communities may be more resilient to moderate temperature fluctuations than expected and can quickly adjust to fluctuating environments (Berg and Ellers, 2010; Gerhard et al., 2019). With on-going climate change, however, the unpredictability of temperature change will increase in terms of frequency, intensity, and amplitude, likely constituting a new challenge with the need for high thermal breath and fast plasticity in marine phytoplankton.
Data Availability Statement
The original contributions presented in the study are included in the article/Supplementary Material, further inquiries can be directed to the corresponding author/s.
Author Contributions
MSc, MSt, and CK designed the experiment. CK, NF, MJ, and MSt conducted the experiments with assistance of MSc. CK and MG conducted the analyses. CK wrote the first draft of the manuscript with the help of MSt and MG and all authors contributed to revisions.
Funding
MSt acknowledges funding by the Deutsche Forschungsgemeinschaft DFG (STR 1383/8-1), MG was supported by the Uruguayan Agency of Investigation and Innovation (ANII: POS_EXT_2015_1_122989), the German Academic Exchange Service (DAAD: 91645020), and H2020 EU-funded project AQUACOSM-Plus (no.: 871081). The establishment of the infrastructure was financed by the Lower Saxony Ministry for Science and Culture (MWK) and the Institute for Chemistry and Biology of the Marine Environment.
Conflict of Interest
The authors declare that the research was conducted in the absence of any commercial or financial relationships that could be construed as a potential conflict of interest.
Publisher’s Note
All claims expressed in this article are solely those of the authors and do not necessarily represent those of their affiliated organizations, or those of the publisher, the editors and the reviewers. Any product that may be evaluated in this article, or claim that may be made by its manufacturer, is not guaranteed or endorsed by the publisher.
Acknowledgments
We would like to thank Heike Rickels for technical assistance and nutrient measurements, Clara Zeller for help in collecting parts of the data, Dorothee Hodapp for statistical advice and Lutz ter Hell for invaluable technical support. We would also like to thank the Marine Community Ecology class 2019 for support during the experiment and sampling.
Supplementary Material
The Supplementary Material for this article can be found online at: https://www.frontiersin.org/articles/10.3389/fmars.2021.812902/full#supplementary-material
References
Acevedo-Trejos, E., Brandt, G., Bruggeman, J., and Merico, A. (2015). Mechanisms shaping size structure and functional diversity of phytoplankton communities in the ocean. Sci. Rep. 5:8918. doi: 10.1038/srep08918
Acevedo-Trejos, E., Brandt, G., Merico, A., and Smith, S. L. (2013). Biogeographical patterns of phytoplankton community size structure in the oceans. Glob. Ecol. Biogeogr. 22, 1060–1070. doi: 10.1111/geb.12071
Anning, T., Harris, G., and Geider, R. (2001). Thermal acclimation in the marine diatom chaetoceros calcitrans (Bacillariophyceae). Eur. J. Phycol. 36, 233–241. doi: 10.1080/09670260110001735388
Barton, S., Jenkins, J., Buckling, A., Schaum, C. E., Smirnoff, N., Raven, J. A., et al. (2020). Evolutionary temperature compensation of carbon fixation in marine phytoplankton. Ecol. Lett. 23, 722–733. doi: 10.1111/ele.13469
Bates, D., Maechler, M., Bolker, B., and Walker, S. (2015). Fitting linear mixed-effects models using lme4. J. Stat. Softw. 67, 1–48. doi: 10.18637/jss.v067.i01
Berg, M. P., and Ellers, J. (2010). Trait plasticity in species interactions: a driving force of community dynamics. Evol. Ecol. 24, 617–629. doi: 10.1007/s10682-009-9347-8
Bernhardt, J. R., O’Connor, M. I., Sunday, J. M., and Gonzalez, A. (2020). Life in fluctuating environments: adaptation to changing environments. Philos. Trans. R. Soc. B Biol. Sci. 375:20190454.
Bernhardt, J. R., Sunday, J. M., Thompson, P. L., Connor, M. I. O., and Bernhardt, J. R. (2018). Nonlinear averaging of thermal experience predicts population growth rates in a thermally variable environment. Proc. R. Soc. B 285:20181076. doi: 10.1098/rspb.2018.1076
Bestion, E., Haegeman, B., Alvarez Codesal, S., Garreau, A., Huet, M., Barton, S., et al. (2021). Phytoplankton biodiversity is more important for ecosystem functioning in highly variable thermal environments. Proc. Natl. Acad. Sci. U.S.A. 118:e2019591118. doi: 10.1073/pnas.2019591118
Blasius, B., Rudolf, L., Weithoff, G., Gaedke, U., and Fussmann, G. F. (2020). Long-term cyclic persistence in an experimental predator–prey system. Nature 577, 226–230. doi: 10.1038/s41586-019-1857-0
Burgmer, T., and Hillebrand, H. (2011). Temperature mean and variance alter phytoplankton biomass and biodiversity in a long-term microcosm experiment. Oikos 120, 922–933. doi: 10.1111/j.1600-0706.2010.19301.x
Burton, T., Lakka, H. K., and Einum, S. (2020). Measuring phenotypes in fluctuating environments. Funct. Ecol. 34, 606–615. doi: 10.1111/1365-2435.13501
Cabrerizo, M. J., and Marañón, E. (2021). Temperature fluctuations in a warmer environment: impacts on microbial plankton. Fac. Rev. 10:9. doi: 10.12703/r/10-9
Cabrerizo, M. J., Marañón, E., Fernández-González, C., Alonso-Núñez, A., Larsson, H., and Aranguren-Gassis, M. (2021). Temperature fluctuation attenuates the effects of warming in estuarine microbial plankton communities. Front. Mar. Sci. 8:656282. doi: 10.3389/fmars.2021.656282
Chen, B., Smith, S. L., and Wirtz, K. W. (2019). Effect of phytoplankton size diversity on primary productivity in the North Pacific: trait distributions under environmental variability. Ecol. Lett. 22, 56–66. doi: 10.1111/ele.13167
Chesson, P. (2000). Mechanisms of maintenance of species diversity. Annu. Rev. Ecol. Syst. 31, 343–366. doi: 10.1146/annurev.ecolsys.31.1.343
Chevin, L. M., Lande, R., and Mace, G. M. (2010). Adaptation, plasticity, and extinction in a changing environment: towards a predictive theory. PLoS Biol. 8:e1000357. doi: 10.1371/journal.pbio.1000357
Colinet, H., Rinehart, J. P., Yocum, G. D., and Greenlee, K. J. (2018). Mechanisms underpinning the beneficial effects of fluctuating thermal regimes in insect cold tolerance. J. Exp. Biol. 221:jeb164806. doi: 10.1242/jeb.164806
De Senerpont Domis, L. N., Van De Waal, D. B., Helmsing, N. R., Van Donk, E., and Mooij, W. M. (2014). Community stoichiometry in a changing world: combined effects of warming and eutrophication on phytoplankton dynamics. Ecology 95, 1485–1495. doi: 10.1890/13-1251.1
Descamps-Julien, B., and Gonzalez, A. (2005). Stable coexistence in a fluctuating environment: an experimental demonstration. Ecology 86, 2815–2824.
Dickman, E. M., Vanni, M. J., and Horgan, M. J. (2006). Interactive effects of light and nutrients on phytoplankton stoichiometry. Oecologia 149, 676–689. doi: 10.1007/s00442-006-0473-5
Duncan, A. B., Gonzalez, A., and Kaltz, O. (2013). Stochastic environmental fluctuations drive epidemiology in experimental host-parasite metapopulations. Proc. R. Soc. B Biol. Sci. 280:20131747. doi: 10.1098/rspb.2013.1747
Ebenhöh, W. (1988). Coexistence of an unlimited number of algal species in a model system. Theor. Popul. Biol. 34, 130–144. doi: 10.1016/0040-5809(88)90038-x
Elmqvist, T., Folke, C., Nyström, M., Peterson, G., Bengtsson, J., Walker, B., et al. (2003). Response diversity, ecosystem change, and resilience. Front. Ecol. Environ. 1:488–494. doi: 10.1890/1540-9295(2003)001[0488:rdecar]2.0.co;2
Feder, M. E., and Hofmann, G. E. (1999). Heat-shock proteins, molecular chaperones, and the stress response: evolutionary and ecological physiology. Annu. Rev. Physiol. 61, 243–282. doi: 10.1146/annurev.physiol.61.1.243
Fey, S. B., Kremer, C. T., Layden, T. J., and Vasseur, D. A. (2021). Resolving the consequences of gradual phenotypic plasticity for populations in variable environments. Ecol. Monogr. 91:e01478.
Flöder, S., and Sommer, U. (1999). Diversity in planktonic communities: an experimental test of the intermediate disturbance hypothesis. Limnol. Oceanogr. 44, 1114–1119. doi: 10.4319/lo.1999.44.4.1114
Fox, R. J., Donelson, J. M., Schunter, C., Ravasi, T., and Gaitán-Espitia, J. D. (2019). Beyond buying time: the role of plasticity in phenotypic adaptation to rapid environmental change. Philos. Trans. R. Soc. B: Biol. Sci. 374.
Fujiwara, M., and Takada, T. (2017). Environmental Stochasticity. eLS. Atlanta: American Cancer Society, 1–8.
Gall, A., Uebel, U., Ebensen, U., Hillebrand, H., Meier, S., Singer, G., et al. (2017). Planktotrons: a novel indoor mesocosm facility for aquatic biodiversity and food web research. Limnol. Oceanogr. Methods 15, 663–677. doi: 10.1002/lom3.10196
Gerhard, M., Koussoroplis, A. M., Hillebrand, H., and Striebel, M. (2019). Phytoplankton community responses to temperature fluctuations under different nutrient concentrations and stoichiometry. Ecology 100:e02834. doi: 10.1002/ecy.2834
Grasshoff, K., Kremling, K., and Ehrhardt, M. (1999). Methods of Seawater Analysis, 3rd Edn. Wiley: Hoboken.
Grolemund, G., and Wickham, H. (2011). Dates and times made easy with lubridate. J. Stat. Softw. 40, 1–25.
Guillaume, A. S., Monro, K., and Marshall, D. J. (2016). Transgenerational plasticity and environmental stress: do paternal effects act as a conduit or a buffer? Funct. Ecol. 30, 1175–1184. doi: 10.1111/1365-2435.12604
Halley, J. M. (1996). Ecology, evolution and 1/f-noise. Trends Ecol. Evol. 11, 33–37. doi: 10.1016/0169-5347(96)81067-6
Hanson, M. A., and Skinner, M. K. (2016). Developmental origins of epigenetic transgenerational inheritance. Environ. Epigenet. 2, 1–9. doi: 10.1093/eep/dvw002
Hillebrand, H., Soininen, J., and Snoeijs, P. (2010). Warming leads to higher species turnover in a coastal ecosystem. Glob. Chang. Biol. 16, 1181–1193. doi: 10.1111/j.1365-2486.2009.02045.x
Hodapp, D., Hillebrand, H., and Striebel, M. (2019). “Unifying” the concept of resource use efficiency in ecology. Front. Ecol. Evol. 6, 1–14. doi: 10.3389/fevo.2018.00233
Hodapp, D., Hillebrand, H., Blasius, B., and Ryabov, A. B. (2016). Environmental and trait variability constrain community structure and the biodiversity-productivity relationship. Ecology 97, 1463–1474. doi: 10.1890/15-0730.1
Huisman, J., and Weissing, F. J. (1995). Competition for nutrients and light in a mixed water column: a theoretical analysis. Am. Nat. 146, 536–564. doi: 10.1086/285814
Hutchinson, G. E. (1961). The paradox of the plankton. Paradox Plankton XCV 51–62. doi: 10.1017/cbo9781139095075.008
Jackson, M. C., Pawar, S., and Woodward, G. (2021). The temporal dynamics of multiple stressor effects: from individuals to ecosystems. Trends Ecol. Evol. 36, 402–410. doi: 10.1016/j.tree.2021.01.005
Jensen, J. L. W. V. (1906). Sur les fonctions convexes et les inégalités entre les valeurs moyennes. Acta Math. 30, 175–193. doi: 10.1007/bf02418571
Kerimoglu, O., Straile, D., and Peeters, F. (2012). Role of phytoplankton cell size on the competition for nutrients and light in completely mixed systems. J. Theor. Biol. 300, 330–343. doi: 10.1016/j.jtbi.2012.01.044
Kingsolver, J. G., Higgins, J. K., and Augustine, K. E. (2015). Fluctuating temperatures and ectotherm growth: distinguishing non-linear and time-dependent effects. J. Exp. Biol. 218, 2218–2225. doi: 10.1242/jeb.120733
Kingsolver, J. G., and Woods, H. A. (2016). Beyond thermal performance curves: modeling time-dependent effects of thermal stress on ectotherm growth rates. Am. Nat. 187, 283–294. doi: 10.1086/684786
Klein, H., Latarius, K., and Köllner, M. (2019). 3.5.3 Temperaturschichtung und Wärmeinhalt 2018 & 2019. BSH Reports. Hamburg: Bundesamt für Seeschifffahrt und Hydrographie.
Koerselman, W., and Meuleman, A. F. M. (1996). The vegetation N : P ratio : a new tool to detect the nature of nutrient limitation. J. Appl. Ecol. 33, 1441–1450. doi: 10.2307/2404783
Koussoroplis, A. M., Pincebourde, S., and Wacker, A. (2017). Understanding and predicting physiological performance of organisms in fluctuating and multifactorial environments. Ecol. Monogr. 87, 178–197.
Kremer, C. T., Fey, S. B., Arellano, A. A., and Vasseur, D. A. (2018). Gradual plasticity alters population dynamics in variable environments: thermal acclimation in the green alga Chlamydomonas reinhartdii. Proc. R. Soc. B Biol. Sci. 285:20171942. doi: 10.1098/rspb.2017.1942
Loreau, M., and Hector, A. (2001). Partitioning selection and complementarity in biodiversity experiments. Nature 412, 72–76. doi: 10.1038/35083573
Massie, T. M., Weithoff, G., Kuckländer, N., Gaedke, U., and Blasius, B. (2015). Enhanced Moran effect by spatial variation in environmental autocorrelation. Nat. Commun. 6:5993. doi: 10.1038/ncomms6993
Miner, B. G., Sultan, S. E., Morgan, S. G., Padilla, D. K., and Relyea, R. A. (2005). Ecological consequences of phenotypic plasticity. Trends Ecol. Evol. 20, 685–692.
Moisan, J. R., Moisan, T. A., and Abbott, M. R. (2002). Modelling the effect of temperature on the maximum growth rates of phytoplankton populations. Ecol. Modell. 153, 197–215. doi: 10.1016/s0304-3800(02)00008-x
Niehaus, A. C., Angilletta, M. J., Sears, M. W., Franklin, C. E., and Wilson, R. S. (2012). Predicting the physiological performance of ectotherms in fluctuating thermal environments. J. Exp. Biol. 215, 694–701. doi: 10.1242/jeb.058032
Nijs, I., and Impens, I. (2000). Underlying effects of resource use efficiency in diversity-productivity relationships. Oikos 91, 204–208. doi: 10.1034/j.1600-0706.2000.910120.x
Oksanen, J., Blanchet, F. G., Friendly, M., Kindt, R., Legendre, P., McGlinn, D., et al. (2019). vegan: Community Ecology Package. R package version 2.5-6. Available online at: https://CRAN.R-project.org/package=vegan.
Pansch, C., and Hiebenthal, C. (2019). A new mesocosm system to study the effects of environmental variability on marine species and communities. Limnol. Oceanogr. Methods 17, 145–162. doi: 10.1002/lom3.10306
Ptacnik, R., Solimini, A. G., Andersen, T., Tamminen, T., Brettum, P., Lepistö, L., et al. (2008). Diversity predicts stability and resource use efficiency in natural phytoplankton communities. Proc. Natl. Acad. Sci. U.S.A. 105, 5134–5138. doi: 10.1073/pnas.0708328105
Rasconi, S., Winter, K., and Kainz, M. J. (2017). Temperature increase and fluctuation induce phytoplankton biodiversity loss – evidence from a multi-seasonal mesocosm experiment. Ecol. Evol. 7, 2936–2946. doi: 10.1002/ece3.2889
R Core Team (2020). R: A Language and Environment for Statistical Computing. Vienna: R Foundation for Statistical Computing. Available online at: https://www.R-project.org/
Rescan, M., Grulois, D., Ortega-Aboud, E., and Chevin, L. M. (2020). Phenotypic memory drives population growth and extinction risk in a noisy environment. Nat. Ecol. Evol. 4, 193–201. doi: 10.1038/s41559-019-1089-6
Rezende, E. L., Castañeda, L. E., and Santos, M. (2014). Tolerance landscapes in thermal ecology. Funct. Ecol. 28, 799–809. doi: 10.1111/1365-2435.12268
Ripa, J., and Lundberg, P. (1996). Noise colour and the risk of population extinctions. Proc. R. Soc. B Biol. Sci. 263, 1751–1753. doi: 10.1098/rspb.1996.0256
Ruokolainen, L., Lindén, A., Kaitala, V., and Fowler, M. S. (2009). Ecological and evolutionary dynamics under coloured environmental variation. Trends Ecol. Evol. 24, 555–563. doi: 10.1016/j.tree.2009.04.009
Savage, V. M., Gillooly, J. F., Brown, J. H., West, G. B., and Charnov, E. L. (2004). Effects of body size and temperature on population growth. Am. Nat. 163, 429–441. doi: 10.1086/381872
Schaum, C. E., Buckling, A., Smirnoff, N., Studholme, D. J., and Yvon-Durocher, G. (2018). Environmental fluctuations accelerate molecular evolution of thermal tolerance in a marine diatom. Nat. Commun. 9:1719.
Smith, S. L., Vallina, S. M., and Merico, A. (2016). Phytoplankton size-diversity mediates an emergent trade-off in ecosystem functioning for rare versus frequent disturbances. Sci. Rep. 6:34170. doi: 10.1038/srep34170
Stuart-Smith, R. D., Edgar, G. J., Barrett, N. S., Kininmonth, S. J., and Bates, A. E. (2015). Thermal biases and vulnerability to warming in the world’s marine fauna. Nature 528, 88–92. doi: 10.1038/nature16144
Toseland, A., Daines, S. J., Clark, J. R., Kirkham, A., Strauss, J., Uhlig, C., et al. (2013). The impact of temperature on marine phytoplankton resource allocation and metabolism. Nat. Clim. Chang. 3, 979–984. doi: 10.1038/nclimate1989
Utermöhl, H. (1958). Zur vervollkommnung der quantitativen phytoplankton-methodik. Mitt Int. Ver Limnol. 9, 1–38. doi: 10.1080/05384680.1958.11904091
van Aken, H. M. (2008). Variability of the water temperature in the western Wadden Sea on tidal to centennial time scales. J. Sea Res. 60, 227–234. doi: 10.1016/j.seares.2008.09.001
van de Waal, D. B., and Litchman, E. (2020). Multiple global change stressor effects on phytoplankton nutrient acquisition in a future ocean. Philos. Trans. R. Soc. B Biol. Sci. 375, 1–8. doi: 10.1098/rstb.2019.0706
Wang, X., Fu, F., Qu, P., Kling, J. D., Jiang, H., Gao, Y., et al. (2019). How will the key marine calcifier Emiliania huxleyi respond to a warmer and more thermally variable ocean? Biogeosciences 16, 4393–4409. doi: 10.5194/bg-16-4393-2019
Wickham, H., Averick, M., Bryan, J., Chang, W., McGowan, L., François, R., et al. (2019). Welcome to the tidyverse. J. Open Source Softw. 4:1686. doi: 10.21105/joss.01686
Wilke, C. O. (2019). cowplot: Streamlined Plot Theme and Plot Annotations for ‘ggplot2’. R package version 1.0.0. Available online: https://CRAN.R-project.org/package=cowplot.
Wood, S. N. (2011). Fast stable restricted maximum likelihood and marginal likelihood estimation of semiparametric generalized linear models. J. R. Stat. Soc. B 73, 3–36. doi: 10.1111/j.1467-9868.2010.00749.x
Yachi, S., and Loreau, M. (1999). Biodiversity and ecosystem productivity in a fluctuating environment: the insurance hypothesis. Ecology 96, 1463–1468. doi: 10.1073/pnas.96.4.1463
Zhang, M., Guan, Y., Qin, B., and Wang, X. (2019). Responses of phytoplankton species to diel temperature fluctuation patterns. Phycol. Res. 67, 184–191. doi: 10.1111/pre.12369
Keywords: temperature fluctuation, frequency, variability, climate change, phytoplankton, stoichiometry, resource use efficiency, mesocosm experiment
Citation: Kunze C, Gerhard M, Jacob M, Franke NA, Schröder M and Striebel M (2022) Phytoplankton Community Performance Depends on the Frequency of Temperature Fluctuations. Front. Mar. Sci. 8:812902. doi: 10.3389/fmars.2021.812902
Received: 10 November 2021; Accepted: 30 December 2021;
Published: 31 January 2022.
Edited by:
Christopher Edward Cornwall, Victoria University of Wellington, New ZealandReviewed by:
Casey Michael Godwin, University of Michigan, United StatesEmily Mae Herstoff, St. Francis College, United States
Copyright © 2022 Kunze, Gerhard, Jacob, Franke, Schröder and Striebel. This is an open-access article distributed under the terms of the Creative Commons Attribution License (CC BY). The use, distribution or reproduction in other forums is permitted, provided the original author(s) and the copyright owner(s) are credited and that the original publication in this journal is cited, in accordance with accepted academic practice. No use, distribution or reproduction is permitted which does not comply with these terms.
*Correspondence: Charlotte Kunze, Charlotte.kunze@uni-oldenburg.de