A National Status Report on United States Coral Reefs Based on 2012–2018 Data From National Oceanic and Atmospheric Administration’s National Coral Reef Monitoring Program
 Erica K. Towle1*
  E. Caroline Donovan2
  Heath Kelsey2
  Mary E. Allen1 Hannah Barkley3 Jeremiah Blondeau4
  Russell E. Brainard5 Annie Carew2
  Courtney S. Couch6 Maria K. Dillard7
  C. Mark Eakin8 Kimberly Edwards9 Peter E. T. Edwards10
  Ian C. Enochs11 Chloe S. Fleming9 Alexandra S. Fries2
  Erick F. Geiger12 Laura Jay Grove13 Sarah H. Groves9 Matthew Gorstein14 Adel Heenan15
  Matthew W. Johnson13 Justine Kimball16 Jennifer L. Koss17 Tye Kindinger3
  Arielle Levine18
  Derek P. Manzello19 Nathan Miller2
  Thomas Oliver3
  Jennifer C. Samson3 Dione Swanson20
  Bernardo Vargas-Ángel6
  T. Shay Viehman21 Ivor D. Williams5
- 1Lynker, Inc. Under National Oceanic and Atmospheric Administration Coral Reef Conservation Program Contract, Leesburg, VA, United States
- 2University of Maryland Center for Environmental Science, Cambridge, MD, United States
- 3Pacific Islands Fisheries Science Center, National Marine Fisheries Service, National Oceanic and Atmospheric Administration, Honolulu, HI, United States
- 4Cooperative Institute for Marine and Atmospheric Studies Under National Oceanic and Atmospheric Administration Population and Ecosystems Monitoring Division Contract, University of the Virgin Islands, St. Thomas, VI, United States
- 5Red Sea Research Center, King Abdullah University of Science and Technology, Thuwal, Saudi Arabia
- 6Cooperative Institute for Marine and Atmospheric Research Under National Oceanic and Atmospheric Administration Ecosystem Sciences Division Contract, Honolulu, HI, United States
- 7National Institute of Standards and Technology, Gaithersburg, MD, United States
- 8Corals and Climate, Silver Spring, MD, United States
- 9CSS, Inc. Under National Oceanic and Atmospheric Administration National Centers for Coastal Ocean Science Contract, Fairfax, VA, United States
- 10Pew Charitable Trusts, Washington, DC, United States
- 11Atlantic Oceanographic and Meteorological Laboratory, Oceanic and Atmospheric Research, National Oceanic and Atmospheric Administration, Miami, FL, United States
- 12Earth System Science Interdisciplinary Center/Cooperative Institute for Satellite Earth System Studies Under National Oceanic and Atmospheric Administration NESDIS/STAR Contract, University of Maryland, College Park, MD, United States
- 13Southeast Fisheries Science Center, National Marine Fisheries Service, National Oceanic and Atmospheric Administration, Miami, FL, United States
- 14South Carolina Sea Grant Consortium, Charleston, SC, United States
- 15School of Ocean Sciences, Bangor University, Anglesey, United Kingdom
- 16California Ocean Protection Council, Sacramento, CA, United States
- 17Coral Reef Conservation Program, National Ocean Service, National Oceanic and Atmospheric Administration, Silver Spring, MD, United States
- 18Department of Geography, San Diego State University, San Diego, CA, United States
- 19Satellite Oceanography & Climate Division, Center for Satellite Applications and Research, Coral Reef Watch, National Oceanic and Atmospheric Administration, College Park, MD, United States
- 20Cooperative Institute for Marine and Atmospheric Studies, Rosenstiel School of Marine and Atmospheric Science, University of Miami, Miami, FL, United States
- 21National Centers for Coastal Ocean Science, National Ocean Service, National Oceanic and Atmospheric Administration, Beaufort, NC, United States
National Oceanic and Atmospheric Administration’s Coral Reef Conservation Program supports the National Coral Reef Monitoring Program (NCRMP) in the United States Pacific, Atlantic, Caribbean, and Gulf of Mexico. NCRMP conducts standardized observations of biological, climatic, and socioeconomic indicators across American Samoa, Guam, the Main Hawaiian Islands, the Northwestern Hawaiian Islands, the Northern Mariana Islands, the Pacific Remote Islands, Florida, the Flower Garden Banks, Puerto Rico, and the United States Virgin Islands. NCRMP provides periodic, national-level assessments of the status of United States coral reef ecosystems and communities connected to them. In 2014, NCRMP partnered with the University of Maryland Center for Environmental Science on an unprecedented collaboration between federal and jurisdictional/state agencies, academia, and non-governmental organizations to synthesize NCRMP data into a reporting format designed to be accessible and relevant to the public and policy makers. The process involved multi-year data analyses of key benthic, fish, and climate indicators. In populated jurisdictions, socioeconomic data were integrated to assess public support for management actions, participation in pro-environmental behaviors, and awareness of threats to coral reefs. Jurisdictions were scored using a report-card scale (0–100%) by establishing references for each indicator using best-available historical data or expert opinion where historical data did not exist or were not statistically comparable. Despite overall ecosystem scores of Fair for all combined Atlantic (70%) and Pacific (74%) jurisdictions, the current trend is downward with a majority of United States coral reefs declining and vulnerable to further degradation. Remote, uninhabited reefs had an advantage with respect to reef fish population scores, i.e., Flower Garden Banks (85%) and Pacific Remote Islands (93%), when compared to populated location scores, i.e., Puerto Rico (63%) and Main Hawaiian Islands (66%). All coral reefs are highly impacted by climate change, and climate impacts were more pronounced than expected on remote reefs, i.e., the Northwestern Hawaiian Islands (58%). Presenting results in a report-card style facilitates communication to the public and policy makers, and provides a useful mechanism to garner support for management actions such as expanding protected areas; enforcing existing regulations; increasing climate change education; reducing land-based sources of pollution; and other actions to improve the trajectory of coral reef ecosystem conditions.
Introduction
Long-term, comprehensive ecological monitoring programs track temporal and spatial changes in a given habitat or ecosystem. The National Oceanic and Atmospheric Administration (NOAA)’s National Coral Reef Monitoring Program (NCRMP) within the Coral Reef Conservation Program collects data on biological (benthic and fish), climatic, and socioeconomic indicators of coral reef ecosystems in U.S. states and territories (NOAA Coral Program, 2021). These states and territories span the United States Pacific Islands, Atlantic, Caribbean, and Gulf of Mexico, and include American Samoa, Guam, the Main Hawaiian Islands, the Northwestern Hawaiian Islands, the Northern Mariana Islands, the Pacific Remote Islands, Florida, the Flower Garden Banks, Puerto Rico, and the United States Virgin Islands. The goals of NCRMP are to (1) collect scientifically sound, geographically comprehensive biological, climate, and socioeconomic data in United States coral reef areas, (2) maintain consistent and comparable coral reef monitoring methods, (3) deliver high-quality data and data products to the coral reef resource management and conservation community, (4) provide context for interpreting results of local monitoring efforts, and (5) provide periodic assessments of the status and trends of the nation’s coral reef ecosystems.
Since its inception in 2010, NCRMP has largely focused on data collection, data quality assurance, and long-term archival of raw data that are open access. These data are a valuable scientific resource, having been broadly used by NOAA, other United States federal agencies, State and Territorial partners, and key stakeholders for a variety of purposes. These include national stock assessments (e.g., Nadon, 2017, 2019), endangered species reviews (e.g., Brainard et al., 2011), regional and multinational coral reef assessments (e.g., Brainard et al., 2008, 2012, 2019), and peer-reviewed papers geared toward the scientific community (e.g., Enochs et al., 2019; Allen et al., 2021; Couch et al., 2021). The data have also been used to produce technical documents and summary reports (e.g., Boyle et al., 2017; NOAA, 2018; McCoy et al., 2019) aimed at the coral reef management community and other coral reef stakeholder groups to inform resource management decision making, better tailor education and outreach programs at the jurisdiction level, and to evaluate the efficacy of existing programs aimed at reducing coral reef threats. Prior to the analyses presented in this paper, NCRMP data had not yet been used to directly support a more highly synthesized report card-style assessment of coral reef ecosystem status geared specifically toward helping policy makers and the general public understand the current condition of United States coral reefs. Due to the myriad of anthropogenic and natural threats facing coral reefs and the urgency with which conservation efforts are needed now and into the current decade, it has become increasingly clear that conservation cannot be achieved without an informed and engaged public and policy makers (Bennett and Dearden, 2014; Bennett et al., 2017).
In 2014, NCRMP began a collaboration with the University of Maryland Center for Environmental Science (UMCES) Integration and Application Network to synthesize NCRMP data into products using indicators designed to be accessible to the public and high-level policy makers, including the United States Congress. The packaging of data into indicators is a way of simplifying complex and detailed information, especially for the general public and policy makers (Hak et al., 2007). The use of indicators can be controversial due to the subjectivity involved in selecting variables combined to create composites, cut-off points between scores, reference values, and weights (Saltelli, 2007). While indicators are more likely to create controversy when used to drive policy or regulatory actions (Paruolo et al., 2013), they are a widely accepted metric for a variety of uses including tracking change over time and space and monitoring the impacts of management actions. The structure of NCRMP data collection facilitated the organization of indicators into four themes: benthic, fish, climate, and socioeconomic. The choice to aggregate indicators into major themes is key, as assessments that do not combine their indicators into a small set of themes can be extremely hard to interpret (Hak et al., 2007). When indicators are combined into themes, they provide a clearer picture of the entire system, reveal critical relationships between major components, and facilitate analysis of critical strengths and weaknesses of the system (Hak et al., 2007).
Status reports were created for each of the United States coral reef jurisdictions in the Atlantic, Pacific, Caribbean, and Gulf of Mexico, and a national status report was developed to contextualize all jurisdictional reports into one United States National summary report. The nine jurisdictional reports plus a national-level summary report were created to answer the question: “How are United States coral reefs doing?” This question was answered by analyzing NCRMP data for a selection of 15 indicators within four key themes: benthic, fish, climate, and human connections, where each indicator was scored based on comparing the most recent NCRMP data to the best available historical data as a reference or baseline, or in the absence of historical data, subject matter expert opinion. This paper describes the process for synthesizing extensive multidisciplinary NCRMP data from the only comprehensive monitoring program spanning all United States coral reefs. It integrates biophysical and social data into themed indicators. The authors present novel composite ecosystem scores of each United States coral reef jurisdiction for the period of data collection between 2012 and 2018 compared to the best available reference data from each jurisdiction, as well as a national summary to contextualize all the jurisdictions. This paper also discusses future work that could improve future coral reef ecosystem status reports at jurisdictional and national scales. While the focus of this effort was NCRMP data, many jurisdictions collect additional region-specific monitoring data. Where appropriate and feasible, these regional data were included as baseline or reference information; however, in many cases differences in data collection design and methodology (e.g., spatial, temporal, instrumental, and analytical) made it difficult to compare and aggregate between local program data and NCRMP data. This process highlights the ongoing need for the coral reef community to standardize and inter-calibrate methodologies to facilitate large-scale status reports.
Materials and Methods
National Coral Reef Monitoring Program collects biological (benthic and fish) and climate data in each Atlantic jurisdiction on a 2-to-3-year cycle, respectively, with biological surveying generally occurring in Florida and the Flower Garden Banks in even years and in Puerto Rico and the United States Virgin Islands in odd years (Supplementary Table 1). Due to the extreme remoteness of some of the Pacific islands, NCRMP collects biological and climate data in each Pacific jurisdiction on a 3-year cycle (Supplementary Table 1). All benthic and fish data are collected on hard-bottom reef areas between 0 and 30 m depth using a stratified random sampling design (NOAA Coral Program, 2021). Sea surface temperatures and heat stress metrics from NOAA’s Coral Reef Watch are produced daily from satellite remote sensing on a global scale encompassing all United States coral reef areas. Jurisdictional resident surveys collect socioeconomic data on an approximately 5-to-7-year cycle only in the seven inhabited jurisdictions (American Samoa, Florida, Guam, the Main Hawaiian Islands, the Northern Mariana Islands, Puerto Rico, and the United States Virgin Islands). At the time this assessment was produced, only 1 year of socioeconomic data was available for each of the seven inhabited jurisdictions from collections between 2014 and 2018. For detailed methodology on how all coral reef monitoring data are collected, refer to NOAA Coral Program (2021).
A consistent process was followed to develop each jurisdiction’s status report: (1) Create a conceptual framework that defines key aspects of the ecosystem and the major components of and threats to ecosystem health, (2) Identify available data, (3) Choose indicators that can be reliably quantified and communicated across jurisdictions, (4) Define reference values to serve as a historical baseline making sure that every baseline is statistically comparable to the current dataset intended for analysis, and (5) Calculate scores through statistical comparison to the most recent year’s data for each indicator, followed by aggregation of individual scores into an averaged theme score, and subsequent area-weighting of individual sub-regions (in this case, area of coral reef habitat < 30 m depth) for final aggregation to the composite jurisdictional score.
Approximately 30 NOAA scientists synthesized and analyzed the data; five UMCES scientists led workshops and meetings to bring the data streams together; and over 150 local experts from state government agencies, academia, and non-governmental organizations from all coral reef jurisdictions provided input into identifying the baselines by which to score each indicator.
The Indicators
Broadly, criteria for choosing indicators used in the status reports included historical and current data availability, methodological comparability over time, indicators known to be monitored into the future, reference points for statistical comparison, connection to management objectives, ease of understanding by broad audiences, and the ability to rank an indicator as positive or negative and have a clear desired direction for change. All indicators used in this assessment from the four NCRMP data themes (benthic, fish, climate, and socioeconomic) met these criteria. Within each theme, subject matter experts determined which indicators would be best for determining coral reef ecosystem status, using the bounds of all indicators measured by NCRMP and the criteria listed above. Consensus was determined via in-person workshops for each jurisdiction and monthly to quarterly follow-up virtual meetings as each jurisdiction’s data were analyzed. Smaller working groups for each data theme also met regularly to discuss how to analyze specific indicators. The complete NCRMP dataset includes more indicators than were selected for these status reports.
The Pacific jurisdictions were evaluated first, leading to some indicators that were specific to the Pacific. When the Atlantic reports were evaluated, some changes were made based on applicability to Atlantic reef systems (Donovan et al., 2018, 2020). Despite a desired NCRMP goal for fully standardized methodology across ocean basins, there remain some small differences in data collection and analyses. These differences between the basin scoring analytics pertained to some benthic and fish indicators (Table 1). For example, in the benthic theme, the Atlantic jurisdictions do not include juvenile coral density in their field surveys, and therefore this was not included in their report scoring. Additionally, the Atlantic jurisdictions up-weighted coral cover as its own indicator, rather than having it be part of the larger benthic cover indicator as in the Pacific, and also chose not to score herbivory due to data limitations (Table 1). In the fish theme, the Atlantic jurisdictions did not include sharks and other predators in their report scoring due to paucity of data on sharks. Additionally, the Atlantic jurisdictions included reef fish density (instead of biomass) and diversity was scored (as alpha diversity/richness). The climate indicators were consistent across all jurisdictions in both ocean basins. The human connection indicators were also consistent for all inhabited jurisdictions in both ocean basins (Table 1).
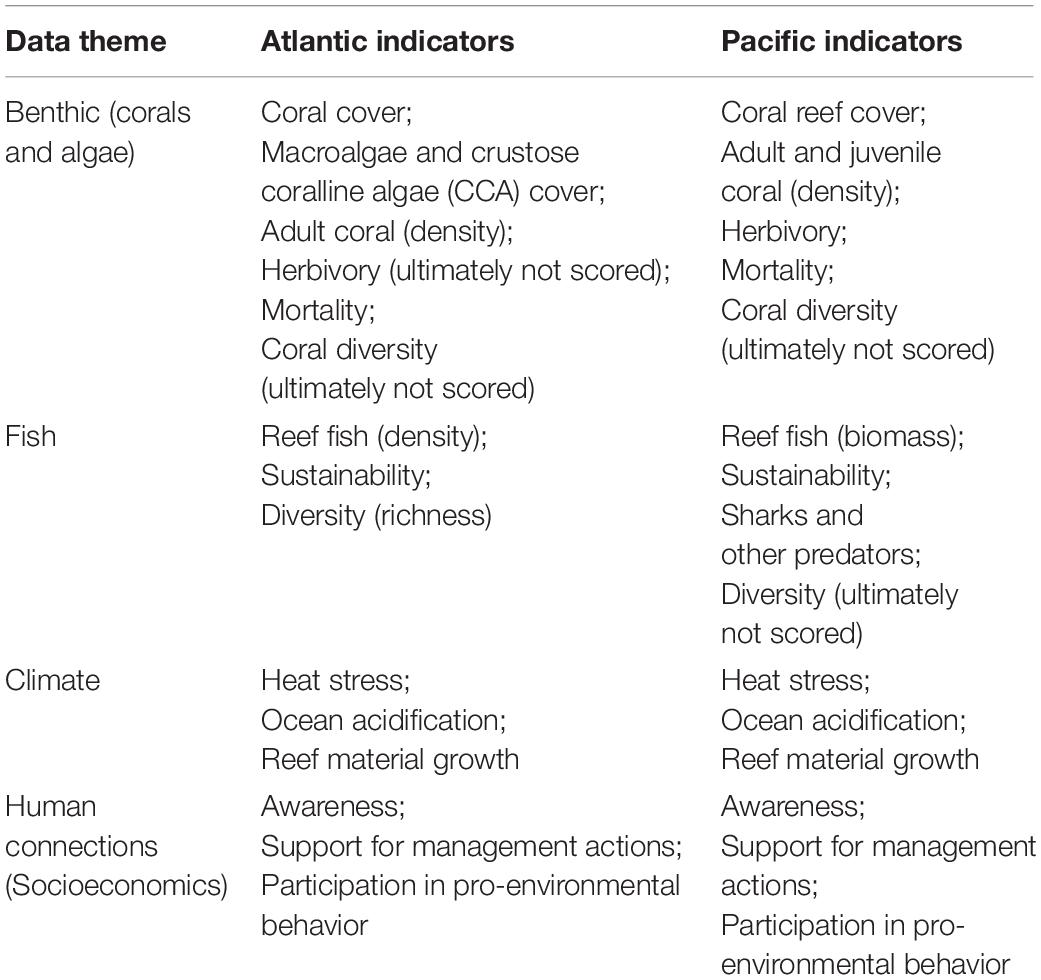
Table 1. Indicators chosen for the United States Atlantic and Pacific coral reef status reports by data theme.
What the Scores Mean
The definitions of the scoring bins were consistent across all jurisdictions in both ocean basins. Scoring bins were determined during initial stakeholder workshops and reviewed during subsequent meetings as part of the Pacific jurisdictional status reports process. They follow a traditional report card scoring (0–100% scale), which was deliberately chosen to resonate with the intended audience of the general public and policy makers. Careful consideration of the specific words used for each classification bin was important and required substantial debate before arriving at consensus via facilitation by the UMCES group (Figure 1).
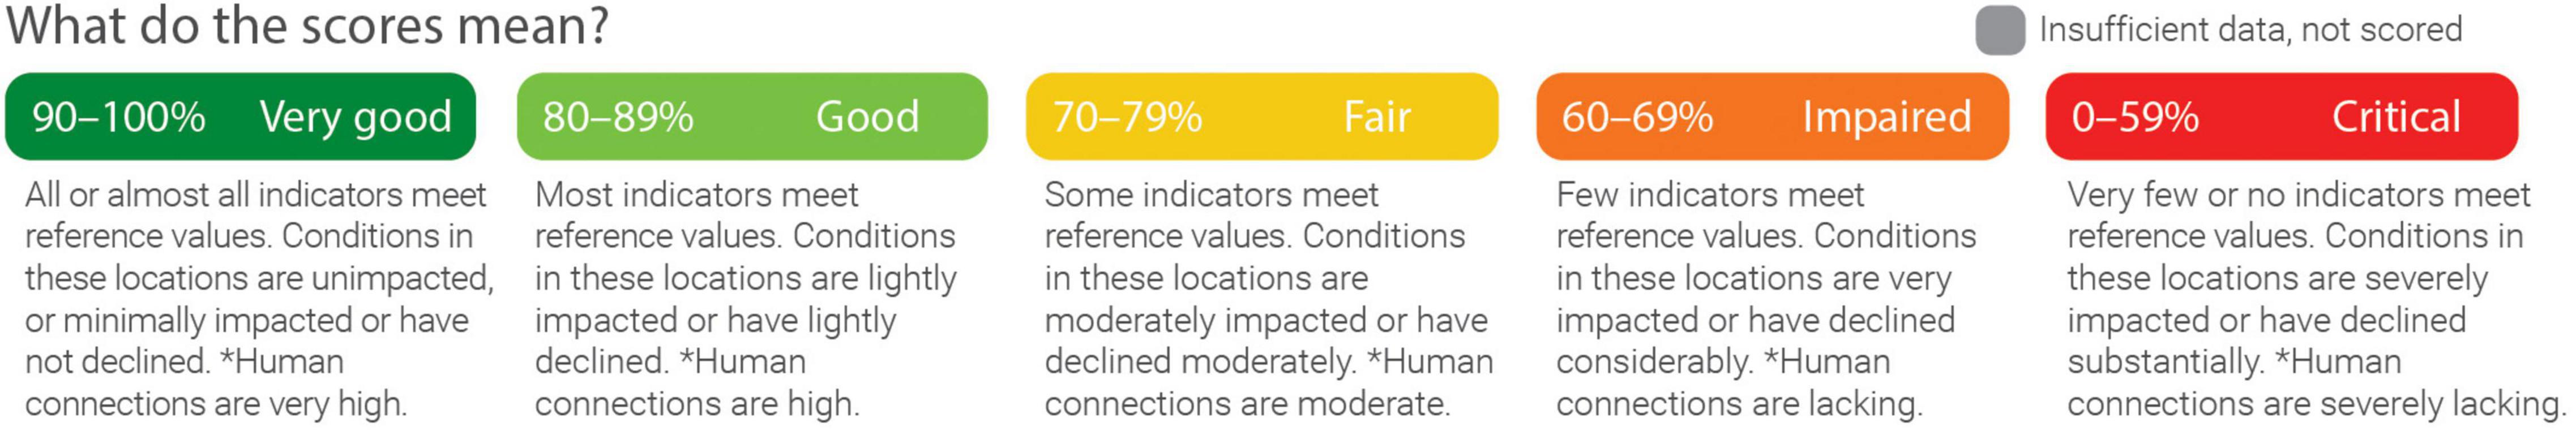
Figure 1. Definitions of the scoring bins used for all status reports.
Pacific Jurisdiction Reports
Pacific Jurisdiction Benthic Scores
In the Pacific jurisdictions, benthic cover is derived from point counts on sequential photo quadrat images of the benthos acquired along belt transects. Images are analyzed in the widely used machine-learning software, CoralNet (NOAA Coral Program, 2021). The benthic reef cover indicator included three sub-indicators: percent cover of coral, crustose coralline algae (CCA), and macroalgae. Average benthic cover estimates were calculated for all sites in a jurisdiction. The site-specific percent cover estimates were pooled by depth stratum, averaged, and weighted by habitat area (km2) to provide a jurisdiction-wide mean. These area-weighted benthic cover estimates were scored using criteria below (Table 2). For brevity, only examples for the Main Hawaiian Islands are shown here; refer to Donovan et al. (2018) for all other Pacific jurisdictions. Island/sub-region-wide means were area-weighted by percent forereef habitat when aggregated into the Main Hawaiian Islands-wide score. For each sub-indicator, the most recent percent cover values for a given sub-region were compared to the maximum sub-region-level value reported between 2013 and 2016 for the Main Hawaiian Islands. These were categorized for a given habitat structure to calculate the percent of the maximum, i.e., islands dominated by coral-rich habitats were only compared to other coral-rich islands. The percent of maximum values were then converted to a 0–100% scale using the equations in Table 2. For macroalgae, this was a negative relationship (greater macroalgae cover received a poorer score). To calculate scores for macroalgae the 60–100% scores were inverted so that 0% maximum = 100% (Table 2).
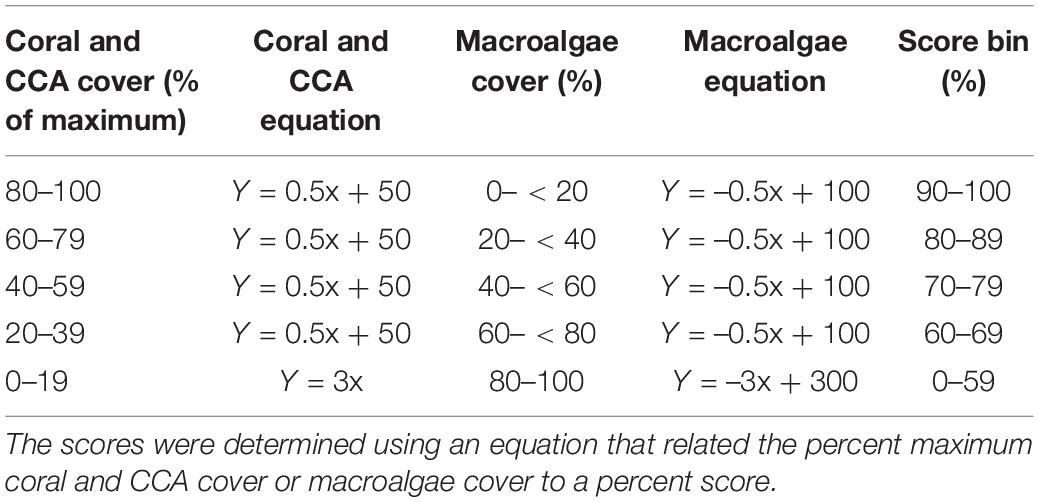
Table 2. Example of coral and crustose coralline algae (CCA) cover and macroalgae cover scoring for the Main Hawaiian Islands.
The juvenile and adult coral density indicators were generated from a select list of the most abundant and important coral taxa represented across all islands within a given habitat. The use of the selected taxa (genera and species) provided information about existing coral populations and incorporated a mechanism to determine how coral populations are changing over time (i.e., based on the fluctuation in one or more of the most abundant/important taxa). The selected coral taxa for each habitat structure type in the Main Hawaiian Islands used to generate estimates for the coral population indicators can be found in Donovan et al. (2018). Throughout the literature, there are no clear benchmarks to establish baselines for juvenile and adult coral density due to the natural variability in abundance across habitat space. The island level scores for adults and juveniles were calculated similarly to the percent cover (Table 2) using the following steps: (1) Reef area-weighted island and sub-region density estimates were generated from strata means for each of the species for 2013 through 2017 when stratified random surveys were conducted. (2) The score was calculated as a percent of the maximum island or sub-region density as follows: (a) Taxon density % max score = (taxon A density estimate for island or sub-region A/maximum island or sub-region density estimate for habitat A reported for all years for taxon A) * 100. (b) The scores were averaged across all taxa for a given island or sub-region. (c) The scores were then converted to a 0–100% scale using equations in Table 2. (d) These scores were generated separately for juveniles and adults.
The partial mortality indicator was generated from the same select list of abundant and important coral taxa used for juvenile and adult coral density (Donovan et al., 2018). Similar to density, there are no clear benchmarks to establish baselines for partial mortality due to the natural variability in abundance across habitat space. The island level scores for partial mortality were calculated similarly to the inverted macroalgae cover scores (i.e., greater mortality equated to a poorer score; Table 2) as follows: (1) Reef area-weighted island and sub-region partial mortality estimates were generated from strata means for each of the taxa for 2013 through 2017 when stratified random surveys were conducted. (2) The score was calculated as a percent of the maximum island or sub-region partial mortality as follows: (a) Taxon partial mortality% max score = (taxon A partial mortality estimate for island or sub-region A/maximum island or sub-region partial mortality estimate for habitat A reported for all years for taxon A) * 100. (b) The scores were averaged across all taxa for a given island or sub-region. (c) The scores were then converted to a 0–100% on an inverted scale using the equations in Table 2.
Pacific Jurisdiction Fish Scores
The indicators for the fish theme were reef fish, predators, and sustainability. Field sampling included stationary point counts (SPC) and towed-diver surveys (NOAA Coral Program, 2021). SPC surveys used a stratified-random survey design with the survey domain being all hard-bottom forereef habitat 0–30 m. Towed-diver surveys were conducted in 10–20 m deep forereef areas, with tows located haphazardly around islands with a goal of broadly spreading them around the island circumference. All fish sampling sites were co-located with benthic sampling. Scores based on shark abundance and biomass of other predatory fishes were averaged to make a single “predator” score before being averaged with the other fish indicators, i.e., the overall fish theme score consisted of the average of the reef fish biomass score, the predator score, and the sustainability score.
The reef fish indicator is a measure of the weight of fish per unit area (biomass) relative to local reference points—estimated baseline biomass at each location in the absence of humans, i.e., what would be natural for each location based entirely on its oceanographic and habitat setting (Williams et al., 2015). Total reef fish biomass is one of the most widely used measures for reef fish condition by research and monitoring scientists and is responsive to human impacts such as fishing and levels of protection. Reef fish biomass was estimated from survey observations using standardized length-to-weight conversion parameters and with per strata means weighted by strata area to generate jurisdictional means (Heenan et al., 2017). Jurisdiction biomass as a proportion of the local biomass baseline was converted to an indicator score on a 0–100% scale with a conversion function and break points determined by expert opinion. As it is widely recognized that even small human populations can have significant impacts on local reef fish biomass, and that fish biomass around human-populated islands is typically less than 50%, and not uncommonly less than 25%, of pristine biomass (MacNeil et al., 2015; Williams et al., 2015), the scoring system reflected an understanding that reef fish biomass greater than 80% of pristine biomass was the highest that would be likely to occur around any populated island, and even biomass of approximately one-third of the pristine baseline was not uncommon for populated islands (Figure 2). Specifically, reef fish biomass greater than 80% of the baseline was considered Very good (i.e., score of >90%), and a reef fish biomass level of 33% of the baseline was considered Fair (i.e., score of 70– < 80%).
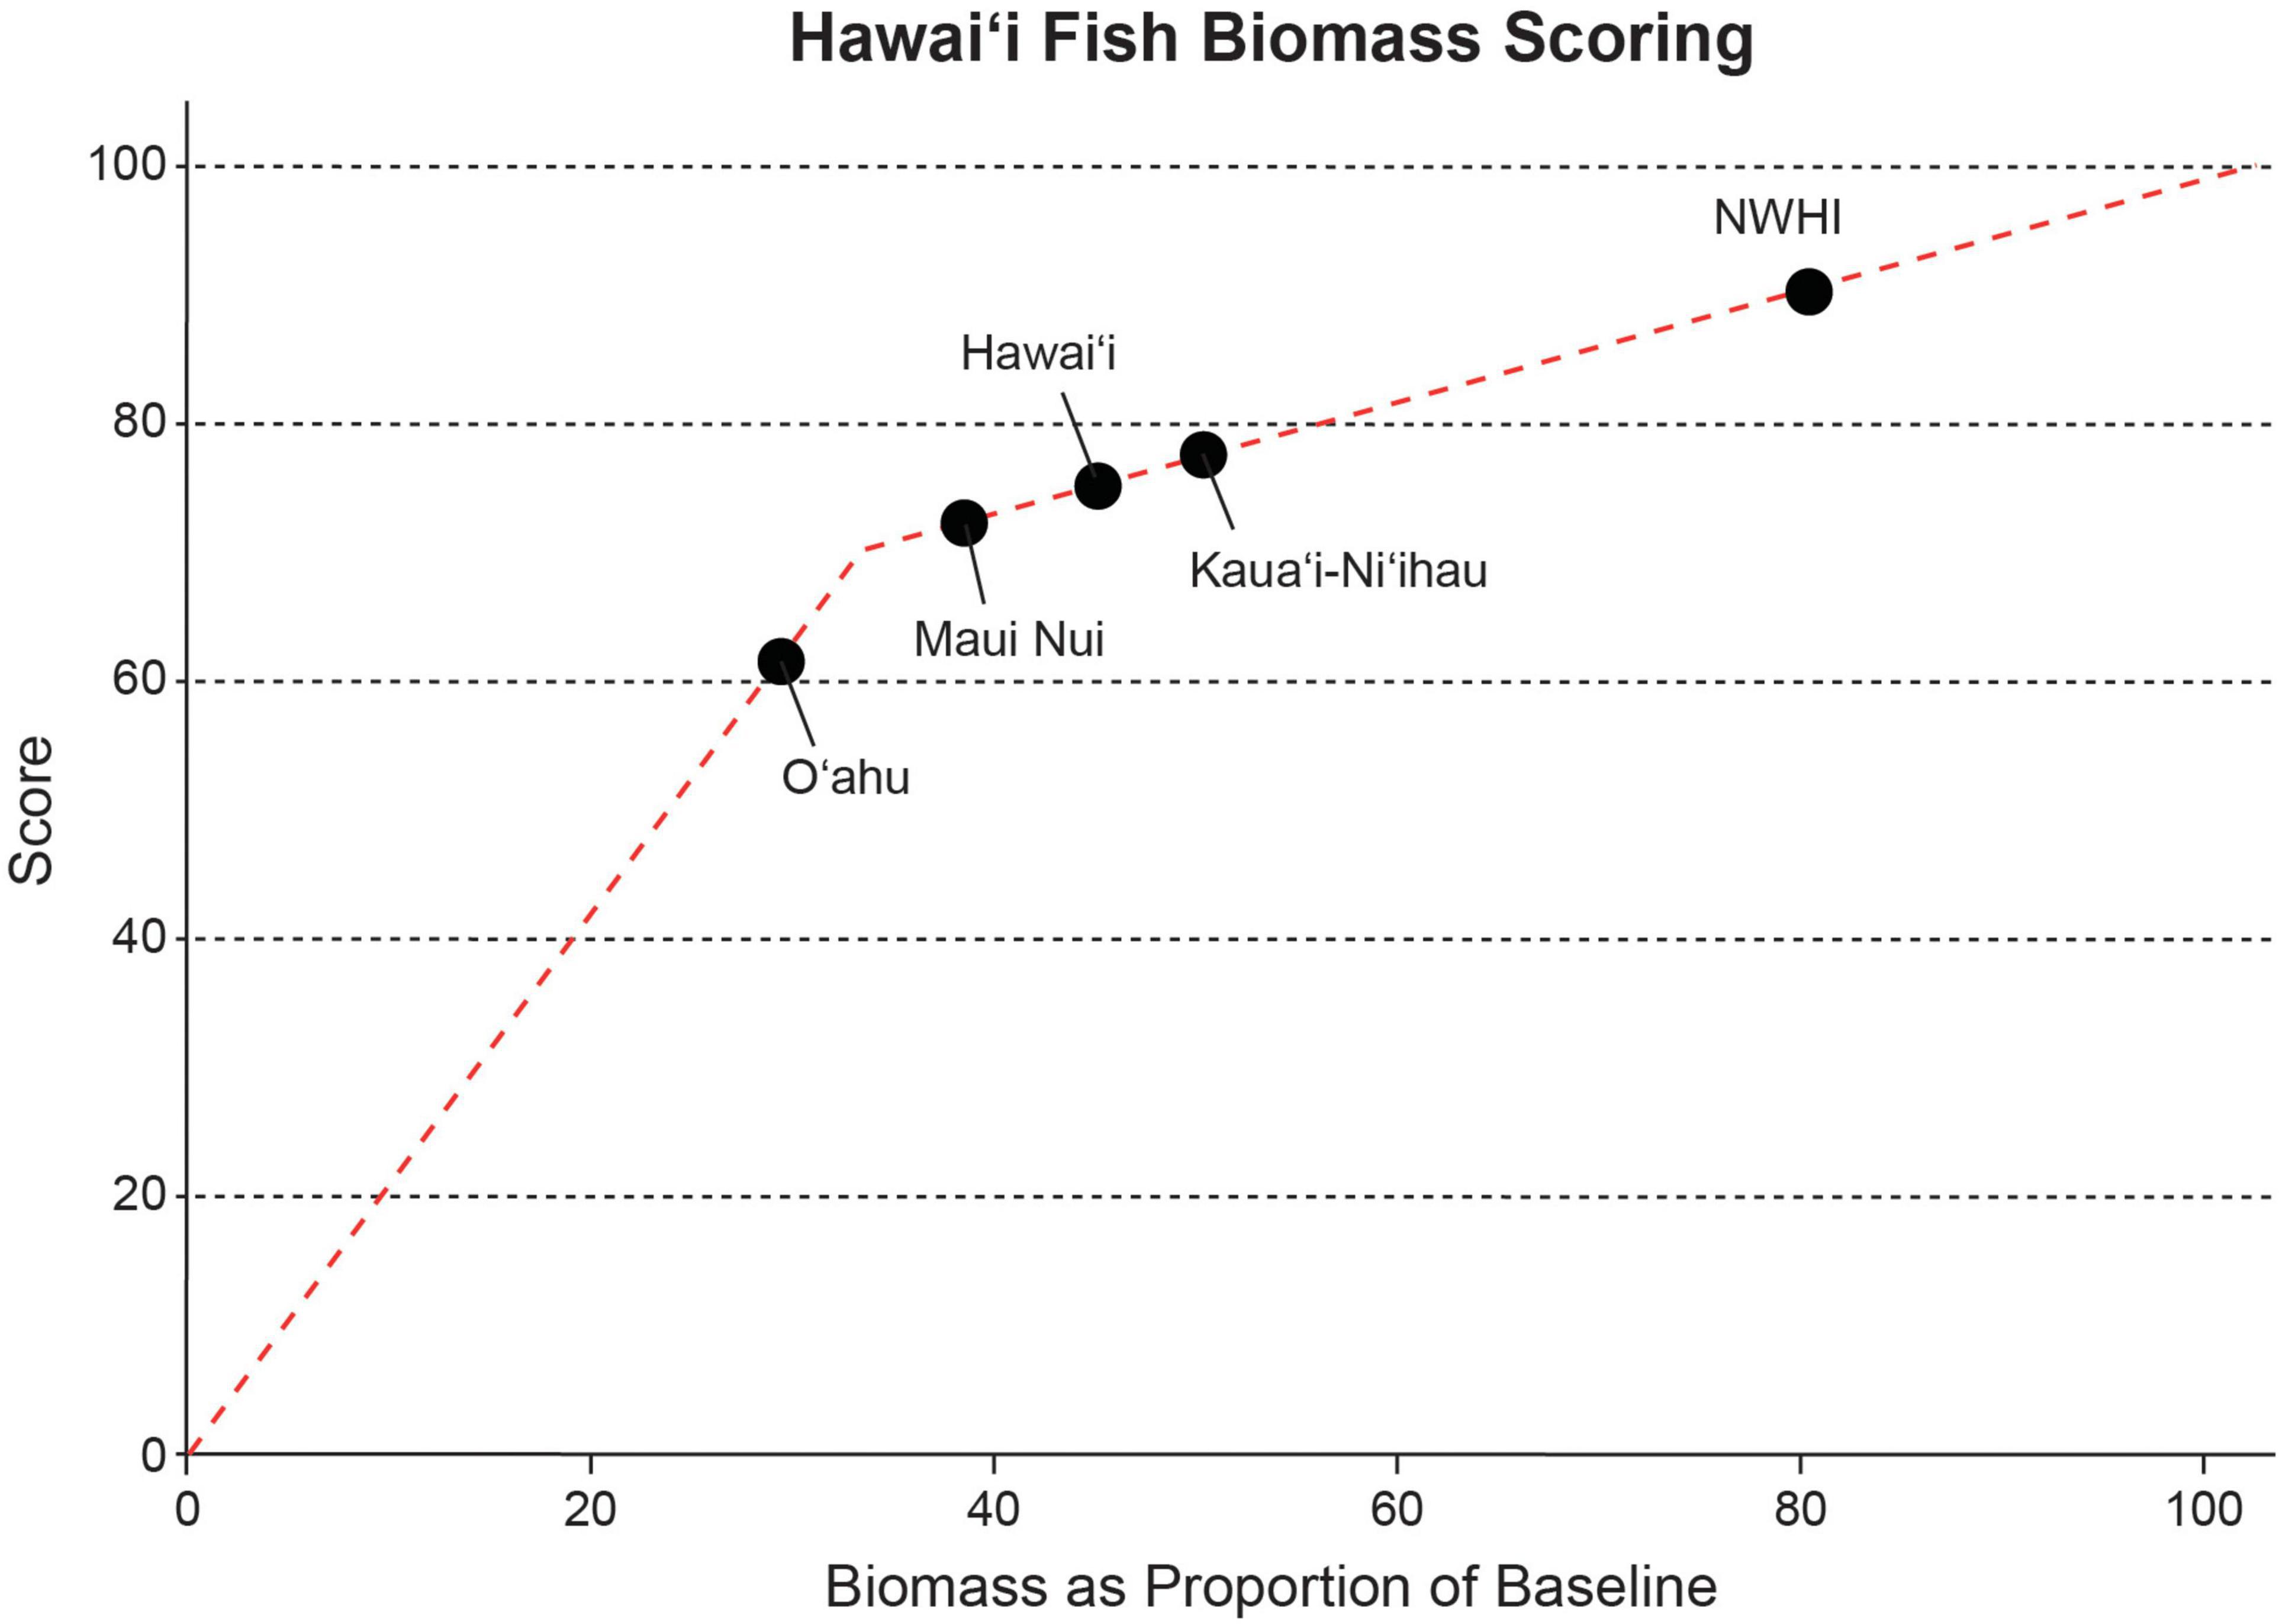
Figure 2. Scoring plot for the Main Hawaiian Islands (O‘ahu, Maui Nui, Hawai‘i, and Kaua‘i-Ni‘ihau) and the Northwestern Hawaiian Islands (NWHI) fish biomass using Williams et al. (2015) as the baseline.
As with reef fish, shark abundance was scored by first comparing the density from surveys with a model-generated estimate of baseline abundance in the absence of humans (Nadon et al., 2012) and then converting proportion of baseline values into scores using a scoring function (Figure 3). For these reports, experts modified the approach in Nadon et al. (2012) by including only sharks estimated to be one meter or larger in counts, and adjusting baseline estimates to remove the average number of sharks smaller than that size in the complete data set (i.e., 12% of all encounters). Small (less than 1 m long) sharks were excluded because divers occasionally encounter large schools of juvenile gray reef sharks. Not only do those encounters introduce high variability into the raw count data, they are also likely not representative of the long-term shark populations. ‘Other predator’ biomass was generated from biomass of all predators other than sharks and jacks in the NCRMP SPC surveys and compared against baseline biomass estimates generated in the same way as for the reef fish indicator and documented in Williams et al. (2015). Biomass of ‘other predators’ primarily was from snapper, grouper, and barracuda species, but included predatory emperors, moray eels, some goatfish, wrasse, mackerel, and others.
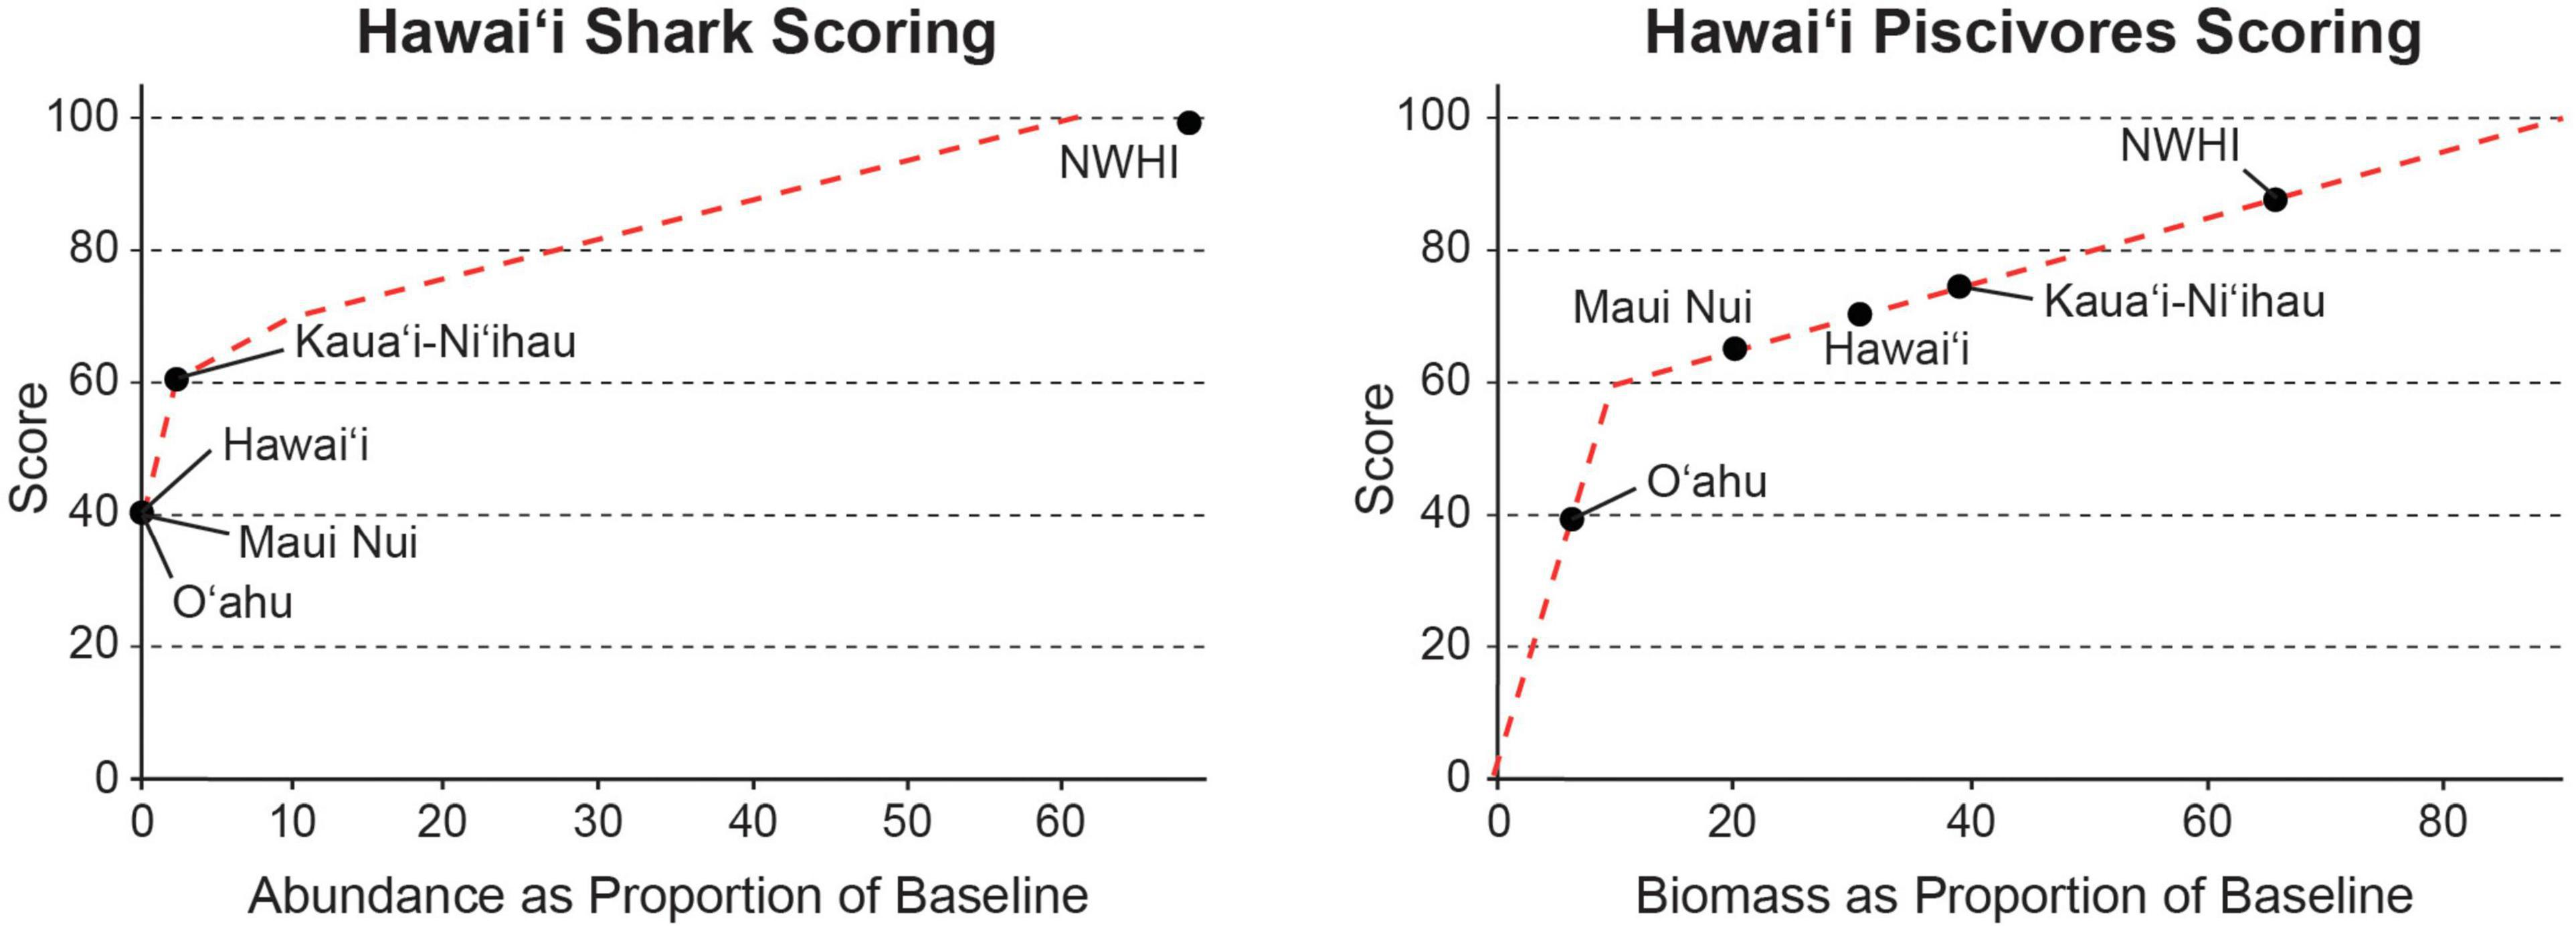
Figure 3. Scoring plots for the Main Hawaiian Islands (O‘ahu, Maui Nui, Hawai‘i, and Kaua‘i-Ni‘ihau) and the Northwestern Hawaiian Islands (NWHI) for sharks (left) and other piscivores (right) adapted from Nadon et al. (2012).
The herbivory indicator used in this assessment is a measure of the level of feeding pressure by fish on corals and algae. While the herbivory indicator was included as a benthic indicator, the sampling data, methodologies and scoring follow the same protocols as the reef fish biomass indicator. The status of each region was scored based on Williams et al. (2015) whereby local and baseline biomass were for those species classified as ‘primary consumers,’ which included parrotfishes, chub, most surgeonfishes, as well as a number of other small fishes such as some damselfishes.
The sustainability metric was based on mean size of targeted fishes, relative to estimates of regional sizes at maturity for those species—therefore a high score would indicate that populations of targeted species tend to include abundant larger individuals. In order to develop a method that was suitable across all Pacific jurisdictions for sustainability, it was necessary to use broad definitions of potential target species. Specifically, not all fish species are present in all regions, and even where present, there are regional differences in fishing pressure. For the purposes of this indicator, target species were defined as all large-bodied species (maximum length greater than 40 cm) of the following commonly targeted families: Jack, Surgeonfishes, Parrotfishes, Emperor, Grouper, Snapper, Goatfishes, and Squirrel/Soldierfish (Carangidae, Acanthuridae, Scaridae, Lethrinidae, Serranidae, Lutjanidae, Mullidae, and Holocentridae). Following discussions with local resource managers, some species were excluded because they are not preferred targets or because visual survey data tend to poorly represent their real population size distributions. The species excluded based on expert opinion were: the jacks Trachinotus spp., Seriola spp., and Elagatis bipinnulata, the surgeonfish Naso brevirostris, N. tonganus, and N. vlamingii; and the snappers Lutjanus bohar and L. fulvus.
Given the lack of information on size at maturity for most species in most regions, a standardized approach was used to generate size at maturity (L50) per species per region—L50 being the size at which 50% of individuals are expected to be sexually mature. First, the maximum observed size (from NCRMP survey data) by species within each region (regional LMax) was determined. Species with fewer than 20 observations within a region were excluded on the basis that the regional LMax could not be reliably estimated. The regional L50 was derived from a published empirical relationship for teleost fishes:
To generate interim sustainability metrics per species, the mean size of fishes of that species observed in each region was calculated, excluding fishes smaller than 40% of their regional LMax. That size cut off was intended to ensure that measured stocks were in targeted size ranges, and to prevent large recruitment pulses from having an undue influence on mean size (e.g., when there were many young-of-year fishes). Species for which fewer than five individuals were observed in a reporting region were excluded on the basis that a reliable mean size could not be generated for that location. For each species and reporting region, mean-size was divided by the regional L50 for that species to generate a metric that represented mean size relative to size at maturity for that species in that location. Those values were averaged within families, and the overall sustainability metric for each location was generated by averaging the metrics for each of the families at that location. Finally, those values were cubed in order to convert a length-based metric to a volume-based value. To convert that to a score that was applicable across all locations and comparable with other status report indicators (scored as percentages), a standard was developed based on known largely un-fished stocks. Specifically, the average of the sustainability metrics from locations where harvesting of reef fishes was likely to be negligible due to remoteness or well-enforced prohibition of fishing, e.g., the Northwestern Hawaiian Islands and the Pacific Remote Islands. That value was considered a remote-location benchmark for relatively un-fished reef fish stocks. The sustainability score for each region was generated by dividing the sustainability metric by that remote-location benchmark (Figure 4). Those scores were capped at 100%.
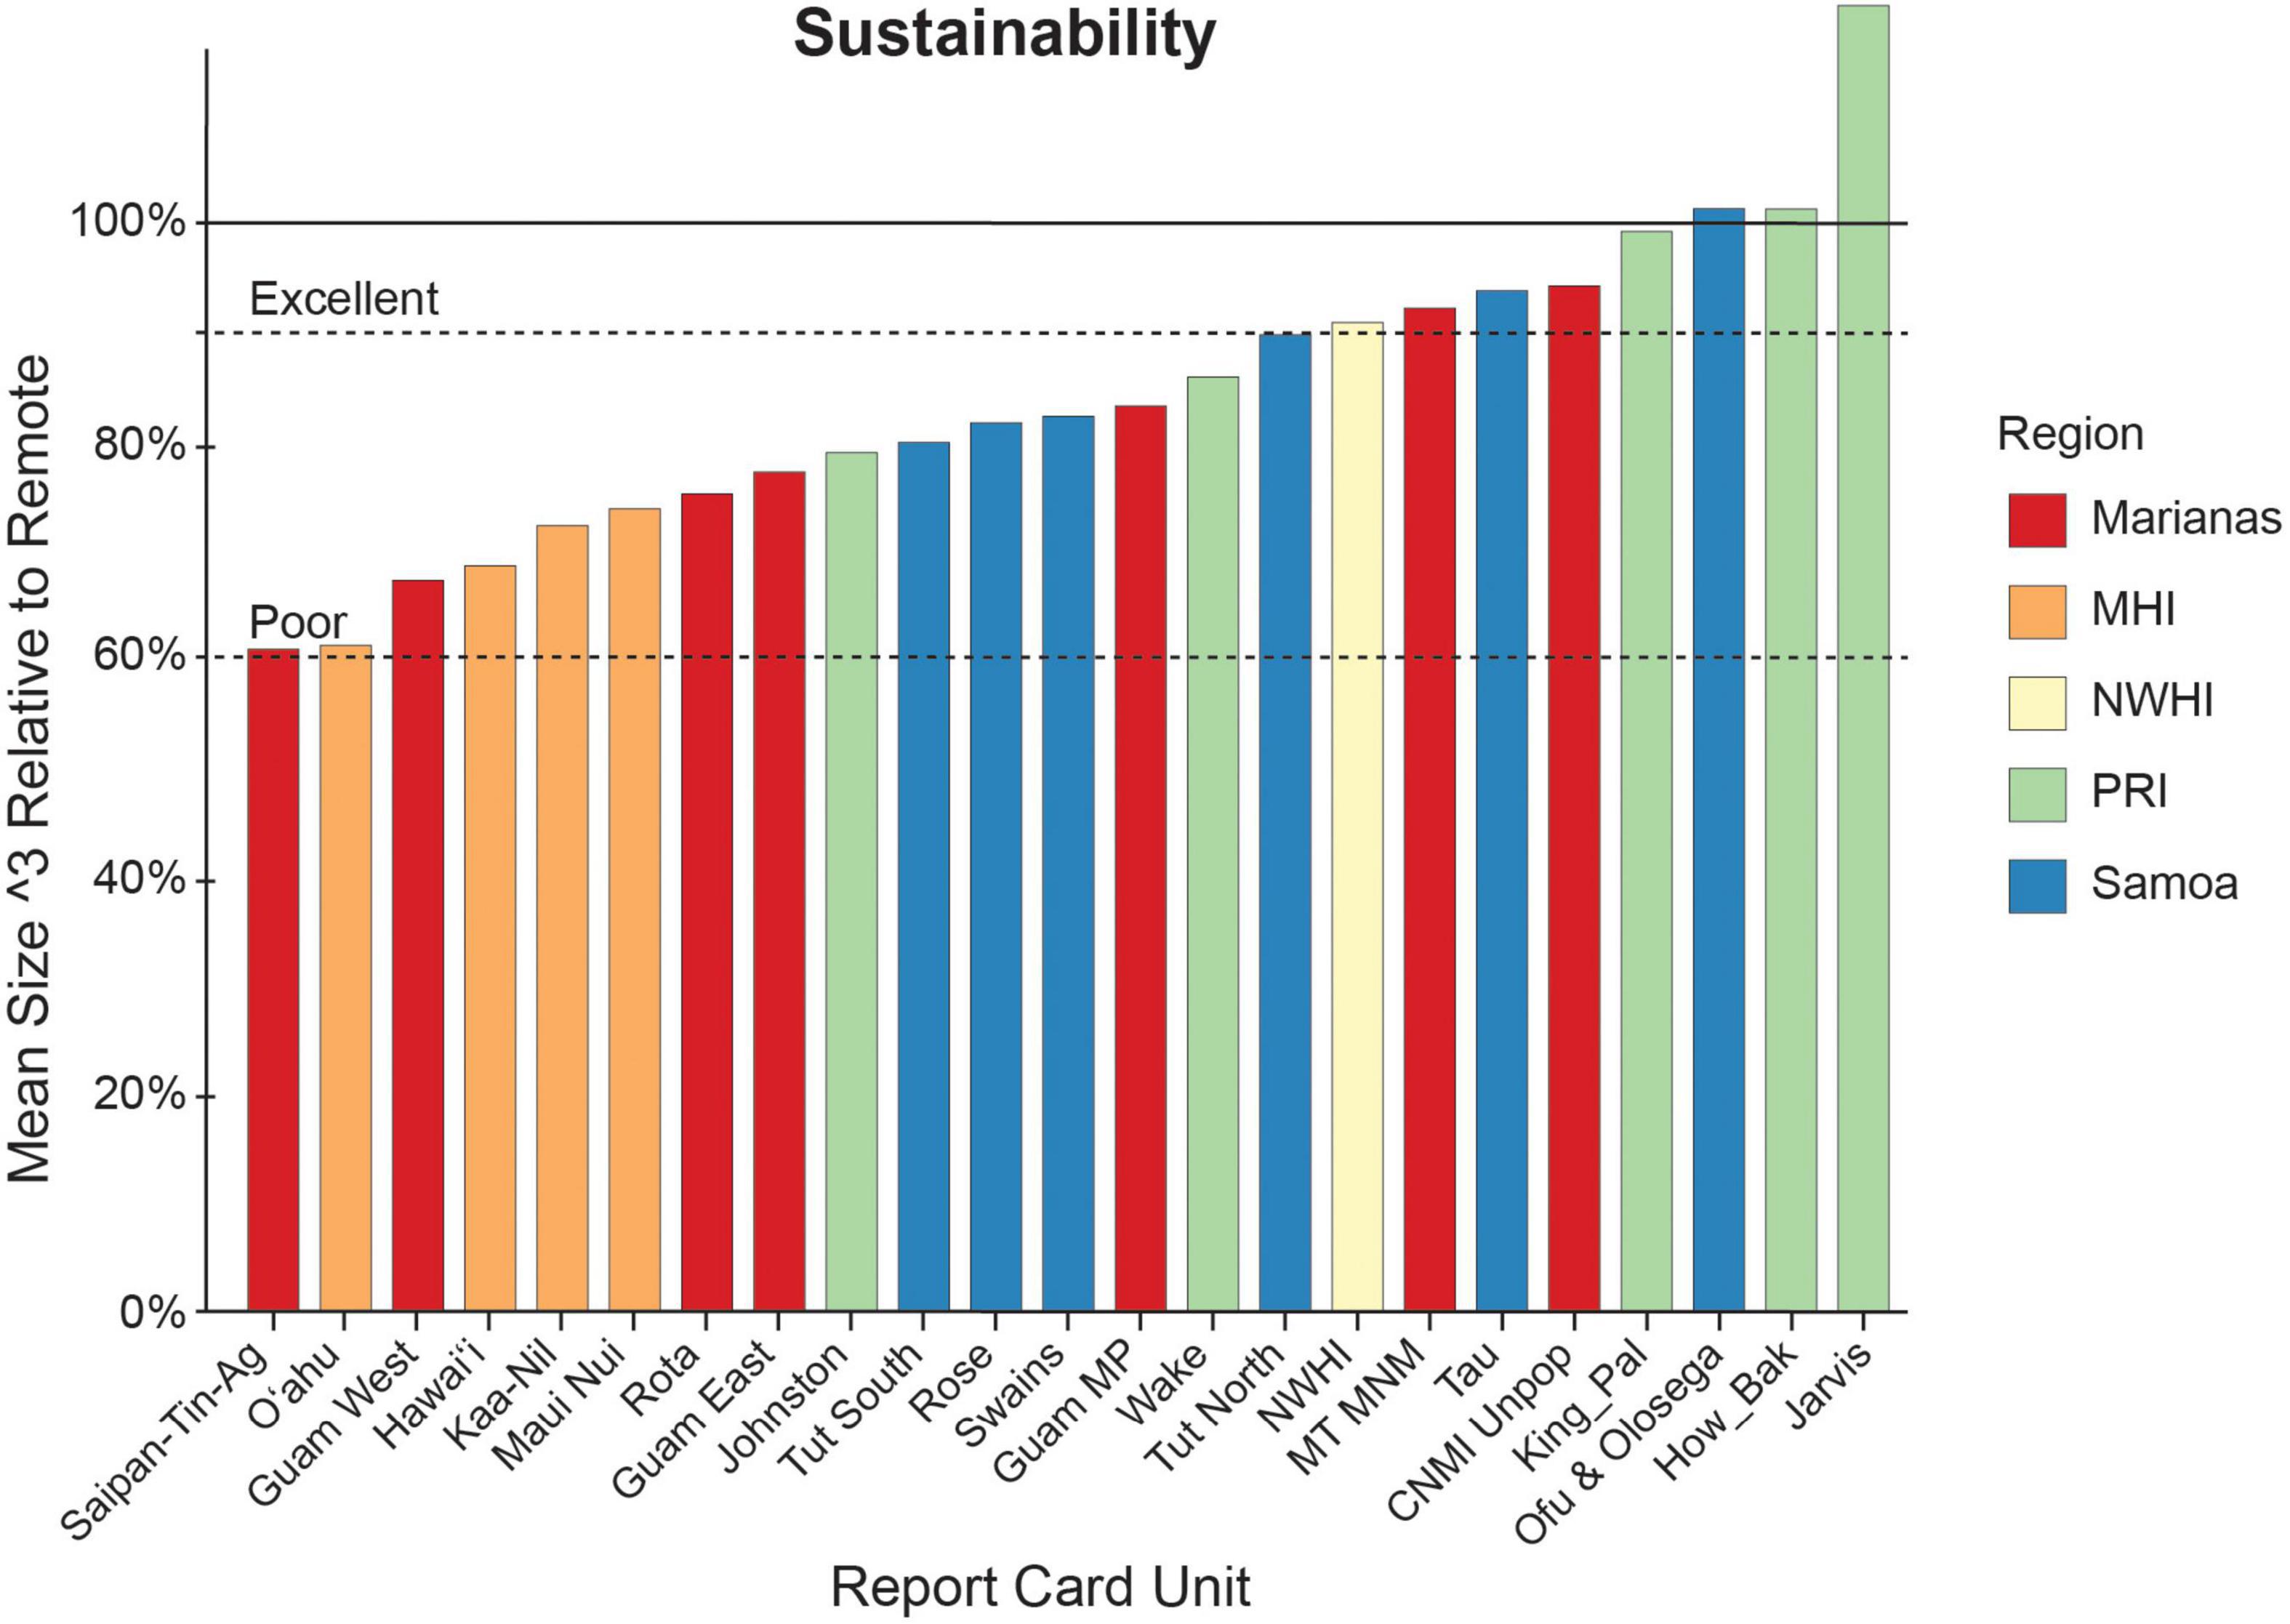
Figure 4. Status report scoring for fish sustainability for the United States Pacific jurisdictions by region using mean size relative to a remote-location benchmark.
Pacific Jurisdiction Climate Scores
The heat stress indicator scored coral health based on the occurrence and severity of coral bleaching heat stress experienced during the 4-year evaluation period (2012–2016), as measured by Coral Reef Watch’s (CRW) Degree Heating Week (DHW) product (Skirving et al., 2020). The DHW product provides a measure of accumulated heat stress, which is a strong predictor of mass coral bleaching (Skirving et al., 2020). CRW has been using NOAA’s operational near-real-time satellite sea surface temperature data to detect and monitor heat stress conducive to mass coral bleaching globally since 1997 (Liu et al., 2013, 2014, 2017). Monitoring data for the status report regions were extracted from CRW’s 5-km resolution global products, and statistical analysis was performed on the data to generate a score. Scoring was based on DHW event frequency and severity within the 4-year evaluation period.
To obtain frequency and severity of heat stress events within the evaluation period, all reef-containing 5-km data pixels for each area of interest were defined and the daily time series of DHW values were extracted. For reef areas encompassing ten or more 5-km data pixels, the 90th percentile DHW value was chosen for each time-step in the series. For areas with less than ten 5-km data pixels, the maximum DHW value was used for each time-step. From this 4-year time series of daily DHW values, the maximum DHW value that occurred in each year of the evaluation period was extracted. A scoring chart developed by CRW (Table 3) was used to place these four annual maximum DHW values into the context of their impact on reefs. The scoring chart ranked heat stress severity in seven bins based on DHW ranges shown across the top of the table in blue (Table 3, columns 4–10). The frequency of events at these levels are shown below each bin (in gray) and have varying distributions based on the relationship between DHW and coral bleaching and mortality. The corresponding score and an interpretation of what that score means are shown on the left-hand side of the table (Table 3, columns 1–3). Tallying the number of times a DHW level was reached in the 4-year period and matching it to the proper severity column and frequency row resulted in the corresponding score. The value in the 4-year period that resulted in the lowest score became the overall score for the reporting period. The chart considered repeated or consecutive years of high DHW events, as consecutive events would have a greater impact on corals than non-consecutive events. These have their own frequency label of “2c.” For example, during the period 2013–2016, if 2013 and 2015 saw DHW values of 9, the resulting grade would be 55%, but if 2013 and 2014 saw DHW values of 9 the resulting grade would be 45%.
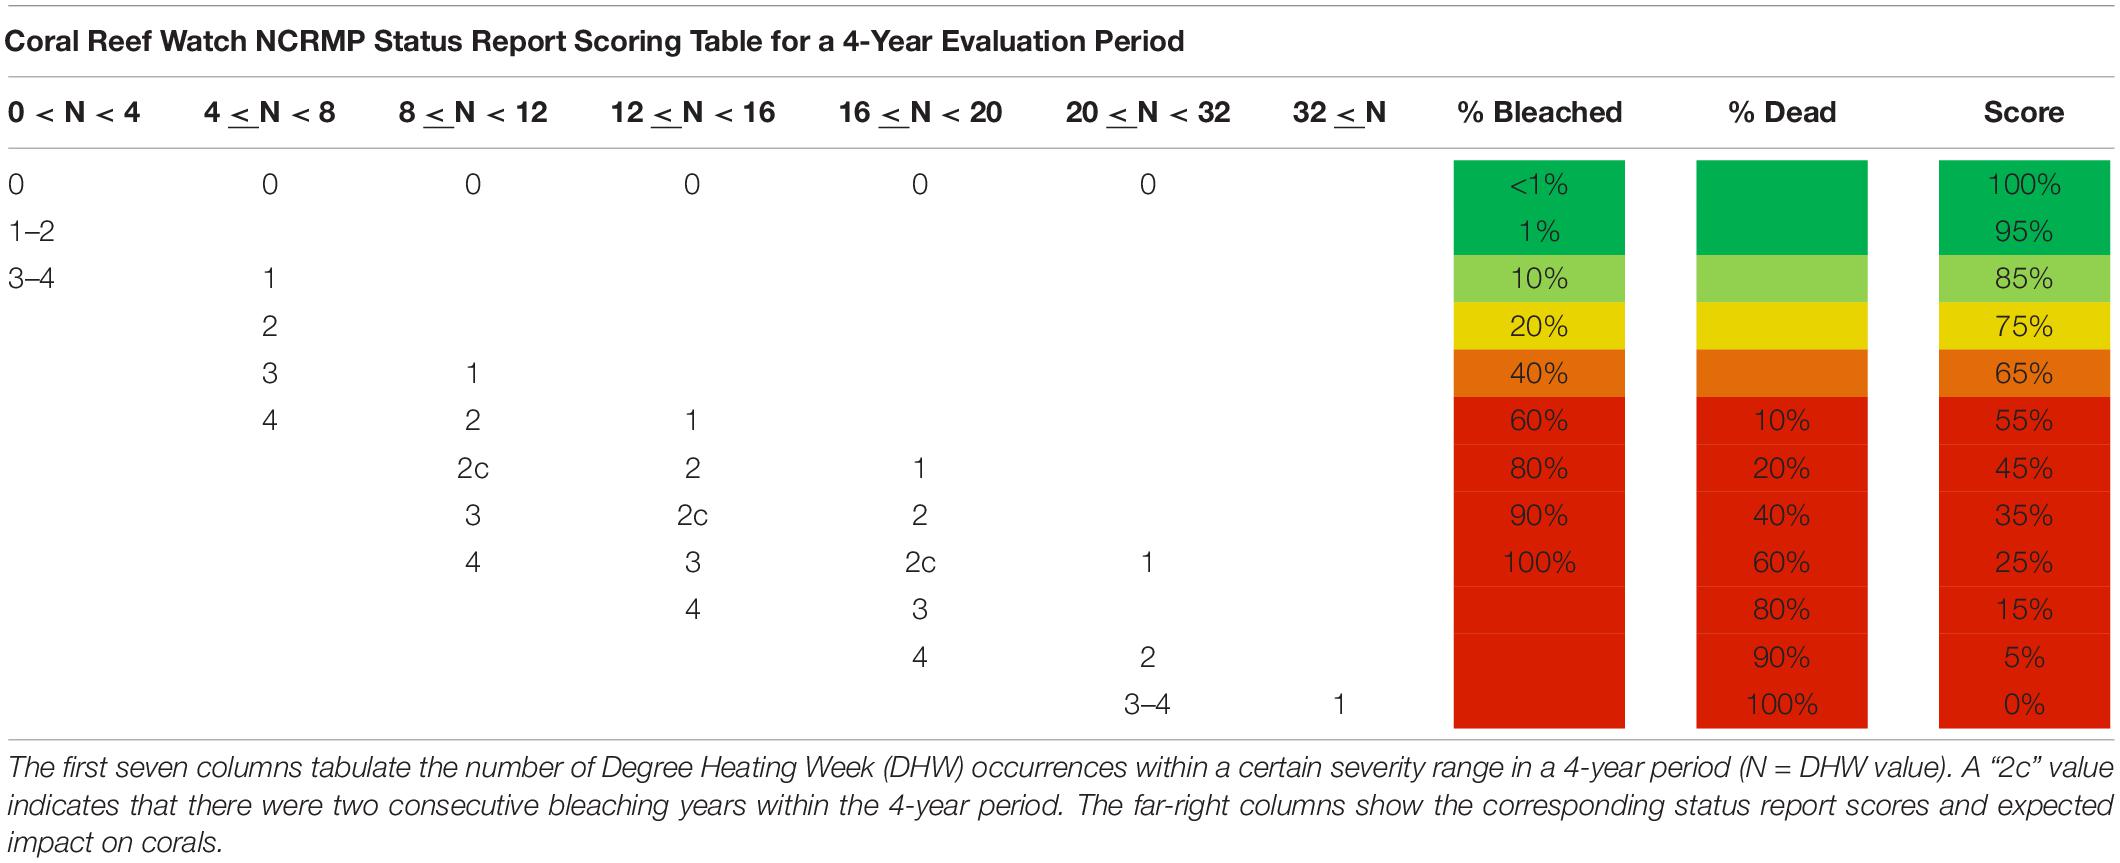
Table 3. Scoring chart for the heat stress indicator for all United States coral reef jurisdictions.
For the ocean acidification indicator, carbonate measurement data were collected by standard seawater sampling using Niskin bottle sampling co-located at the surface at the benthic and fish surveying sites (NOAA Coral Program, 2021). Water samples were returned to the laboratory and the amount of dissolved inorganic carbon (DIC) and total alkalinity (TA) per sample were measured. The full carbonate system (including aragonite saturation state) was then calculated using the computer program CO2SYS or R package ‘seacarb’ according to best practices (Dickson et al., 2007). Aragonite saturation states at each site derived from the water samples were averaged into an ocean acidification score. See Donovan et al. (2018) for the number of water samples per jurisdiction. The thresholds for this indicator were determined by using ecologically and climatologically relevant thresholds (Table 4) and were the same for all jurisdictions. Past (pre-industrial) and future (double pre-industrial) conditions for aragonite saturation state were estimated by keeping total alkalinity, salinity, and water temperature constant while altering the partial pressure of carbon dioxide. One annual mean aragonite saturation value in each year was determined for each region from multiple sample values. The mean aragonite saturation value was compared against the threshold and scored. The scores for multiple years were then averaged for a regional score.
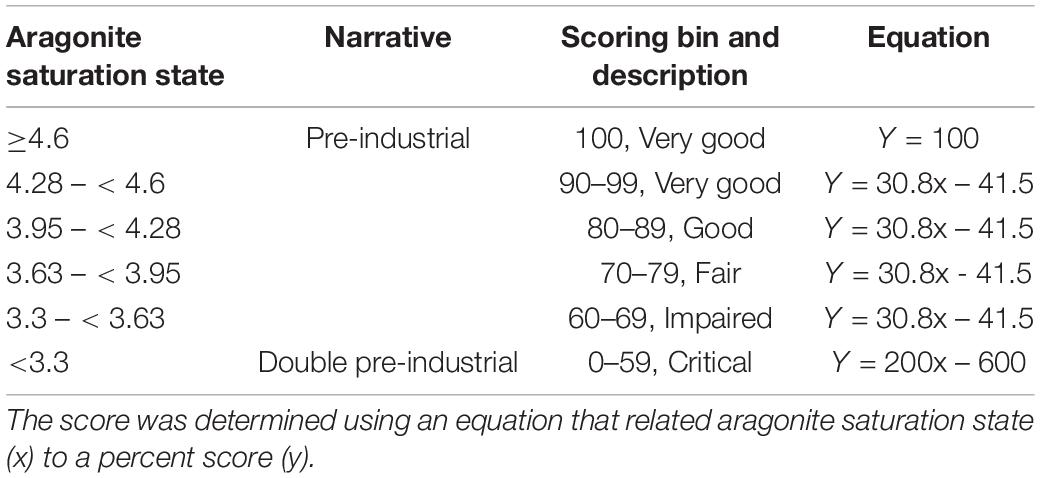
Table 4. Ocean acidification assessment points and associated scoring for all United States coral reef jurisdictions.
The reef material growth indicator directly measures the rate that calcium carbonate, i.e., the skeleton of corals and other calcifying organisms, accumulates in a given environment (Vargas-Ángel et al., 2015). Data were collected using Calcification Accretion Units (CAUs), a set of five stacks of two PVC plates per site out-planted for 3 years on a given reef (NOAA Coral Program, 2021). Units were recovered and the net weight of carbonate that accreted over the deployment period was recorded. Data presented in this report are from forereef sites. For jurisdictions with 2 years of data, the scores were averaged into an overall reef material growth score for the jurisdiction (using log-transformed data, back-transformed into the original scale). For more details on the years of collection and number of sites for each jurisdiction for reef material growth, refer to Donovan et al. (2018). Thresholds for scoring were guided by CAU data from throughout all Pacific jurisdictions, with specific thresholds coming from the log-transformed quantiles of Pacific CAU accretion rates, again back-transformed into the original scale (Table 5). Confidence in using this as an indicator of climate effects on coral reefs is moderate, as there is a broad spatial database of similar metrics. However, this metric does not directly target coral accretion rates, but rather the more OA-sensitive crustose coralline algae.

Table 5. Reef material growth (RMG) assessment points and associated scoring for United States Pacific jurisdictions.
Pacific Jurisdiction Human Connections Scores
Survey instruments for each jurisdiction are detailed in Levine et al. (2016) and Gorstein et al. (2018a; 2018b; 2019b). Relevant survey questions were assigned to each human connections indicator. The Awareness indicator had three metrics: familiarity with threats to coral reefs, familiarity with marine protected areas (MPAs), and agreement with selected value or importance statements for coral reefs. The Support indicator had two metrics: support for coral reef management options and agreement with various MPA functions1. The Participation in pro-environmental behavior indicator had one metric: frequency of participation in activities that help the environment such as beach clean-ups, volunteering with an environmental group, and recycling. While the specific wording of each question varied slightly by jurisdiction, the same question concepts were used to determine indicator results. Because there are no objective, agreed-upon thresholds for how aware, supportive, and involved a coastal community should be with respect to their coral reefs, the human connections references, or threshold goals, were determined via expert consultation in each of the jurisdictions (Donovan et al., 2018). In this way, these thresholds represent jurisdictional goals as opposed to a definitive determination of what is good or bad for the population with respect to their connectivity to reef resources. For example, a threshold of 66% familiarity reflects a jurisdictional goal that at least 66% of residents are familiar with all coral reef threats (Table 6). Similarly, a threshold of 70% participation in pro-environmental behavior at any frequency reflects a goal that at least 70% of residents participate in any form of pro-environmental behavior at any frequency in a given year (Table 6). Percentage scores for Human Connections indicators were calculated by dividing indicator scores from survey data by the established thresholds. Jurisdictional differences in the scoring thresholds allowed for the socio-cultural context to be considered in the same way the ecological context drives differences in benthic and fish indicators.
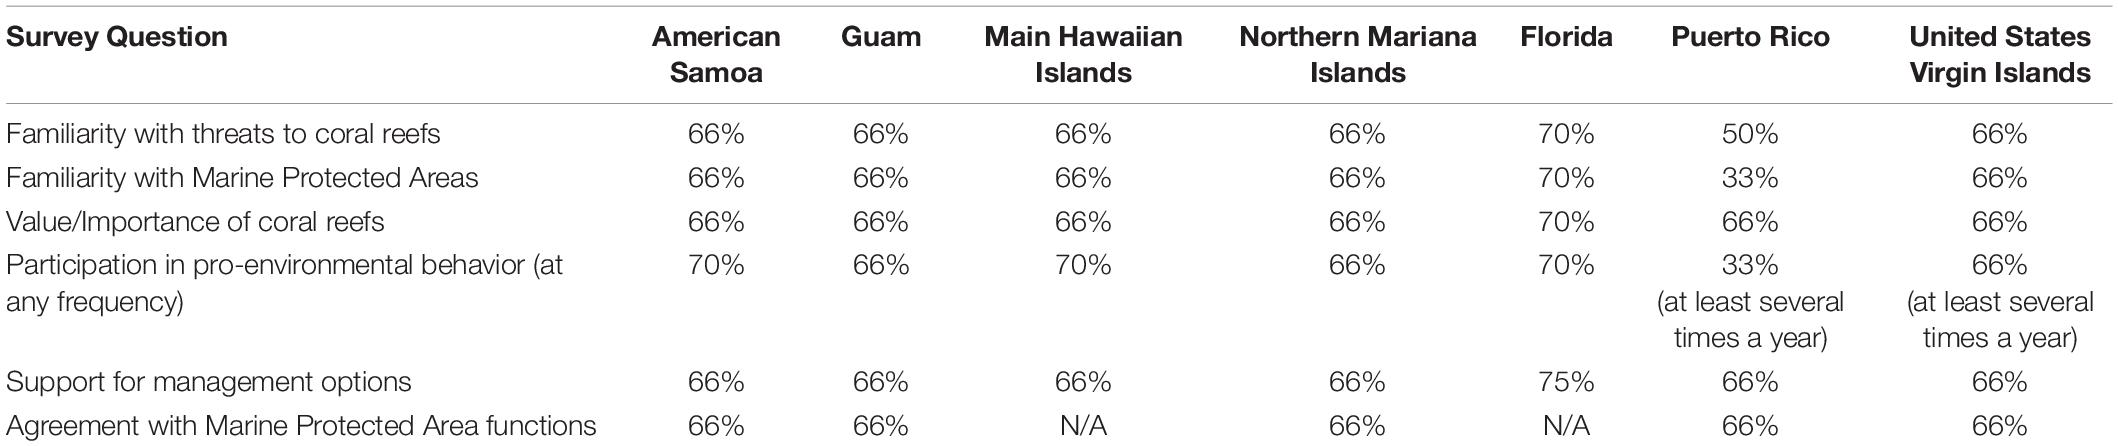
Table 6. Summary of scoring thresholds for Human Connections indicators in the United States Pacific and Atlantic inhabited jurisdictions determined by expert opinion and professional judgment.
Combining the Four Themes Into a Jurisdiction Score
Once the individual indicators within each of the four themes were scored, those scores were averaged to an overall theme score (one each for corals and algae, fish, climate, and human connections) for each sub-region. For each jurisdiction, the overall scores for three of the themes were weighted by reef habitat area (km2) based on sub-region coral reef areas and rounded to the nearest whole number. For example, the Main Hawaiian Islands had four sub-regions (O‘ahu, Hawai‘i, Maui Nui, and Kaua‘i and Ni‘ihau) that were each habitat area-weighted and then summed to the overall Main Hawaiian Islands theme score. The Human Connections score followed this approach where possible, but was only available at the overall jurisdictional level for American Samoa, Guam, and the Northern Mariana Islands due to data limitations. For data-limited jurisdictions, the overall scores for benthic, fish, and climate were area-weighted based on sub-region coral reef areas, and those overall theme scores were averaged with the Human Connections score. For uninhabited jurisdictions with no human connections data, just three theme (corals and algae, fish, and climate) scores were area-weighted, averaged and rounded to the nearest whole number.
Atlantic Jurisdictions Reports
Atlantic Jurisdiction Benthic Scores
In the Atlantic jurisdictions, a diver-based line point intercept (LPI) method is used to quantify benthic cover. This approach involves tallying the benthic elements that fall under specified intervals along transects of predetermined length (NOAA Coral Program, 2021). A standardized approach using Z-score values was used to compare the most recent NCRMP domain estimates (status area estimates, Smith et al., 2011) to indicator- and region-specific reference values (Supplementary Table 2). Site level status values were first transformed to Z scores using the following equation (equation 1):
Status values represent the most current NCRMP data completed prior to the status report analysis. For sampling sub-regions with a total of three completed NCRMP missions (Flower Garden Banks, St. Thomas/St. John in the United States Virgin Islands, Southeast Florida, Florida Keys, and Dry Tortugas), status values were calculated as follows: the two most recent years of data were combined, weighted by reef area, and then used to calculate the domain estimate. For sampling regions where only two NCRMP missions were completed prior to this status report (Puerto Rico and St. Croix in the United States Virgin Islands), the most recent sampling year domain estimate was used as the status value. Reference values were calculated as the mean and variance of a dataset derived from one or more of the following: long-term monitoring data, historic survey data from peer-reviewed scientific literature, or, in the absence of either, domain estimates from the first year of NCRMP sampling for the region. Reference values were then assigned a score ranging from Very good to Critical. Reference data and scores were based on the available data and included jurisdictional partners’ expertise on current and historic conditions. Therefore, reference datasets differed by indicator and by region (Supplementary Table 2). An ideal reference area would have similar coral community structure and demographics, sufficient sampling for statistical power, and be from a time period or geographic area unaffected by anthropogenic stressors such as fishing pressure, land-based sources of pollution, and heat stress. The availability of ideal reference data within each region for each indicator was limited and the best possible alternative was often selected instead. For each indicator within each region, careful consideration was given to reference data selection and the sensitivity of the final score (for non-significance).
The status Z score value was calculated as the sum of the weighted means and variances (stratum weights) of Z score data aggregated at the strata-level. A reef area weighting scheme was applied where applicable. The status Z score value was then compared to the reference Z score value (zero) using a Student’s T-test. A scoring rubric based on p values was created by first assigning the previously determined reference score to p-values > 0.05, indicating no change. The other four categorical scores were assigned to the remaining p-values based on rank (Table 7). See the R package NCRMP.benthics.statusreport (Groves, 2019) for all the data and functions used to calculate the benthic scores.
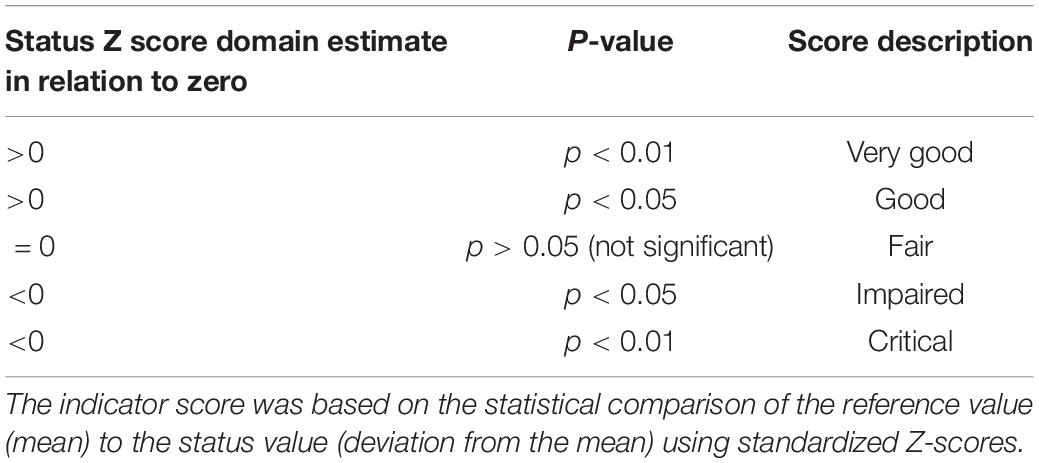
Table 7. Example scoring rubric for Atlantic benthic indicators where the reference value was determined to be in Fair condition.
Atlantic Jurisdiction Fish Scores
As in the Pacific jurisdictions, the Atlantic jurisdiction fish data is collected using SPC methods (NOAA Coral Program, 2021). The statistical methods for the Atlantic fish scores were identical to the Z-score methods described above for the Atlantic benthic scores; only the input data differed. For the reef fish indicators, site level means were aggregated into strata level means, weighted by strata area, and summed to calculate the sampling domain estimates (status area estimates, Smith et al., 2011). Sampling domain estimates were calculated for each of the three Florida sub-regions (Dry Tortugas, Florida Keys, and Southeast Florida), each of the two United States Virgin Islands sub-regions (St. Thomas/St. John and St. Croix) and for Puerto Rico (no sub-regions). The Flower Garden Banks monitoring data only had one strata so weighting was not required to produce domain estimates and the standardization described below was unnecessary. All other Z-score calculations and comparisons were applicable. A standardized approach using Z-scores values was used to compare NCRMP domain estimates (status values) to indicator- and region-specific reference values (Supplementary Table 2). All observations were standardized into six categories that included two depths (<12 m and ≥12 m) and three rugosities (<0.3 m, ≥0.3–0.7 m, and ≥0.7 m). This standardization aimed to remove the effect of habitat on the fish indicator metrics between the reference area and sampling domain. As such, sampling domains were not penalized for having a different habitat composition compared to the selected reference area. Reference time periods and areas were selected with input from jurisdictional stakeholders and consisted of long-term monitoring data from the National Centers for Coastal Ocean Science and Southeast Fisheries Science Center Reef Visual Census (RVC) prior to the inception of NCRMP or the earliest available NCRMP RVC sampling data. Reference areas were regionally specific (Supplementary Table 2). Similar to the benthic indicators, an ideal reference area would be large enough in spatial scale to encompass representative habitats and depths, have sufficient sampling, and be unaffected by anthropogenic forces such as fishing pressure and land-based sources of pollution. Most often, the regions did not have an ideal reference area; therefore, subject matter expert opinion from NCRMP, jurisdictional scientists, and coral reef resource managers were used to select the best possible reference area and assess the quality of that reference area (i.e., Fair or Good). While the use of expert opinion led to some subjectivity when determining the scoring rubric, careful consideration was given to the reference area in each region for each metric when determining the final score (for non-significance) and the scoring depended on how well the reference area fit the ‘ideal.’
In most cases, status values were calculated by taking the combined strata area-weighted domain estimate for the one or two most recent sampling years. The site level status values were first transformed to Z scores using the same equation described for the Atlantic benthic indicators (equation 1). The status Z score value was calculated by taking the mean of the site level Z scores. A reef area weighting scheme was applied where applicable. The status Z score value was then compared to the reference Z score value (zero) using a Student’s T-test. A scoring rubric based on levels of significance (p-values) was created to test statistical similarity for each metric between the reference area and sampling domain.
Sustainability (Sus) was defined as the fishing mortality rate (F) divided by the natural mortality rate (M) (Sus = F/M). Each sampling domain was scored on a 1–5 scale. A sustainability score of 1 was considered Very good, and ≥5 was Critical. These scores were assigned based on general fisheries statistics where if F = M then the fishing mortality rate is approximately at maximum sustainable yield (MSY). Therefore, a ratio of 1 indicates that the fishing mortality or observed (F) is equal to the fishing mortality rate at maximum sustainable yield (FMSY). A ratio above 1 indicates that F > FMSY which is not sustainable (Ault et al., 2014). See Donovan et al. (2020) for specific datasets used and levels of significance for Z scores.
Atlantic Jurisdiction Climate Scores
The temperature stress indicator was scored based on the occurrence and severity of heat stress experienced in a jurisdiction during the 4-year evaluation period (2014–2017) using the methods described in Table 3 for the Pacific jurisdiction reports. The ocean acidification indicator was also calculated as previously described in the Pacific jurisdictions (Table 4) and Donovan et al. (2018). The number of sites sampled and years of data collection for the Atlantic jurisdiction water samples can be found in Donovan et al. (2020).
Data for the reef material growth indicator were collected by a census-based method, termed ReefBudget (Perry et al., 2012). Surveys were conducted to measure the abundances of the dominant calcifiers and bioeroders on a given reef. These abundance data were then used to estimate rates of calcium carbonate production and bioerosion based on published rate data for the various taxa. Thus, for each reef site there was a measure of carbonate production and bioerosion rates by taxa, as well as net reef production. The number of sites sampled and years of data collection are detailed in Donovan et al. (2020). To determine scores for reef material growth, historical net reef production in shallow water Caribbean reef environments (0–10 m), prior to recent ecological degradation were utilized in the range of 10–17 kg CaCO3 m–2 yr–1, with values of 10 considered on the low end (Vecsei, 2001; Perry et al., 2013). Thus, 10 kg CaCO3 m–2 yr–1 was set as the lower bound of a Very good score of >90% (Table 8). A reef site that was net erosional (net production negative) was considered Critical (Table 8).
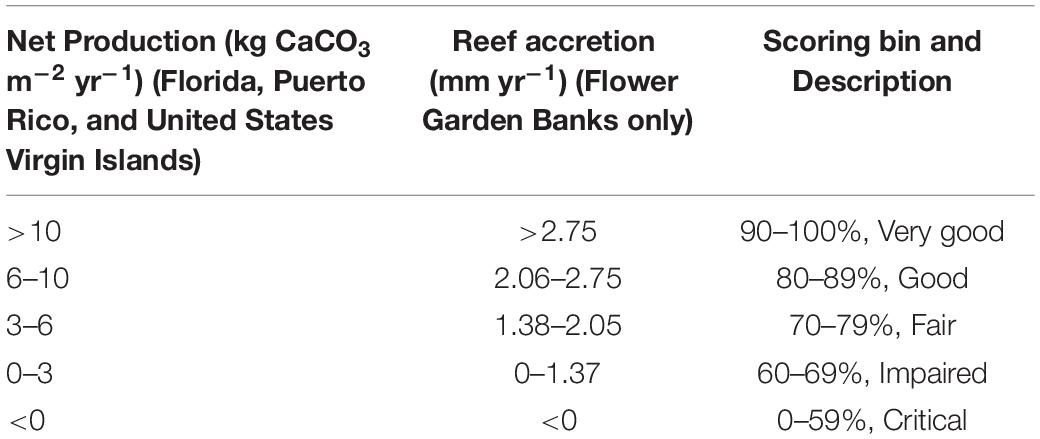
Table 8. Net production values (kg CaCO3 m–2 yr–1) for United States Atlantic/Caribbean jurisdictions and modified scoring scheme for reef accretion (mm yr–1) for the Flower Garden Banks corresponding to the scoring bin and description for reef material growth scores.
The reef material growth metric for the Flower Garden Banks was calculated differently than the other Atlantic/Caribbean jurisdictions because the Flower Garden Banks are deeper reefs (transects range from 19 to 23 m) and the scoring system devised for the other NCRMP sites was based on shallower reef sites (0–10 m, Perry et al., 2013). There are far less data on carbonate production from deeper reefs in the Atlantic and the known data are expressed as accretion rates (mm yr–1). CaCO3 production data from the Flower Garden Banks were converted to accretion rates using methods described in Perry et al. (2012), which yielded a mean accretion rate of 3.83 mm yr–1. The historical mean accretion rate for Atlantic sites (20–25 m) was 2.76 mm yr–1; the maximum accretion rate for a reef site > 20 m was 5.5 mm yr–1 (Hubbard, 2009). An assumption was made that if a site was at or above the historical mean (2.75 mm yr–1), it would receive a Very good score, >90% (Table 8). A site with zero accretion (net erosion) was scored as ≤59% and was reflective of a Critical score (Table 8). Perry et al. (2012) reported that, on average, carbonate production has declined by 50%, thus a value that was 50% of 2.75 mm yr–1 (1.38 mm yr–1) was used as the lower bound of a Fair score as this is considered the current norm for the Caribbean.
Atlantic Jurisdiction Human Connections Scores
The three Human Connections indicators were identical to those described for the Pacific jurisdictions2. Survey instruments for each Atlantic jurisdiction are detailed in Gorstein et al. (2016; 2017; 2019a). Similar to the Pacific jurisdictions, in lieu of objective, agreed-upon thresholds for how aware, supportive, and involved a coastal community should be with respect to their coral reefs, the human connections threshold goals were determined via expert consultation with coral reef managers, education and outreach coordinators, and relevant federal, state, and local agencies in each of the jurisdictions (Donovan et al., 2020). For example, a threshold of 50% familiarity reflects a jurisdictional goal that at least 50% of residents are familiar with all coral reef threats (Table 6). Similarly, a threshold of 33% participating in pro-environmental behavior several times a year reflects a goal of at least one third of residents participating in any form of pro-environmental behavior at least several times a year (Table 6). Percentage scores for Human Connections indicators were calculated by dividing indicator scores from survey data by the established thresholds.
Combining the Benthic, Fish, Climate, and Human Connections Scores for a Jurisdiction Score
Similar to the Pacific scoring approach, once the individual indicators within each of the four themes were scored, those scores were averaged to an overall theme score (one each for corals and algae, fish, climate, and human connections) for each sub-region. For each jurisdiction, the overall scores for three of the themes were weighted by habitat area (km2) based on sub-region coral reef areas, where relevant, and rounded to the nearest whole number. For example, the United States Virgin Islands had two sub-regions (St. Croix and St. Thomas/St. John) that were each area-weighted and then summed to the overall United States Virgin Islands theme score. Sub-regions were not used for Puerto Rico or the Flower Garden Banks. The Human Connections score followed the sub-region approach where possible, but was only available at the overall jurisdictional level for Puerto Rico and Florida due to data limitations. For data-limited jurisdictions, the overall scores for benthic, fish, and climate were area-weighted based on sub-region coral reef areas, and those overall theme scores were averaged with the Human Connections score. For uninhabited jurisdictions with no human connections data, just three theme (corals and algae, fish, and climate) scores were area-weighted, averaged, and rounded to the nearest whole number.
National Status Report
An overall score for the United States Pacific coral reefs and an overall score for the United States Atlantic coral reefs were calculated by combining individual jurisdictional report scores for each indicator. The data that informed the overall basin scores were derived from averaging the jurisdictional report scores for each region area-weighted by total reef amount for that jurisdiction. No new data were used to assess the basin scores. See Donovan and Towle (2020) for reef areas for the Pacific and Atlantic jurisdictions, respectively. Area-weighted scores were summed for all jurisdictions, rounded to the nearest whole number, and followed the same scoring system as the individual jurisdictional reports (Donovan and Towle, 2020). Due to strong differences in the ecology, biogeochemistry, geology, human development, economy, and cultures in the Pacific and Atlantic jurisdictions, as well as different scoring approaches between basins for some benthic and fish indicators, the Pacific and Atlantic jurisdiction scores were not combined into a single national score.
Results
Pacific Jurisdictions
Overall ecosystem scores were Good [Pacific Remote Islands (PRI) (82%); American Samoa (80%)] and Fair [Northern Mariana Islands (NMI) (78%); Northwestern Hawaiian Islands (NWHI) (76%); Guam (71%); Main Hawaiian Islands (71%)] (Table 9). Benthic scores ranged from Good (American Samoa; PRI) to Impaired (Guam; Main Hawaiian Islands). Both jurisdictions that had Impaired benthic scores also had Critical scores for the herbivory indicator, and also had Impaired Fish scores (Guam; Main Hawaiian Islands). Conversely, remote jurisdictions (NWHI; PRI) had Very good fish scores. Climate stress heavily impacted reefs during the reporting period (2012–2016) particularly in the NMI and the NWHI, which received Impaired and Critical overall climate scores, respectively. Human connections scores were Very good (NMI) or Good for all inhabited jurisdictions (Table 9).
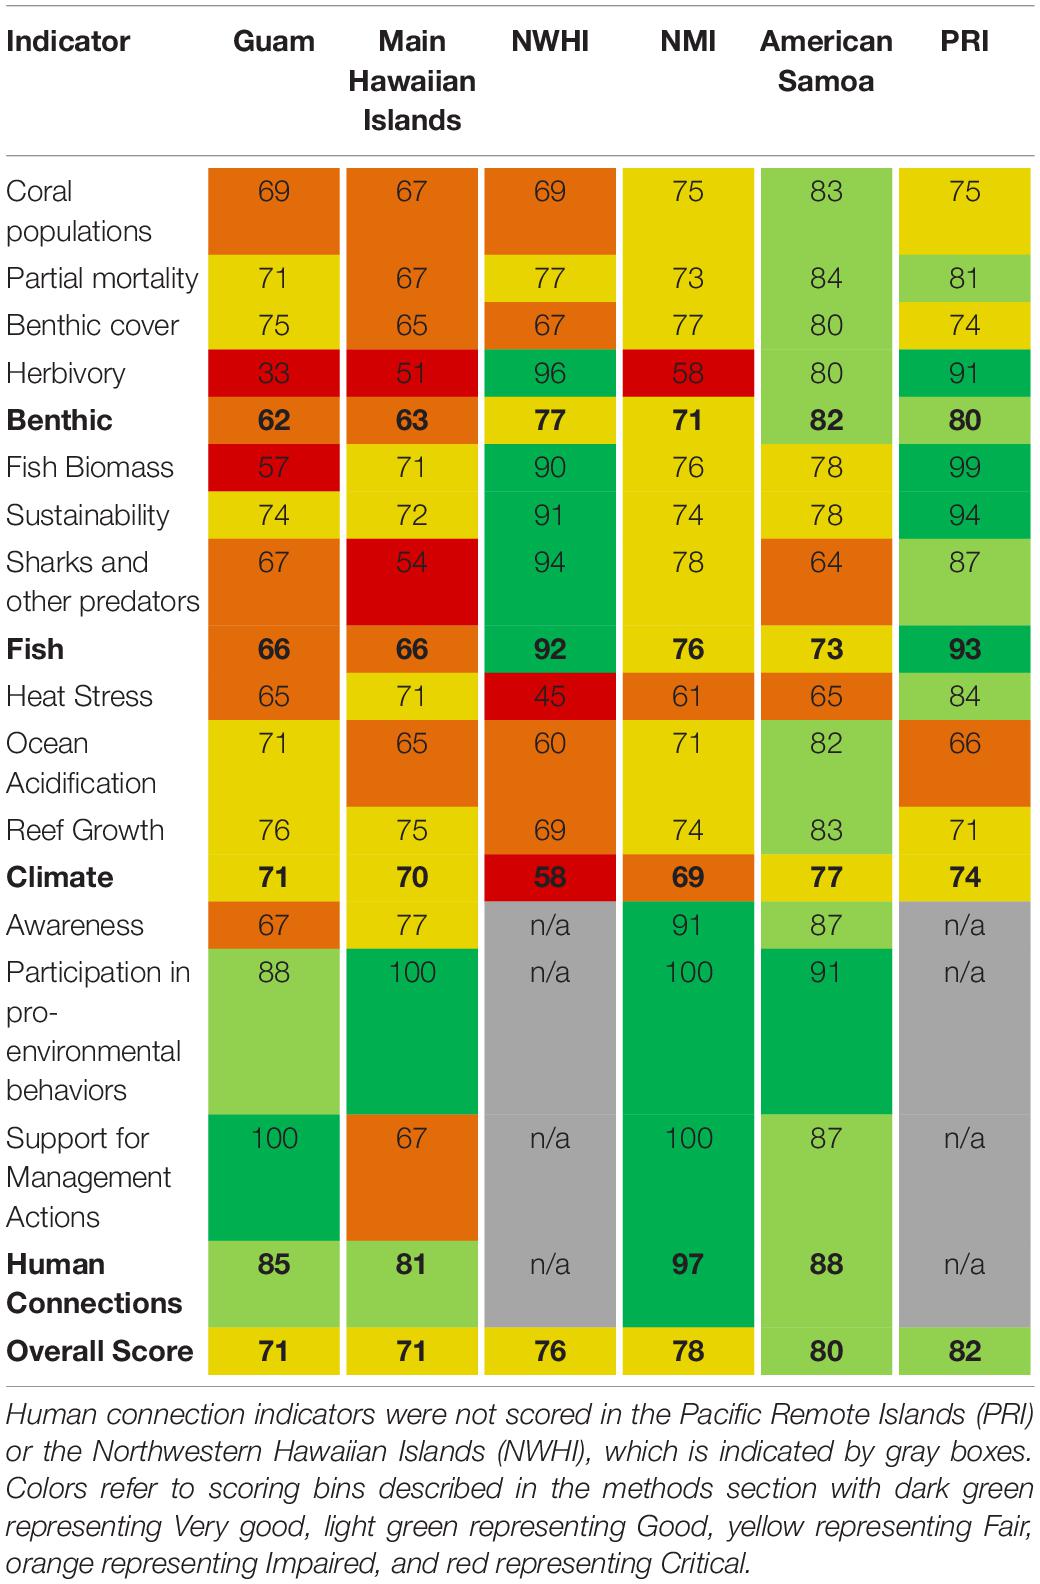
Table 9. Scoring results for all six Pacific jurisdictions for all indicators in all four themes.
Combined Pacific Territories
The United States Pacific coral reefs combined received a score of 74% (Table 10), which is assessed as Fair.
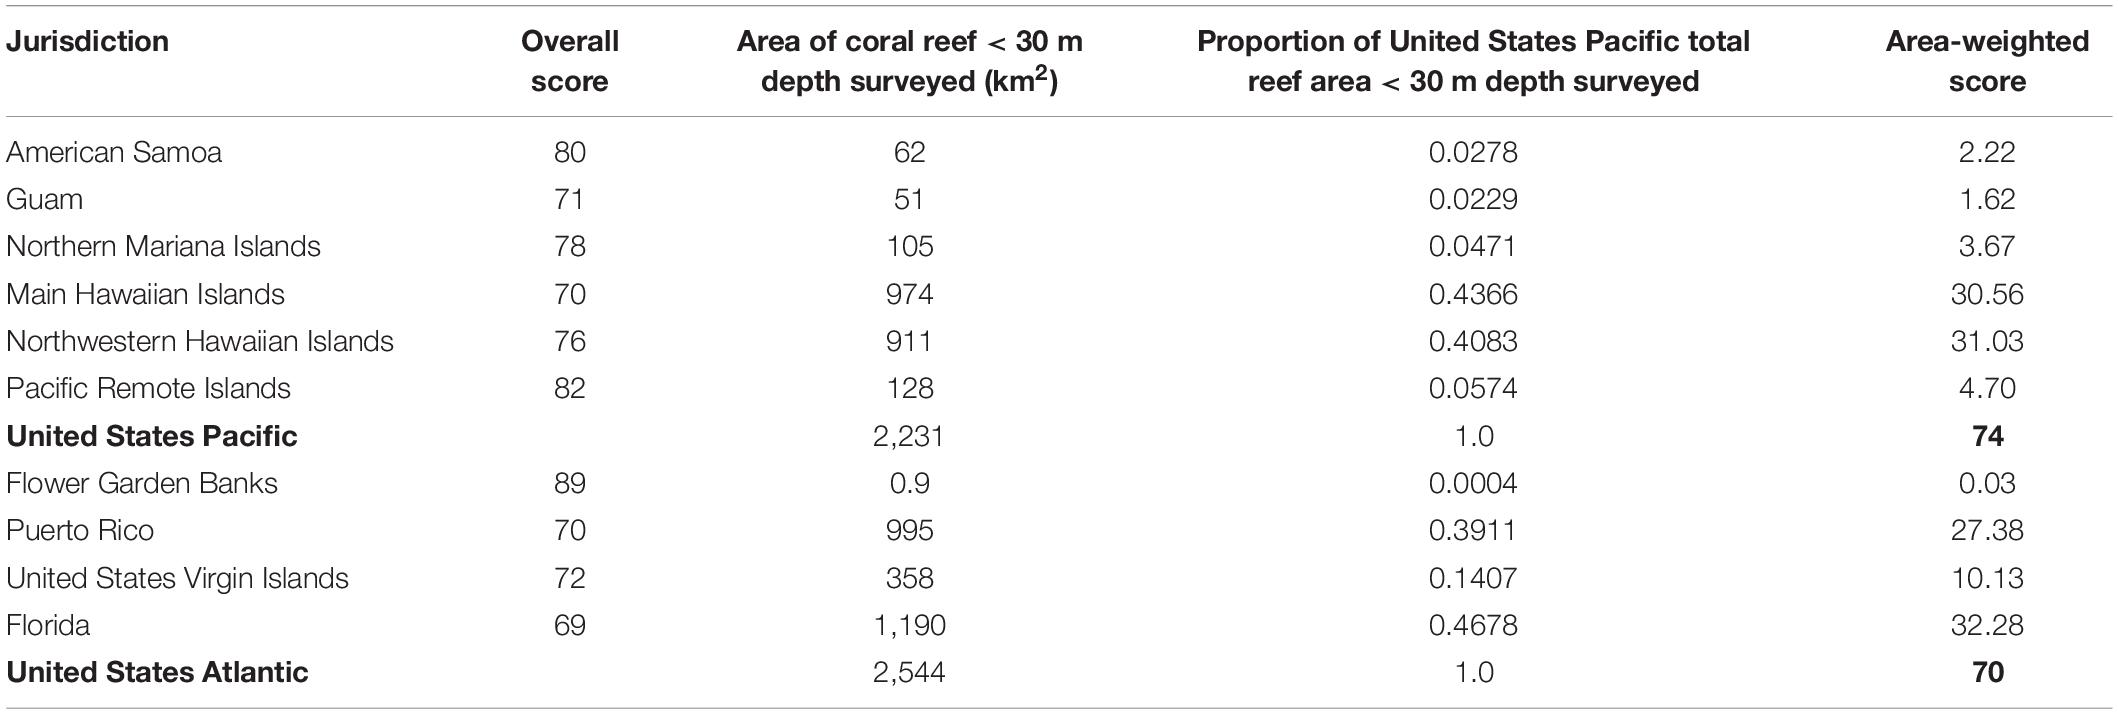
Table 10. Calculation of overall Pacific and Atlantic basin scores based on area surveyed and proportion of total ocean basin area surveyed.
Atlantic Jurisdictions
Overall ecosystem scores ranged from Good (Flower Garden Banks, 89%) to Fair [Puerto Rico (70%) and USVI (72%)] to Impaired [Florida (69%)] (Table 11). The overall Corals and Algae scores were Fair for Florida (70%), Puerto Rico (73%), and USVI (75%); however, it should be noted that the reporting period for the Atlantic jurisdictions was 2014–2018. This means the Corals and Algae scores were not inclusive of data on the appearance of Stony Coral Tissue Loss Disease (SCTLD) in the United States Virgin Islands and Puerto Rico in 2019, nor the continued southward progression of SCTLD in the Florida Reef Tract from 2018 onward. The Corals and Algae score in the Flower Garden Banks was Very good (93%), as was the reef material growth indicator score (97%) (Table 11). With the exception of the Flower Garden Banks, the fish sustainability indicator scores were Impaired (Puerto Rico) or Critical (Florida and USVI). The overall Climate score was Good in the Flower Garden Banks (88%), Fair in Puerto Rico (75%) and USVI (79%), and Impaired in Florida (68%) (Table 11). Human connections were impaired in Florida and the USVI.
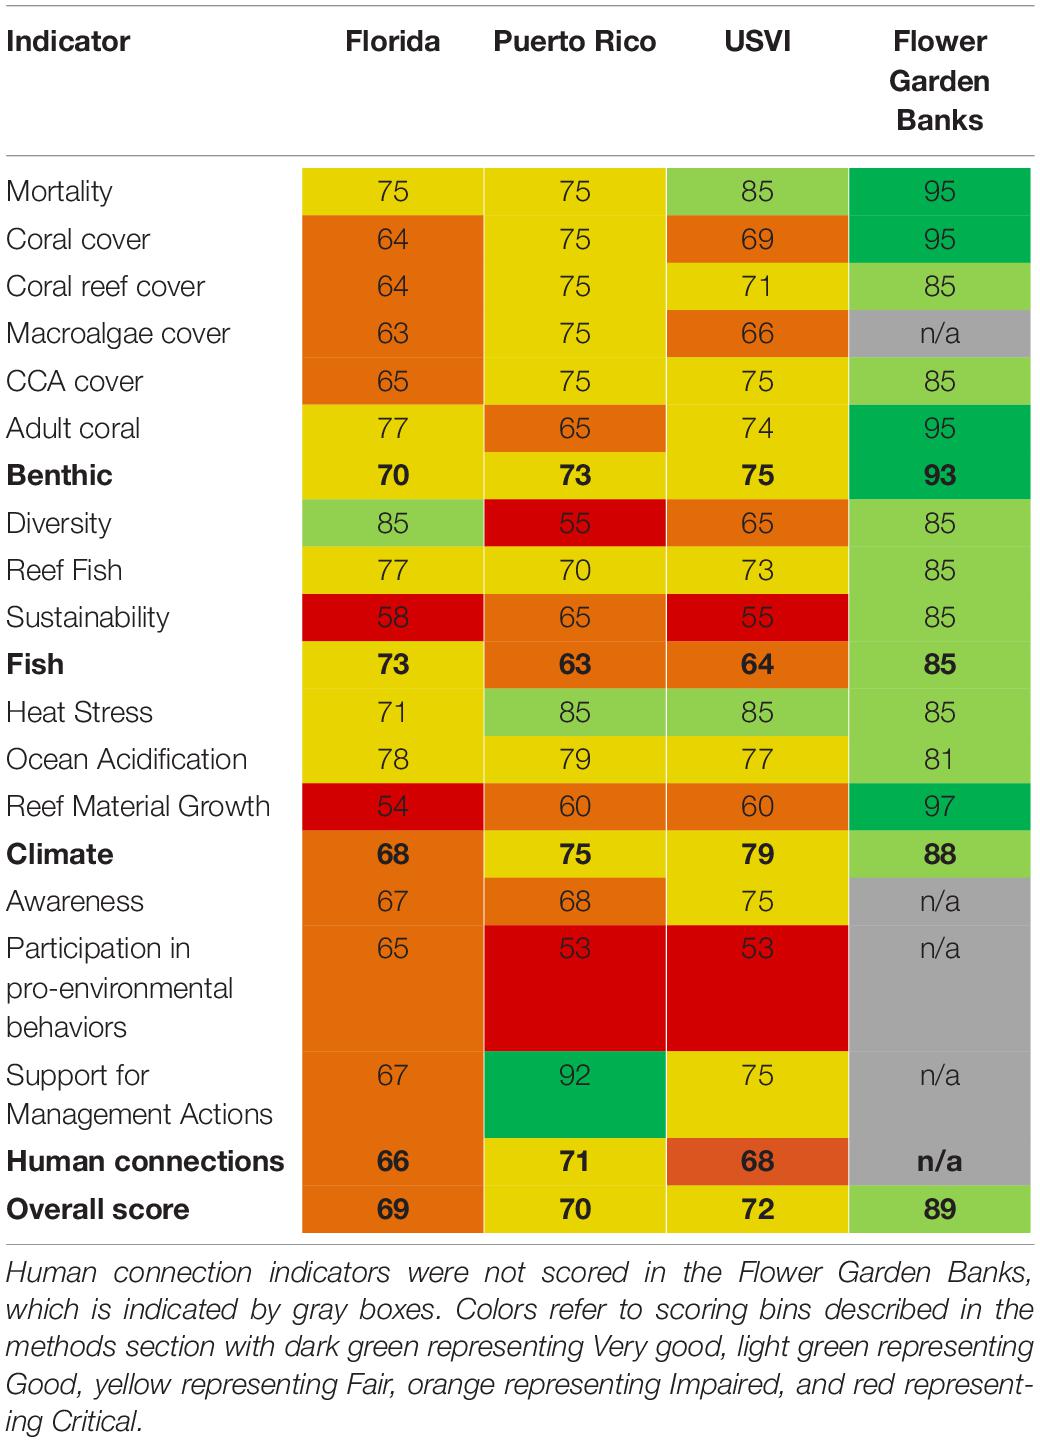
Table 11. Scoring results for all four Atlantic jurisdictions for all indicators in all four themes.
Combined Atlantic Territories
The United States Atlantic coral reefs combined received a score of 70% (Table 10), which is qualified as Fair, but on the cusp of Impaired.
Discussion
Data from Pacific and Atlantic coral reef ecosystem monitoring analyzed in these status reports confirm at a national level what numerous studies have shown at more regional and local levels: that the overall condition of most United States coral reefs has declined moderately to considerably relative to reference conditions. Five of the nine United States jurisdictions received Fair scores, and four of those had scores that were close to Impaired (Main Hawaiian Islands, Guam, United States Virgin Islands, and Puerto Rico). One jurisdiction already received an Impaired score (Florida). Climate change currently poses the greatest threat to coral reefs worldwide as a result of warming ocean temperatures and ocean acidification (Cornwall et al., 2021). Global climate change models (IPCC, 2014; Zhou et al., 2021) predict 1–3°C of sea surface temperature warming which will continue to lead to mass bleaching events and associated coral mortality. Additionally, as heat stress events occur more frequently in the coming years and decades, rates of disturbance may soon outpace the capacity of coral reef communities to recover altogether, and may cause the reefs currently assessed as Fair to become Impaired over the next decade, and those assessed as Impaired to become Critical. Heat stress indicator scores were already Impaired or Critical in American Samoa, Guam, the Northern Mariana Islands, and the Northwestern Hawaiian Islands, driven by severe back-to-back bleaching events that occurred in Guam and the Northern Mariana Islands in 2013–2014 and American Samoa and the Northwestern Hawaiian Islands in 2014 and 2015 (Eakin et al., 2016, 2017; Devotta et al., 2019). Maximum DHW levels in Guam reached 12.15 C-weeks in 2013 and 8.74 C-weeks in 2014. In the Northern Mariana Islands, DHWs reached 10.25 in 2013 and 15.09 in 2014. In the Northwestern Hawaiian Islands a maximum DHW of 16.38 was reached in 2014. In American Samoa, DHWs reached 4.15 and 10.88 in 2013 and 2014, respectively. In addition to heat stress, ocean acidification will stress the ability of hard corals to continue to grow reef structures at their current accretion rates. In Florida, the reef material growth indicator score was Critical, indicating many reefs are already net erosional, i.e., erosion is higher than accretion (Enochs et al., 2015). These factors will likely exacerbate coral cover losses into the future. Given that these analyses used data from 2012 to 2018, the assumption is these scores are likely higher than the true status of United States coral reefs given probable declines between 2018 and present-day. Additionally, scores presented in this analysis for the Atlantic and Caribbean jurisdictions are almost certainly higher than their true status due to the continued southward progression (Florida) and emergence (Puerto Rico and the United States Virgin Islands) of the novel Stony Coral Tissue Loss Disease (SCTLD) (Walton et al., 2018; Brandt et al., 2021) between 2018 and present-day.
While declines in reef health are a global phenomenon, there is wide variability in current coral reef conditions (Hoegh-Guldberg et al., 2017). The analyses presented here suggest that reefs in the United States Pacific are generally in better overall condition than reefs in the United States Atlantic, which is consistent with meta-analyses on coral reef health and status (Eakin et al., 2010; Perry et al., 2013, 2018); however, the Flower Garden Banks in the northern Gulf of Mexico received the highest overall score (89%, Good) of any United States coral reef jurisdiction in this assessment. Their remote location and lack of land-based sources of pollution (e.g., nutrient inputs, sediment runoff, stormwater, development) have been cited as factors that have allowed the Flower Garden Banks to retain high coral cover (Gittings, 1998), which has remained at or above 50% since long-term monitoring began in the 1980s (Johnston et al., 2017). However, remoteness alone is likely not the reason the Flower Garden Banks received a high score given the extreme remoteness of Pacific jurisdictions like the Northwestern Hawaiian Islands (NWHI) or the Pacific Remote Islands (PRI). Greater depths have been cited as a key factor in historically buffering the Flower Garden Banks from extreme temperature events, salinity fluctuations, storm damage, and bleaching (Aronson et al., 2005) as the coral reefs of the Flower Garden Banks generally do not occur shallower than 20 m. Indeed, data show bleaching has been relatively low at the Flower Garden Banks until 2016 (Johnston et al., 2019). The lack of severe bleaching events at the Flower Garden Banks during the reporting period (2014–2018) was likely part of the reason the Flower Garden Banks scored highly in this assessment compared to more remote places. This is evidenced in the analysis by the Flower Garden Banks overall Climate score of 88%, while the NWHI and PRI had overall Climate scores of 58 and 74%, respectively. Of particular interest pertaining to the Flower Garden Banks Climate score is a recent study by Manzello et al. (2021) which examined coral core data from two of the most common reef-building hard coral species (Orbicella faveolata and Pseudodiploria strigosa) in the Flower Garden Banks and found that calcification rates have increased significantly over the past 45 years. Similarly, the analysis from the present paper showed Flower Garden Banks’ reef material growth score of 97% (Very good), which was the highest reef material growth score of any United States coral reef area. The lack of severe bleaching events during the Atlantic reporting period in the Flower Garden Banks, as well as consistently high accretion rates, may account for why the overall score of Flower Garden Banks was elevated compared to more remote jurisdictions in the Pacific that experienced severe bleaching events during the reporting period.
In this assessment, the Fish theme analyses particularly highlight the variability between uninhabited and populated areas. Fish scores across all United States coral reefs ranged from Impaired to Very good, but Good and Very good scores only occurred at remote reef areas with few to no inhabitants, i.e., the PRI (93%), the NWHI (92%), and the Flower Garden Banks (85%) (Tables 9, 11). In contrast, impaired scores occurred in populated reef areas, i.e., Guam (66%), the Main Hawaiian Islands (66%), Puerto Rico (63%), and the USVI (64%) (Tables 9, 11). The clear divide in Fish theme scores between uninhabited and populated reefs in both basins suggests that remoteness is key to maintaining healthy reef fish populations that have not declined or have only slightly declined with respect to their historical baselines. In contrast to uninhabited reefs, coral reef fishes on populated reefs can regularly be targeted by commercial, recreational, and even small-scale artisanal fisheries due to their close proximity to shore in known locations and higher relief habitats that can easily be located using modern fishing technology (Friedlander and DeMartini, 2002; Ault et al., 2005; Kadison et al., 2017). This easy accessibility coupled with common life history characteristics that include slow growth, late age-at-maturity, and intermittent recruitment and reproduction (i.e., annual spawning aggregations) make larger reef fishes, such as snappers and groupers, particularly susceptible to overexploitation (e.g., Jennings et al., 1998; DeMartini et al., 2008). Furthermore, on reefs near populated areas, growing human populations and tourism have led to increases in fishing pressure, coastal development, and deteriorating water and habitat quality (Ault et al., 2005; Stallings, 2009; Brewer et al., 2013) highlighting the importance of understanding how human connections to coral reefs drive the patterns of ecosystem condition the biological data show.
This assessment is unique compared to other coral reef ecosystem analyses in that it included human connections data. Integration of social science with biological and physical science has long been, and continues to be, a challenge. NCRMP is the first effort to holistically monitor both biophysical and social conditions of all United States coral reefs (Allen et al., 2021). Social science studies have been conducted in many coral reef management areas, but these typically address unique research questions, target specific user groups, and often lack the resources or intent to be systematically repeated through time (e.g., Weijerman et al., 2016; Agar et al., 2019; Oleson et al., 2020; Wongbusarakum et al., 2021). Since human elements are an integral part of overall ecosystem health and conservation of vulnerable ecosystems like coral reefs, human connections were included in this analysis as an integral scoring component for the populated jurisdictions. This integration posed several challenges. First, there is no objective baseline for people’s beliefs and behaviors pertaining to coral reefs. Additionally, determining directional scores for many of the indicators was challenging given complex interactions between social and ecological systems and the need to place a value judgment to define “desirable” targets for behavior. Likewise, weighting the value of social versus ecological variables in the final scoring metric presented questions of which factors are most important in determining overall ecosystem health.
Engaging with local partners to determine threshold goals within each jurisdiction for each social science metric helped to advance a shared understanding and vision of human connection indicators. However, not all socioeconomic indicators within the NCRMP dataset were utilized in this assessment because a desired direction for scoring was not always possible. The authors chose to omit some descriptive indicators of human behavior such as “participation in reef activities” given the need for monodirectional indicators (Hinkel, 2011), and the difficulty of classifying whether an increase in certain behaviors, such as snorkeling, scuba diving, beach recreation, or fishing is better or worse for the linked social-ecological system. While it is important to understand participation rates in these activities, more or less participation does not necessarily mean positive or negative outcomes for a coral reef ecosystem. For example, high participation in fishing may be detrimental to fish populations (negative directionality) but could also result in higher awareness of threats to coral reefs, higher belief in the economic and cultural significance of coral reefs, or increased support for management policies that protect coral reefs (positive directionality). Future work should focus on improving our understanding of the desired directionality of socioeconomic indicators, as well as refining socioeconomic input data as they become available for more targeted indicators. Methods for integrating socioeconomic data with biophysical data to support a better understanding of complex dynamics in coral reef ecosystems will also support informed conservation and management activities.
Another important direction for future work will be inclusion of an indicator for the biodiversity of coral reef communities which was unscored in this assessment despite consensus that it was an important indicator. High biodiversity of reef-building corals and associated communities has been shown to increase resilience to environmental impacts (Hughes et al., 2005). Although NCRMP has the data needed to calculate indices of coral reef biodiversity, the authors were not able to identify and agree upon appropriate and defensible baselines for coral reef biodiversity for each jurisdiction. Biodiversity is often variable between regions and even within reef habitat strata. Although higher biodiversity is generally, but not universally, considered beneficial, it is difficult to identify what specific value of a biodiversity index is representative of a desired condition in any one place. Also, it may be normal and desirable for a reef or portion of a reef to have low biodiversity, i.e., mono-specific stands of a reef-building species. More work is needed to determine how this scoring could be incorporated into future coral reef status reports.
The data presented here represent an unprecedented scale of analysis, using largely compatible data collection techniques across the Pacific and Atlantic Oceans, the Caribbean Sea, and the Gulf of Mexico. The authors are not aware of any other United States or international program that collects data in a consistent, standardized manner across such a large geographic area, and analyzes the data in ways that allow integration of interdisciplinary results at a national scale. Although numerous studies have shown the impact of human activities and climate change on coral reef ecosystems, the consistency of data collection and analysis in this effort enabled evaluation of patterns that emerged at national, regional, and jurisdictional scales, providing clear evidence of the impacts of human activities and climate change on United States coral reef ecosystems. The NCRMP sampling design, data collection methodology, data analytical approaches, and investment in stakeholder engagement may be considered a model for other coral reef monitoring programs, and represents a valuable resource for evaluating national-scale patterns in coral reef ecosystem status. Coordinating the input of many diverse stakeholders is not trivial, and likely part of the reason why an assessment at this scale and in this format has not previously been achieved. This work included novel scoring approaches that standardized results to enable integration of scores across indicators and themes which could then be combined to create a composite measure of coral reef ecosystem status. The value of these scores at both the indicator, theme, and composite levels is in their ability to quickly communicate ecosystem status to a wide variety of audiences who may prefer to see a score rather than read a traditional scientific report format. This scoring framework is especially valuable when communicating the status of coral reefs to policy makers and the general public. For example, the status reports were referenced directly by a member of Congress during a hearing in the United States House Natural Resources Committee in May 2021. This demonstrates the value, utility, and power of this medium, especially given the urgency with which conservation efforts are needed. Presenting these results in a report-card style could provide a useful mechanism to garner support for management actions such as expanding protected areas; enforcing existing regulations; increasing climate change education, outreach, and action; implementing practices to reduce land-based sources of pollution; and other actions that will improve the trajectory of coral reef ecosystem conditions.
Data Availability Statement
The original contributions presented in the study are included in the article/Supplementary Material, further inquiries can be directed to the corresponding author/s.
Ethics Statement
The studies involving human participants were reviewed and approved by United States Office of Management and Budget. The patients/participants provided their written informed consent to participate in this study.
Author Contributions
ET, ED, and HK conceptualized this manuscript. The remaining authors contributed to data analyses, writing, and editing. All authors contributed to the article and approved the submitted version.
Funding
The National Coral Reef Monitoring Program is funded by NOAA’s Coral Reef Conservation Program, project #743. The authors thank the National Fish and Wildlife Foundation for supporting this project via grant number 0302.18.061013.
Author Disclaimer
The views and conclusions contained in this document are those of the authors and should not be interpreted as representing the opinions or policies of the United States Government or the National Fish and Wildlife Foundation and its funding sources. Mention of trade names or commercial products does not constitute their endorsement by the United States Government, or the National Fish andWildlife Foundation or its funding sources.
Conflict of Interest
ET and MA were employed by the company Lynker, Inc. KE, CF, and SG were employed by the company CSS, Inc.
The remaining authors declare that the research was conducted in the absence of any commercial or financial relationships that could be construed as a potential conflict of interest.
Publisher’s Note
All claims expressed in this article are solely those of the authors and do not necessarily represent those of their affiliated organizations, or those of the publisher, the editors and the reviewers. Any product that may be evaluated in this article, or claim that may be made by its manufacturer, is not guaranteed or endorsed by the publisher.
Acknowledgments
This 6-year body of work would not have been possible without the expert input of countless partners in each of the United States coral reef jurisdictions. We thank all of the participants from all of the workshops from state and territorial governments, academia, non-governmental organizations, and more.
Supplementary Material
The Supplementary Material for this article can be found online at: https://www.frontiersin.org/articles/10.3389/fmars.2021.812216/full#supplementary-material
Footnotes
- ^ Agreement with various MPA functions was not collected in the Main Hawaiian Islands, and is therefore omitted from that jurisdiction’s scoring.
- ^ Florida’s Support indicator omitted agreement with various MPA functions, as this information wasn’t collected in the 2014 Florida survey. The 2014 Florida survey did not ask about familiarity with marine protected areas. Instead, this metric uses familiarity with jurisdictional coral reef management organizations.
References
Agar, J., Shivlani, M., Fleming, C., and Solís, D. (2019). Small-scale fishers’ perceptions about the performance of seasonal closures in the commonwealth of Puerto Rico. Ocean Coast. Manag. 175, 33–42. doi: 10.1016/j.ocecoaman.2019.03.025
Allen, M. E., Fleming, C. S., Gonyo, S. B., Towle, E. K., Dillard, M. K., Levine, A., et al. (2021). Resident perceptions of ecosystem services provided by U.S. coral reefs: highlights from the first cycle of the National Coral Reef Monitoring Program’s Socioeconomic Survey. Water 13:2081. doi: 10.3390/w13152081
Aronson, R. B., Precht, W. F., Murdoch, T. J. T., and Robbart, M. L. (2005). Long-term persistence of coral assemblages on the Flower Garden Banks, Northwestern Gulf of Mexico: implications for science and management. Gulf M. Sci. 23, 84–94. doi: 10.18785/goms.2301.06
Ault, J. S., Bohnsack, J. A., Smith, S. G., and Luo, J. (2005). Towards sustainable multispecies fisheries in the Florida, USA, coral reef ecosystem. Bull. Mar. Sci. 76, 595–622. doi: 10.1016/j.ecolind.2014.04.013
Ault, J. S., Smith, S. G., Browder, J. A., Nuttle, W., Franklin, E. C., Luo, J., et al. (2014). Indicators for assessing the ecological dynamics and sustainability of southern Florida’s coral reef and coastal fisheries. Ecol. Indic. 44, 164–172.
Bennett, N. J., Roth, R., Klain, S. C., Chan, K., Christie, P., Clark, D. A., et al. (2017). Conservation social science: understanding and integrating human dimensions to improve conservation. Biol. Conserv. 205, 93–108. doi: 10.1016/j.biocon.2016.10.006
Bennett, N. J., and Dearden, P. (2014). From measuring outcomes to providing inputs: governance, management, and local development for more effective marine protected areas. Mar. Policy 50, 96–110. doi: 10.1016/j.marpol.2014.05.005
Binohlan, C., and Froese, R. (2009). Empirical equations for estimating maximum length from length at first maturity. J. Appl. Ichthyol. 25, 611–613. doi: 10.1111/j.1439-0426.2009.01317.x
Boyle, S., De Anda, V., Koenig, K., O’Reilly, E., Schafer, M., Acoba, T., et al. (2017). Coral Reef Ecosystems of the Pacific Remote Islands Marine National Monument: A 2000–2016 Overview. NOAA PIFSC Special Publication, SP-17-003. Silver Spring, MD: National Marine Fisheries Service, 62.
Brainard, R. E., Acoba, T., Asher, M. A. M., Asher, J. M., Ayotte, P. M., Barkley, H. C., et al. (2019). “Chapter 9: Pacific remote islands marine national monument in the Pacific-wide context,” in Coral Reef Ecosystem Monitoring Report for the Pacific Remote Islands Marine National Monument 2000–2017 (Honolulu HI: Pacific Islands Fisheries Science Center, PIFSC Special Publication, SP-19-006i), 72. doi: 10.25923/rwd2-2118
Brainard, R. E., Asher, J., Blyth-Skyrme, V., Coccagna, E. F., Dennis, K., Donovan, M. K., et al. (2012). Coral Reef Ecosystem Monitoring Report for the Mariana Archipelago: 2003 – 2007, NOAA Fisheries, Pacific Islands Fisheries Science Center, PIFSC Special Publication, SP-12-01. Silver Spring, MD: National Marine Fisheries Service, 1019.
Brainard, R. E., Asher, J., Gove, J., Helyer, J., Kenyon, J., Mancini, F., et al. (2008). Coral Reef Ecosystem Monitoring Report for American Samoa: 2002 – 2006, NOAA Special Report NMFS PIFSC. Honolulu, HI: NOAA, 510.
Brainard, R. E., Birkeland, C., Eakin, C. M., McElhany, P., Miller, M. W., Patterson, M., et al. (2011). Status Review Report of 82 Candidate Coral Species Petitioned Under the U.S. Endangered Species Act. U.S. Dep. Commer., NOAA Tech. Memo., NOAA-TM-NMFS-PIFSC-27. + 1 Appendix. Silver Spring, MD: National Marine Fisheries Service, 530.
Brandt, M. E., Ennis, R. S., Meiling, S. S., Townsend, J., Cobleigh, K., Glahn, A., et al. (2021). The emergence and initial impact of stony coral tissue loss disease (SCTLD) in the United States Virgin Islands. Front. Mar. Sci. 8:715329. doi: 10.3389/fmars.2021.715329
Brewer, T. D., Cinner, J. E., Green, A., and Pressey, R. L. (2013). Effects of human population density and proximity to markets on coral reef fishes vulnerable to extinction by fishing. Conserv. Biol. 27, 443–452. doi: 10.1111/j.1523-1739.2012.01963.x
Cornwall, C. E., Comeau, S., Kornder, N. K., Perry, C. T., van Hooidonk, R., DeCarlo, T. M., et al. (2021). Global declines in coral reef calcium carbonate production under ocean acidification and warming. Proc. Natl. Acad. Sci. U.S.A. 118:e2015265118. doi: 10.1073/pnas.2015265118
Couch, C. S., Oliver, T. A., Suka, R., Lamirand, M., Asbury, M., Amir, C., et al. (2021). Comparing coral colony surveys from in-water observations and structure-from-motion imagery shows low methodological bias. Front. Mar. Sci. 8:647943. doi: 10.3389/fmars.2021.647943
DeMartini, E. E., Friedlander, A. M., Sandin, S. A., and Sala, E. (2008). Differences in fish-assemblage structure between fished and unfished atolls in the northern Line Islands, central Pacific. Mar. Ecol. Prog. Ser. 365, 199–215. doi: 10.3354/meps07501
Devotta, D. A., De La Cour, J. L., Geiger, E. F., Gomez, A. M., Heron, S. F., Liu, G., et al. (2019). “Overview of the third global coral bleaching event (2014-2017),” in Status of Coral Reefs in East Asian Seas Region: 2018, eds T. Kimura, K. Tun, and L. M. Chou (Tokyo: Ministry of the Environment of Japan and Japan Wildlife Research Center), 3–10.
Dickson, A. G. Sabine, C. L. and Christian, J.R. (eds.) (2007). Guide to Best Practices for Ocean CO2 Measurement. (PICES Special Publication 3; IOCCP Report 8). Sidney, BC: North Pacific Marine Science Organization, 191. doi: 10.25607/OBP-1342
Donovan, C., Kimball, J., Swanson, D., Couch, C., Vargas-Angel, B., Williams, I., et al. (2018). 2018 Status Report Scoring Methodology for Pacific Jurisdictions. Washington, DC: National Oceanic and Atmospheric Administration and the University of Maryland Center for Environmental Science.
Donovan, C., Towle, E. K., Blondeau, J., Eakin, C. M., Edwards, K., Edwards, P., et al. (2020). 2020 Status Report Scoring Methodology for Atlantic Jurisdictions: Indicator Calculations and Scoring for Coral Reef Status Reports of the Atlantic Jurisdictions: Flower Garden Banks, the United States Virgin Islands, Puerto Rico, and Florida’s Coral Reef. Washington, DC: National Oceanic and Atmospheric Administration and the University of Maryland Center for Environmental Science. doi: 10.25923/xagj-1854
Donovan, C., and Towle, E. K. (2020). 2020 National Status Report Scoring Methodology, Basin-Wide and Theme Calculations and Scoring for the National Coral Reef Status Report. Washington, DC: National Oceanic and Atmospheric Administration and the University of Maryland Center for Environmental Science. doi: 10.25923/ds68-dp59
Eakin, C. M., Liu, G., Gomez, A. M., De La Cour, J. L., Heron, S. F., Skirving, W. J., et al. (2017). Ding, Dong, the witch is dead (?) – three years of global coral bleaching 2014-2017. Reef Encount. 32, 33–38.
Eakin, C. M., Liu, G., Gomez, A. M., De La Cour, J. L., Heron, S. F., Skirving, W. J., et al. (2016). Global coral bleaching 2014-2017: status and an appeal for observations. Reef Encount. 31, 20–26.
Eakin, C. M., Morgan, J. A., Heron, S. F., Smith, T. B., Liu, G., Alvarez-Filip, L., et al. (2010). Caribbean corals in crisis: record thermal stress, bleaching, and mortality in 2005. PLoS One 5:e13969. doi: 10.1371/journal.pone.0013969
Enochs, I. C., Manzello, D. P., Jones, P. R., Stamates, S. J., and Carsey, T. P. (2019). Seasonal carbonate chemistry dynamics on southeast Florida coral reefs: localized acidification hotspots from navigational inlets. Front. Mar. Sci. 6:160. doi: 10.3389/fmars.2019.00160
Enochs, I. C., Manzello, D. P., Carlton, R. D., Graham, D. M., Ruzicka, R., and Colella, M. A. (2015). Ocean acidification enhances the bioerosion of a common coral reef sponge: implications for the persistence of the Florida Reef Tract. Bull. Mar. Sci. 91, 271–290. doi: 10.5343/bms.2014.1045
Florida Fish and Wildlife Conservation Commission (2018). National Oceanic and Atmospheric Administration’s (NOAA) Florida Reef Resilience Program’s Disturbance Response Monitoring (2018). 2005-2018. Unpublished data. Coral Reef Conservation Program cooperative agreement award #NA16NOS4820106. Tallahassee, FL: Florida Fish and Wildlife Conservation Commission.
Friedlander, A. M., and DeMartini, E. E. (2002). Contrasts in density, size, and biomass of reef fishes between the northwestern and the main Hawaiian Islands: the effects of fishing down apex predators. Mar. Ecol. Prog. Ser. 230, 253–264.
Gilliam, D. S., Walton, C. J., Hayes, N. K., Ruzicka, R., Colella, M., and Brinkhuis, V. (2017). Southeast Florida Coral Reef Evaluation and Monitoring Project 2016 Year 14 Final Report. Florida DEP Report #RM143. Miami Beach, FL: Florida DEP, 66.
Gittings, S. R. (1998). Reef community stability on the flower garden banks, Northwest Gulf of Mexico. Gulf M. Sci. 16, 161–169. doi: 10.18785/goms.1602.05
Gorstein, M., Loerzel, J., Edwards, P., Levine, A., and Dillard, M. (2019b). National Coral Reef Monitoring Program Socioeconomic Monitoring Component: Summary Findings for CNMI, 2016. US Dep. Commerce, NOAA Tech. Memo., NOAA-TM-NOS-CRCP-34, + Appendices. Silver Spring, MD: National Marine Fisheries Service, 69.
Gorstein, M., Loerzel, J., Edwards, P., and Levine, A. (2019a). National Coral Reef Monitoring Program Socioeconomic Monitoring Component: Summary Findings for USVI, 2017. US Dep. Commerce, NOAA Tech. Memo., NOAA-TM-NOS-CRCP-35, + Appendices. Silver Spring, MD: National Marine Fisheries Service, 72.
Gorstein, M., Loerzel, J., Levine, A., Edwards, P., and Dillard, M. (2018a). National Coral Reef Monitoring Program Socioeconomic Monitoring Component: Summary Findings for Guam, 2016. US Dep. Commerce, NOAA Tech. Memo., NOAA-TM-NOS-CRCP-32, + Appendices. Silver Spring, MD: National Marine Fisheries Service, 64. doi: 10.25923/kpvd-mj07
Gorstein, M., Loerzel, J., Levine, A., Edwards, P., and Dillard, M. (2018b). National Coral Reef Monitoring Program Socioeconomic Monitoring Component: Summary Findings for Hawai’i, 2015. US Dep. Commerce, NOAA Tech. Memo., NOAA-TM-NOS-CRCP-30, + Appendices. Silver Spring, MD: National Marine Fisheries Service, 69.
Gorstein, M., Loerzel, J., Edwards, P., Levine, A., and Dillard, M. (2017). National Coral Reef Monitoring Program Socioeconomic Monitoring Component: Summary Findings for Puerto Rico, 2015. US Dep. Commerce, NOAA Tech. Memo., NOAA-TM-NOS-CRCP-28, + Appendices. Silver Spring, MD: National Marine Fisheries Service, 64. doi: 10.7289/V5BP00V9
Gorstein, M., Dillard, M., Loerzel, J., Edwards, P., and Levine, A. (2016). National Coral Reef Monitoring Program Socioeconomic Monitoring Component: Summary Findings for South Florida, 2014. US Dep. Commerce, NOAA Tech. Memo., NOAA-TM-NOS-CRCP-25, + Appendices. Silver Spring, MD: National Marine Fisheries Service, 57.
Groves, S. (2019). NCRMP.Benthics.Statusreport: Calculates and Compiles the 2020 Atlantic NCRMP Status Report Benthic Indicator Scores. R Package Version 1.0.0.001. Available online at: https://github.com/shgroves/NCRMP.benthics.statusreport (accessed November 9, 2021).
Hak, T. Moldan, B. and Dahl A. (eds.) (2007). Sustainability Indicators: A Scientific Assessment. SCOPE, Vol. 67. Washington, DC: Island Press.
Heenan, A., Williams, I. D., Acoba, T., DesRochers, A., Kosaki, R. K., Kanemura, T., et al. (2017). Long-term monitoring of coral reef fish assemblages in the Western central pacific. Sci. Data 4:170176. doi: 10.1038/sdata.2017.176
Hinkel, J. (2011). Indicators of vulnerability and adaptive capacity: towards a clarification of the science–policy interface. Glob. Environ. Change 21, 198–208. doi: 10.1016/j.gloenvcha.2010.08.002
Hoegh-Guldberg, O., Poloczanska, E. S., Skirving, W., and Dove, S. (2017). Coral reef ecosystems under climate change and ocean acidification. Front. Mar. Sci. 4:158. doi: 10.3389/fmars.2017.00158
Hubbard, D. K. (2009). Depth-related and species-related patterns of Holocene reef accretion in the Caribbean and western Atlantic: a critical assessment of existing models. Int. Assoc. Sedimentol. Spec. Publ. 41, 1–18. doi: 10.1002/9781444312065.ch1
Hughes, T. P., Bellwood, D. R., Folke, C., Steneck, R. S., and Wilson, J. (2005). New paradigms for supporting the resilience of marine ecosystems. Trends Ecol. Evol. 20, 380–386. doi: 10.1016/j.tree.2005.03.022
IPCC (2014). Climate Change 2014: Synthesis Report. Contribution of Working Groups I, II and III to the Fifth Assessment Report of the Intergovernmental Panel on Climate Change, eds Core Writing Team Pachauri, R. K., and Meyer, L. A. Geneva: IPCC, 151.
Jennings, S., Reynolds, J. D., and Mills, S. M. (1998). Life history correlates of responses to fisheries exploitation. Proc. R. Soc. 265, 333–339. doi: 10.1098/rspb.1998.0300
Johnston, M. A., Eckert, R. J., Nuttall, M. F., Sterne, T. K., Embesi, J. A., Manzello, D. P., et al. (2017). Long-Term Monitoring at the East and West Flower Garden Banks National Marine Sanctuary, 2013–2015, Technical Report. Gulf of Mexico OCS Study BOEM 2017-058, Vol. 1. New Orleans, LA: US Dept of Interior, Bureau of Ocean Energy Management, 186.
Johnston, M. A., Sterne, T. K., Blakeway, R. D., MacMillan, J., Nuttall, M. F., Hu, X., et al. (2018). Long-Term Monitoring at East and West Flower Garden Banks: 2017 Annual Report. Marine Sanctuaries Conservation Series ONMS-18-02. U.S. Department of Commerce. Galveston, TX: National Oceanic and Atmospheric Administration, Flower Garden Banks National Marine Sanctuary, 124.
Johnston, M. A., Hickerson, E. L., Nuttall, M. F., Blakeway, R. D., Sterne, T. K., Eckert, R. J., et al. (2019). Coral bleaching and recovery from 2016 to 2017 at east and west Flower Garden Banks, Gulf of Mexico. Coral Reefs 38, 787–799. doi: 10.1007/s00338-019-01788-7
Kadison, E., Brandt, M., Nemeth, R., Martens, J., Blondeau, J., and Smith, T. (2017). Abundance of commercially important reef fish indicates different levels of over-exploitation across shelves of the U.S. Virgin Islands. PLoS One 12:e0180063. doi: 10.1371/journal.pone.0180063
Levine, A., Dillard, M., Loerzel, J., and Edwards, P. (2016). National Coral Reef Monitoring Program Socioeconomic Monitoring Component. Summary Findings for American Samoa, 2014. NOAA Technical Memorandum CRCP 24. Silver Spring, MD: NOAA Coral Reef Conservation Program, 80. doi: 10.7289/V5FB50Z1
Liu, G., Skirving, W. J., Geiger, E. F., De La Cour, J. L., Marsh, B. L., Heron, S. F., et al. (2017). NOAA coral reef watch’s 5km satellite coral bleaching heat stress monitoring product suite version 3 and four-month outlook version 4. Reef Encount. 32, 39–45.
Liu, G., Heron, S. F., Eakin, C. M., Muller-Karger, F. E., Vega-Rodriguez, M., Guild, L. S., et al. (2014). Reef-scale thermal stress monitoring of coral ecosystems: new 5-km global products from NOAA coral reef watch. Rem. Sens. 6, 11579–11606. doi: 10.3390/rs61111579
Liu, G., Rauenzahn, J. L., Heron, S. F., Eakin, C. M., Skirving, W. J., Christensen, T. R. L., et al. (2013). NOAA Coral Reef Watch 50 km Satellite Sea Surface Temperature-Based Decision Support System for Coral Bleaching Management. NOAA Technical Report NESDIS 143. College Park, MD: NOAA/NESDIS, 33.
MacNeil, M. A., Graham, N. A. J., Cinner, J. E., Wilson, S. K., Williams, I. D., Maina, J., et al. (2015). Recovery potential of the world’s coral reef fishes. Nature 520, 341–344. doi: 10.1038/nature14358
Manzello, D. P., Kolodziej, G., Kirkland, A., Besemer, N., and Enochs, I. C. (2021). Increasing coral calcification in Orbicella faveolata and Pseudodiploria strigosa at Flower Garden Banks, Gulf of Mexico. Coral Reefs 40, 1097–1111. doi: 10.1007/s00338-021-02108-8
McCoy, K., Asher, J., Ayotte, P., Gray, A., Kindinger, T., and Williams, I. (2019). Reef Fishes and Benthic Habitats of the Main Hawaiian Islands. PIFSC Data Report DR-19-039. Silver Spring, MD: National Centers for Environmental Information. doi: 10.25923/he4m-6n68
Nadon, M. O. (2019). Stock Assessment of Guam Coral Reef Fish, 2019. NOAA Technical Memorandum NMFS-PIFSC-82, 107. Silver Spring, MD: National Marine Fisheries Service, doi: 10.25923/pyd6-7k49
Nadon, M. O. (2017). Stock Assessment of the Coral Reef Fishes of Hawaii, 2016. U.S. Dep. Commer., NOAA Tech. Memo., NOAA-TM-NMFS-PIFSC-60. Silver Spring, MD: National Marine Fisheries Service, 212.
Nadon, M. O., Baum, J. K., Williams, I. D., McPherson, J. M., Zgliczynski, B. J., Richards, B. L., et al. (2012). Re-Creating missing population baselines for pacific reef sharks. Conserv. Biol. 26, 493–503. doi: 10.1111/j.1523-1739.2012.01835.x
National Park Service (2009). Coral Reefs in U.S. National Parks: A Snapshot of Status and Trends in Eight Parks. Natural Resource Report 2009. Fort Collins, CO: National Park Service.
NOAA (2018). US Coral Reef Monitoring Data Summary 2018. NOAA Technical Memorandum CRCP 31. Silver Spring, MD: NOAA Coral Reef Conservation Program, 224.
NOAA Coral Program (2021). National Coral Reef Monitoring Plan. Silver Spring, MD: NOAA Coral Reef Conservation Program. doi: 10.25923/fqkq-w497
Oleson, K. L., Bagstad, K. J., Fezzi, C., Barnes, M. D., Donovan, M. K., Falinski, K. A., et al. (2020). Linking land and sea through an ecological-economic model of coral reef recreation. Ecol. Econ. 177:106788. doi: 10.1016/j.ecolecon.2020.106788
Paruolo, P., Saisana, M., and Saltelli, A. (2013). Rating and rankings: voodoo or science? J. R. Stat. Soc. A 176(Pt. 3), 609–634. doi: 10.1111/j.1467-985X.2012.01059.x
Perry, C. T., Edinger, E. N., Kench, P. S., Murphy, G. N., Smithers, S. G., Steneck, R. S., et al. (2012). Estimating rates of biologically driven coral reef framework production and erosion: a new census-based carbonate budget methodology and applications to the reefs of Bonaire. Coral Reefs 31, 853–868. doi: 10.1007/s00338-012-0901-4
Perry, C. T., Murphy, G. N., Kench, P. S., Smithers, S. G., Edinger, E. N., Steneck, R. S., et al. (2013). Caribbean wide decline in carbonate production threatens coral reef growth. Nat. Commun. 4, 1–7. doi: 10.1038/ncomms2409
Perry, C. T., Alvarez-Filip, L., Graham, N., Mumby, P. J., Wilson, S. K., Kench, P. S., et al. (2018). Loss of coral reef growth capacity to track future increases in sea-level. Nature 558, 396–400. doi: 10.1038/s41586-018-0194-z
Saltelli, A. (2007). Composite indicators between analysis and advocacy. Soc. Indic. Res. 81, 65–77. doi: 10.1007/s11205-006-0024-9
Skirving, W., Marsh, B., De La Cour, J., Liu, G., Harris, A., Maturi, E., et al. (2020). CoralTemp and the coral reef watch coral bleaching heat stress product suite version 3.1. Remote Sens. 12:3856. doi: 10.3390/rs12233856
Smith, S. G., Ault, J., Bohnsack, J., Harper, D., Luo, J., and McClellan, D. (2011). Multispecies survey design for assessing reef-fish stocks, spatially explicit management performance, and ecosystem condition. Fish. Res. 109, 25–41. doi: 10.1016/j.fishres.2011.01.012
Smith, T. B., Ennis, R. S., Kadison, E., Weinstein, D. W., Jossart, J., Gyory, J., et al. (2015). The United States Virgin Islands Territorial Coral Reef Monitoring Program. Year 15 Annual Report. Version 1. St. Thomas, U.S. Virgin Islands: University of the Virgin Islands. 288.
Stallings, C. D. (2009). Fishery-Independent data reveal negative effect of human population density on caribbean predatory fish communities. PLoS One 4:e5333. doi: 10.1371/journal.pone.0005333
Vargas-Ángel, B., Richards, C. L., Vroom, P. S., Price, N. N., Schils, T., Young, C. W., et al. (2015). Baseline assessment of net calcium carbonate accretion rates on U.S. Pacific Reefs. PLoS One 10:e0142196. doi: 10.1371/journal.pone.0142196
Vecsei, A. (2001). Fore-reef carbonate production: development of a regional census-based method and first estimates. Palaeogeogr. Palaeoclimatol. Palaeoecol. 145, 185–200. doi: 10.1016/s0031-0182(01)00371-6
Walton, C. J., Hayes, N. K., and Gilliam, D. S. (2018). Impacts of a regional, multiyear, multi-species coral disease outbreak in Southeast Florida. Front. Mar. Sci. 5:323. doi: 10.3389/fmars.2018.00323
Weijerman, M., Grace-McCaskey, C., Grafeld, S. L., Kotowicz, D. M., Oleson, K. L. L., and van Putten, I. E. (2016). Towards an ecosystem-based approach of Guam’s coral reefs: the human dimension. Mar. Policy 63, 8–17. doi: 10.1016/j.marpol.2015.09.028
Williams, I. D., Baum, J. K., Heenan, A., Hanson, K. M., Nadon, M. O., and Brainard, R. E. (2015). Human, oceanographic and habitat drivers of central and western pacific coral reef fish assemblages. PLoS One 10:e0120516. doi: 10.1371/journal.pone.0120516
Wongbusarakum, S., Gorstein, M., Pomeroy, R., Anderson, C. L., and Mawyer, A. (2021). Mobilizing for change: assessing social adaptive capacity in Micronesian fishing communities. Mar. Policy 129:104508. doi: 10.1016/j.marpol.2021.104508
Keywords: coral reefs, monitoring, climate change, fisheries, socioeconomics, science communication
Citation: Towle EK, Donovan EC, Kelsey H, Allen ME, Barkley H, Blondeau J, Brainard RE, Carew A, Couch CS, Dillard MK, Eakin CM, Edwards K, Edwards PET, Enochs IC, Fleming CS, Fries AS, Geiger EF, Grove LJ, Groves SH, Gorstein M, Heenan A, Johnson MW, Kimball J, Koss JL, Kindinger T, Levine A, Manzello DP, Miller N, Oliver T, Samson JC, Swanson D, Vargas-Ángel B, Viehman TS and Williams ID (2022) A National Status Report on United States Coral Reefs Based on 2012–2018 Data From National Oceanic and Atmospheric Administration’s National Coral Reef Monitoring Program. Front. Mar. Sci. 8:812216. doi: 10.3389/fmars.2021.812216
Received: 09 November 2021; Accepted: 13 December 2021;
Published: 03 February 2022.
Edited by:
William F. Precht, Dial Cordy and Associates Inc., United StatesReviewed by:
Lida Teneva, Independent Researcher, Sacramento, United StatesJennifer K. O’Leary, Wildlife Conservation Society, Kenya
Copyright © 2022 Towle, Donovan, Kelsey, Allen, Barkley, Blondeau, Brainard, Carew, Couch, Dillard, Eakin, Edwards, Edwards, Enochs, Fleming, Fries, Geiger, Grove, Groves, Gorstein, Heenan, Johnson, Kimball, Koss, Kindinger, Levine, Manzello, Miller, Oliver, Samson, Swanson, Vargas-Ángel, Viehman and Williams. This is an open-access article distributed under the terms of the Creative Commons Attribution License (CC BY). The use, distribution or reproduction in other forums is permitted, provided the original author(s) and the copyright owner(s) are credited and that the original publication in this journal is cited, in accordance with accepted academic practice. No use, distribution or reproduction is permitted which does not comply with these terms.
*Correspondence: Erica K. Towle, erica.towle@noaa.gov