Challenges for Marine Ecological Assessments: Completeness of Findable, Accessible, Interoperable, and Reusable Biodiversity Data in European Seas
 Francisco Ramírez
 Valerio Sbragaglia1
  Marta Coll
 Jaume Piera
- 1Department of Renewable Marine Resources, Institut de Ciències del Mar (ICM-CSIC), Barcelona, Spain
- 2Department of Physical and Technological Oceanography, Institut de Ciències del Mar (ICM-CSIC), Barcelona, Spain
- 3Ecopath International Initiative, Barcelona, Spain
The ongoing contemporary biodiversity crisis may result in much of ocean’s biodiversity to be lost or deeply modified without even being known. As the climate and anthropogenic-related impacts on marine systems accelerate, biodiversity knowledge integration is urgently required to evaluate and monitor marine ecosystems and to support suitable responses to underpin a sustainable future. The Census of Marine Life (CoML, 2000–2010) was the largest global research program on marine biodiversity. A decade after, and coinciding with the steep increase of digitalization of our society, we review existing findability, accessibility, interoperability, and reusability (FAIR) biodiversity data coming from one of the most reliable online information systems: the Global Biodiversity Information Facility (GBIF). We evaluate the completeness of available datasets with respect to the CoML benchmark, along with progresses in understanding spatial–temporal patterns of marine biodiversity in the European Seas in the last decades. Overall, we observe severe biases in available biodiversity data toward the north-western marine regions (particularly around the United Kingdom and the North Sea), the most recent years (with a peak in the number of reported occurrences in the 2010s) and the most conspicuous, abundant, and likely “appealing” taxa (e.g., crustaceans, echinoderms or fish). These biases may hamper research applications, but also global-scale data needs and integrative assessments required to support cost-effective progresses toward global biodiversity conservation. National to international joint efforts aimed at enhancing data acquisition and mobilization from poorly known regions, periods, and taxa are desirable if we aim to address these potential biases for the effective monitoring of marine ecosystems and the evaluation of ongoing impacts on biogeographic patterns and ecosystem functioning and services.
Introduction
There is increasing evidence that human activities over the last decades/centuries have grown to become significant driving forces of global processes. This has caused the Earth System to depart from the comparatively stable conditions that characterized the Holocene Epoch, when human societies have flourished (Steffen et al., 2011; Whitmee et al., 2015; Zalasiewicz et al., 2020). Accordingly, the term “Anthropocene” is being increasingly used to refer to this new status quo, when large-scale human effects are exerting impacts on the environment that result in the contemporary biodiversity crisis and in the collapse of many ecosystems (Rockström et al., 2009; Steffen et al., 2011; Whitmee et al., 2015).
Among natural habitats, oceanic systems are of particular concern since they are among the most important (in terms of nature contributions to people), complex, poorly understood, and likely most impacted of Earth’s biomes (Hoegh-Guldberg and Bruno, 2010; IPCC, 2014; Halpern et al., 2015; Ramírez et al., 2017). Ocean warming and pollution, marine habitat degradation, and overexploitation of marine resources (among others) are posing serious threats to marine biodiversity, much of which could disappear without ever being known (Ramírez et al., 2017; Cuyvers et al., 2018; Pinsky et al., 2018; FAO, 2020; Landrigan et al., 2020). As the climate and anthropogenic-related impacts on marine systems accelerate (Burrows et al., 2011; Coll et al., 2012; Micheli et al., 2013; Ramírez et al., 2017; Boyce et al., 2020), biodiversity knowledge integration is urgently required to evaluate and monitor marine ecosystem health, and to support suitable responses to underpin a sustainable future.
Reliable and systematic biodiversity assessments are challenging in the vast and remote oceans. The first large-scale, multidisciplinary, and multinational assessments on marine biodiversity date back only to the 1990s, with the Census of Marine Life (CoML) likely being the most extensive of all of them (Costello et al., 2010). The CoML mobilized more than 2,700 scientists from more than 80 countries and ca. US$650 million, and spanned the 2000–2010 period (Costello et al., 2010). A decade after, and coinciding with the steep increase of digitalization of our society, digital data and online information systems may offer a means for marine biodiversity assessments at an unprecedented extent and spatial, temporal, and taxonomical resolutions (Jarić et al., 2020b); while contributing to our understanding of the processes, patterns, and mechanisms underlying the ongoing contemporary biodiversity crisis (Meyer et al., 2015; Ball-Damerow et al., 2019).
Recent efforts toward digitization of natural history collections (Beaman and Cellinese, 2012), along with the development of digital, open-access repositories (e.g., Global Biodiversity Information Facility – GBIF) and online platforms for citizen science (also known as citizen observatories; e.g., Sullivan et al., 2014), have driven a steady accumulation of species occurrence digitized records over the past decade. To date, online databases sum up more than one billion records; they have unlocked previously inaccessible data and expanded their availability to researchers around the world (Ball-Damerow et al., 2019).
However, the biggest challenge for digitized biodiversity data and for subsequent ecological/environmental applications is obtaining records of sufficient quantity and quality for specific region, period, and taxonomic group of interest (Ariño et al., 2013; Meyer et al., 2015). Digital biodiversity databases are still in the initial stages of development. For example, recent estimates suggest that only 10% of biological collections are available in digital form (Ariño, 2010; Page et al., 2015; Ball-Damerow et al., 2019), and it would take many decades to completely digitize estimated holdings at current rates (Ariño, 2018; Ball-Damerow et al., 2019). As such, completeness of biodiversity digitized data is likely biased; with remote regions, particular periods, and “less common” taxa being under-sampled or completely unrepresented (Boakes et al., 2010; Meyer et al., 2015, 2016b; Ruete, 2015). These biases directly influence opportunities for inference and application of biodiversity digitized data (Katsanevakis et al., 2015; Meyer et al., 2015, 2016b). While continued digitization of available biodiversity databases is desirable, efforts aimed at identifying and addressing these potential biases (e.g., through targeted data mobilization, Hobern et al., 2012) should be prioritized if we aim to use these data for the effective monitoring of marine ecosystem, and the evaluation of ongoing impacts on biogeographic patterns, and ecosystem functioning and services (Levin et al., 2014; Meyer et al., 2015).
With a long-standing natural, cultural and economic heritage, the European Seas has experienced a long history of anthropogenic perturbations, and encompass some of the most impacted marine systems on Earth (particularly in their northern parts, Halpern et al., 2008; Ramírez et al., 2017). They also contain some of the historically and presently best explored and known marine areas of the world (e.g., Narayanaswamy et al., 2010; Ojaveer et al., 2010; Costello and Wilson, 2011). This knowledge builds up at multiple levels of ecological complexity (from individuals to communities and ecosystems) and bridges among contrasting sampling methodologies and analytical techniques (Narayanaswamy et al., 2013). However, there is a need of synthetic and integrative marine biodiversity assessments, based on existing findable, accessible, interoperable, and reusable (FAIR) biodiversity data, that may contribute toward our comprehension of the “known, unknown and unknowable” biodiversity, the monitoring of marine ecosystem, and the sustainable management and conservation of marine biodiversity (Narayanaswamy et al., 2013; Levin et al., 2014; Katsanevakis et al., 2015).
In this work, we assessed existing FAIR biodiversity data for the European Seas available on GBIF, one of the biggest biodiversity information infrastructures. We evaluated the “completeness” of these datasets with respect to the CoML benchmark (Costello et al., 2010; Narayanaswamy et al., 2013), along with progresses in understanding spatial–temporal patterns of marine biodiversity in the region in the last decade. In particular, we aimed at assessing how the observational effort available in digitized datasets is currently distributed to maximize the completeness of the three main informational dimensions of species diversity: spatial, temporal, and taxonomical. We then discuss how potential biases may affect future analytical efforts toward building integrated marine assessments (e.g., species and biodiversity distribution and trends) and hamper prospects for research and sustainable management applications.
Materials and Methods
Data Mining
Based on data from GBIF, we evaluated spatial–temporal patterns in the number of occurrences and individual species within the European Seas, as proxies of “sampling effort” and species richness, respectively. Following Costello et al. (2010) when analyzing biodiversity information from CoML, we distinguished among four basins within the study area: Atlantic EU, Baltic Sea, Black Sea, and Mediterranean Sea (Figure 1). Occurrences and species were also grouped following the categorization provided by Costello et al. (2010): Protozoa, Crustacea, Pisces, Tunicata, Mollusca, Annelida, Cnidaria, Platyhelminthes, Echinodermata, Porifera, and Bryozoa. Because several groups in Costello et al. (2010) were paraphyletic (e.g., Pisces), we first mapped the correspondence between these groups and the appropriate taxa in GBIF. Due to a large number of occurrences (>20 millions) and for facilitating the analysis within R x64 4.1.0 software (R Core Team, 2021), data were downloaded from GBIF web portal1 through different queries (see Supplementary Table 1 for details on each query, and associated DOIs). Through each query, we downloaded the total number of occurrences for selected taxa within a wide enough polygon to include our study area (longitude: ∼−50.2° to 62°; latitude: ∼24.2° to 89.6°). We considered “Present” as the occurrence status, as there is a wide consensus that, in general, online biodiversity datasets should be mainly regarded as “presence only” data (Graham et al., 2004). Obtained datasets were then masked to remove occurrences in the mainland.
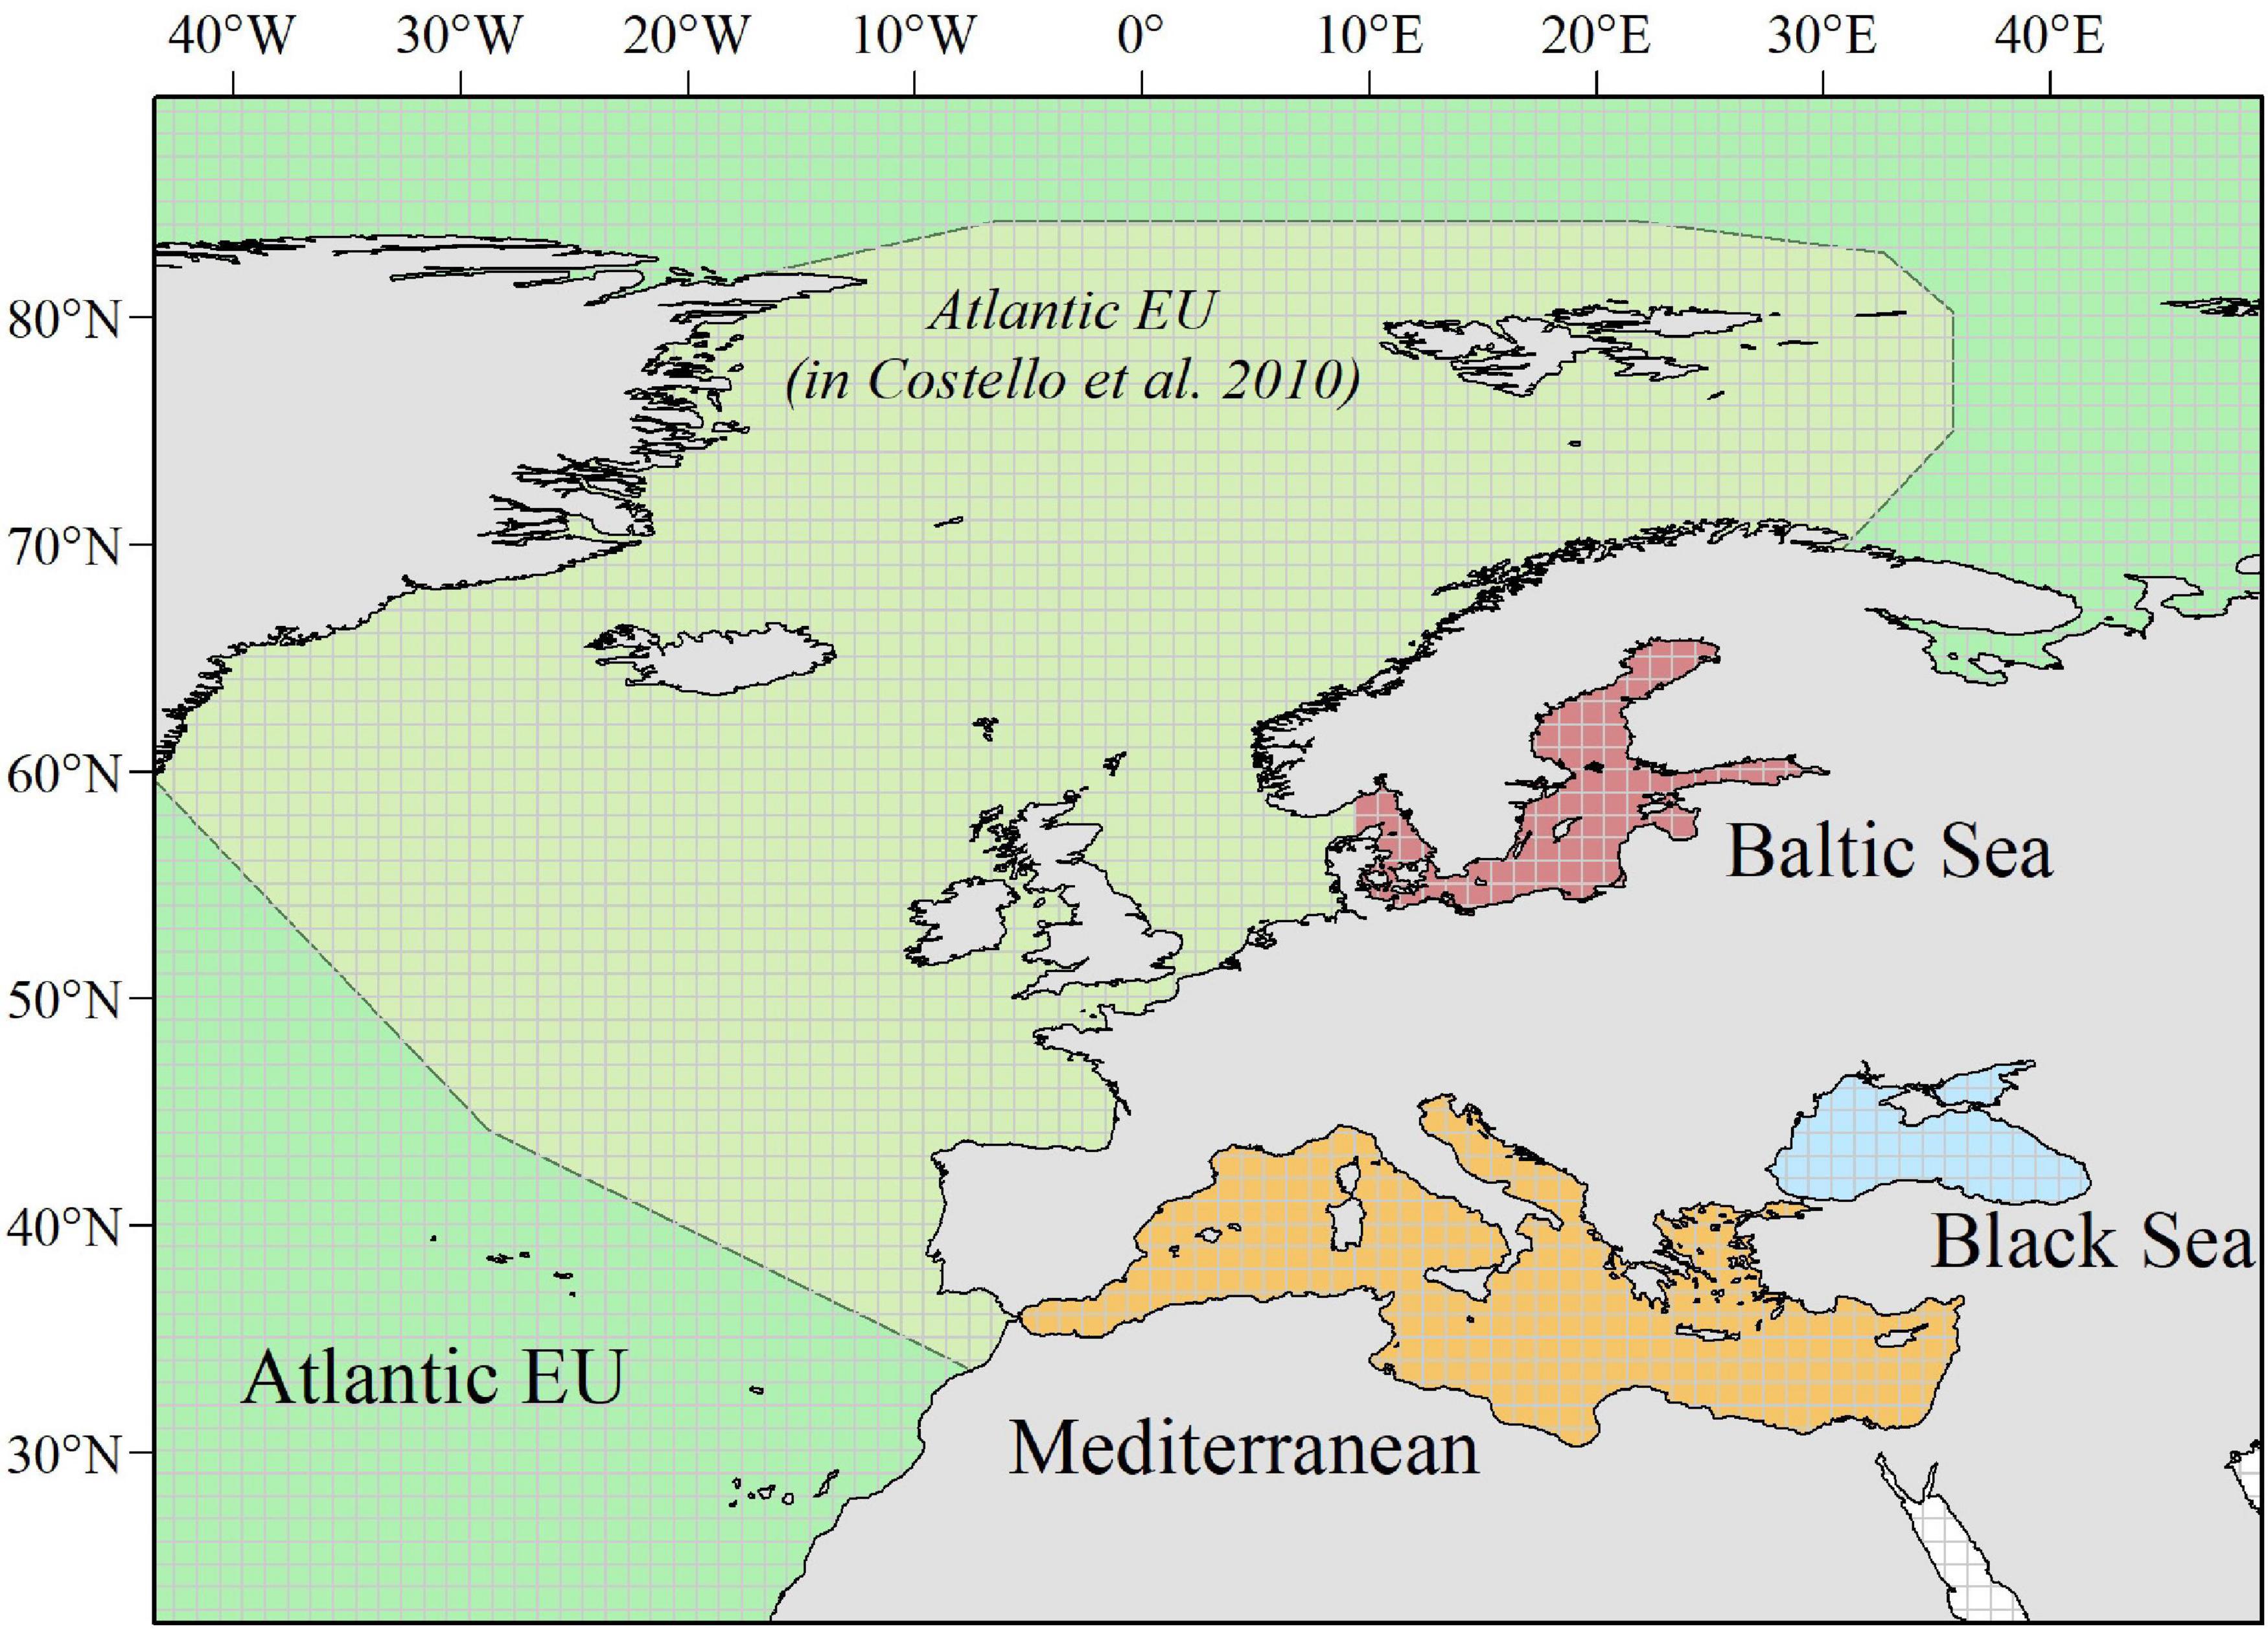
Figure 1. Study area. We considered a wide enough polygon (longitude: ∼ –50.2° to 62°; latitude: ∼24.2° to 89.6°) to include all relevant European Seas. Following Costello et al. (2010) when analyzing biodiversity information from the Census of Marine Life, we distinguish among four basins: Atlantic EU, Baltic Sea, Black Sea, and Mediterranean Sea. The Atlantic EU considered in Costello et al. (2010) was smaller than what we consider as the whole Atlantic EU area. This is because we additionally include water masses around the Macaronesia (including Azores, Madeira, and Canary Islands), and the northernmost Atlantic waters. To evaluate spatial patterns in the total number of occurrences and individual species, we consider a 1° × 1° grid map covering the whole study area.
Importantly, digitized biodiversity data are not exempt from errors, with species identity and locality being the most error-prone aspects of collection information (Graham et al., 2004; Ball-Damerow et al., 2019). Given the large number of occurrences we dealt with, and the broad and descriptive nature of our objectives (i.e., evaluating the completeness of FAIR biodiversity data available on GBIF), we did not check for specific data quality, errors, and accuracy. Overall, erroneous and inaccurate records primarily lead to overestimation of species richness out of biodiversity hot spots (Maldonado et al., 2015). However, the effects of inaccurate data are certainly diluted in studies that include a large number of records, as it is our case (Pyke and Ehrlich, 2010).
Spatial, Temporal, and Taxonomical Completeness of Open Biodiversity Data
As a proxy to the spatial distribution of sampling effort, we estimated the total number of occurrences per cell within a 1° × 1° grid map covering the whole study area. This represents a “coarse”-enough resolution to be not excessively restrictive in our spatial completeness assessments, while ensuring the capture of relevant patterns of biodiversity distribution at the European Seas level (see Meyer et al., 2015). Cells were categorized according to the four-level basin category, i.e., Atlantic EU, Baltic Sea, Black Sea, and Mediterranean Sea. To evaluate patterns in species richness, we used a similar approach and estimated the total number of unique species per 1° × 1° cell. Per-cell information and non-linear least squares regressions were used to evaluate the relationship between our proxies to sampling effort and species richness. In particular, we used the Michaelis–Menten equation [y − ax/(b + x)], which is one of the most used functions to project species accumulation curves (Keating and Quinn, 1998; Longino et al., 2002, see also Meyer et al., 2015). We manually defined starting values for non-liner regression by visually exploring plots and allowing the model to efficiently converge.
The Michaelis–Menten equation considers a decay curve with a rapid initial increase in species richness as sampling effort rises, and a gradual decrease in the slope while approaching to a horizontal asymptote. This relationship can be interpreted as an indicator of the sampling effort necessary to achieve a good representation of the species richness for a given area (Costello et al., 2013). We therefore calculated basin-specific thresholds at which 75% of species were detected with respect to the asymptote value. The thresholds were determined by predicting the number of occurrences needed using the fitted functions of each basin. To evaluate the data spatial completeness, we therefore considered that those points over the threshold corresponded to areas (i.e., cells within the 1° × 1° grid map) showing an “adequate” sampling effort.
Data temporal coverage and completeness was evaluated by estimating the total number of occurrences per taxa, year, and basin. To evaluate potential biases in the relative contribution of particular taxa to the total number of occurrences reported for a given year and basin (pi), we yearly estimated a basin-specific Shannon index Assuming that there have been no major local extinction events or appearances of new species along the time-series, any deviation in the Shannon index could be therefore interpreted as incomplete taxonomic sampling.
Finally, we evaluated the data taxonomical completeness by comparing the total number of species per taxa and basin, with analogous results reported by Costello et al. (2010) and, hence, for the CoML. As the Atlantic EU basin, we considered here a wider area than the one used in Costello et al. (2010), in order to incorporate marine waters around the Macaronesia (including Azores, Madeira, and Canary Islands), and the northernmost Atlantic waters. However, and for comparison purposes, we also considered here what Costello et al. (2010) defined as Atlantic EU (Figure 1). It is also worth noting that the Black Sea constitutes an addition to the basins considered in Costello et al. (2010).
Data Contributors to Global Biodiversity Information Facility
Overall, GBIF datasets have been provided by more than 2,000 different publishers.2 Here we wanted to identify the main contributors of biodiversity data for all considered marine basins. For that purpose, we estimated the total number of occurrences per contributor/publisher and basin. For representation purposes, we considered only the top 25 contributors on the list.
Results
Data Completeness in the Spatial, Temporal, and Taxonomical Dimensions
Our spatially explicit proxy to sampling effort (i.e., total number of occurrences per cell) heterogeneously distributed spatially, with the highest sampling effort occurring in the North Sea and coastal areas around the Scandinavian Peninsula, the United Kingdom, the Azores Archipelago, and the North-western Mediterranean Sea. Analogously, our estimates of species richness were heterogeneously distributed, with the highest values largely occurring in those areas with the highest sampling effort. However, other “biodiversity hotspots” with relatively high values of species richness emerged in the northernmost areas of Scandinavian Peninsula (near the Arctic Sea), the Macaronesia (including Azores, Madeira, and Canary Islands), the coastal areas around the Iberian Peninsula, and the northernmost areas of the Western and the Central Mediterranean Sea (including Balearic, Tyrrhenian, and Adriatic Seas; Figure 2).
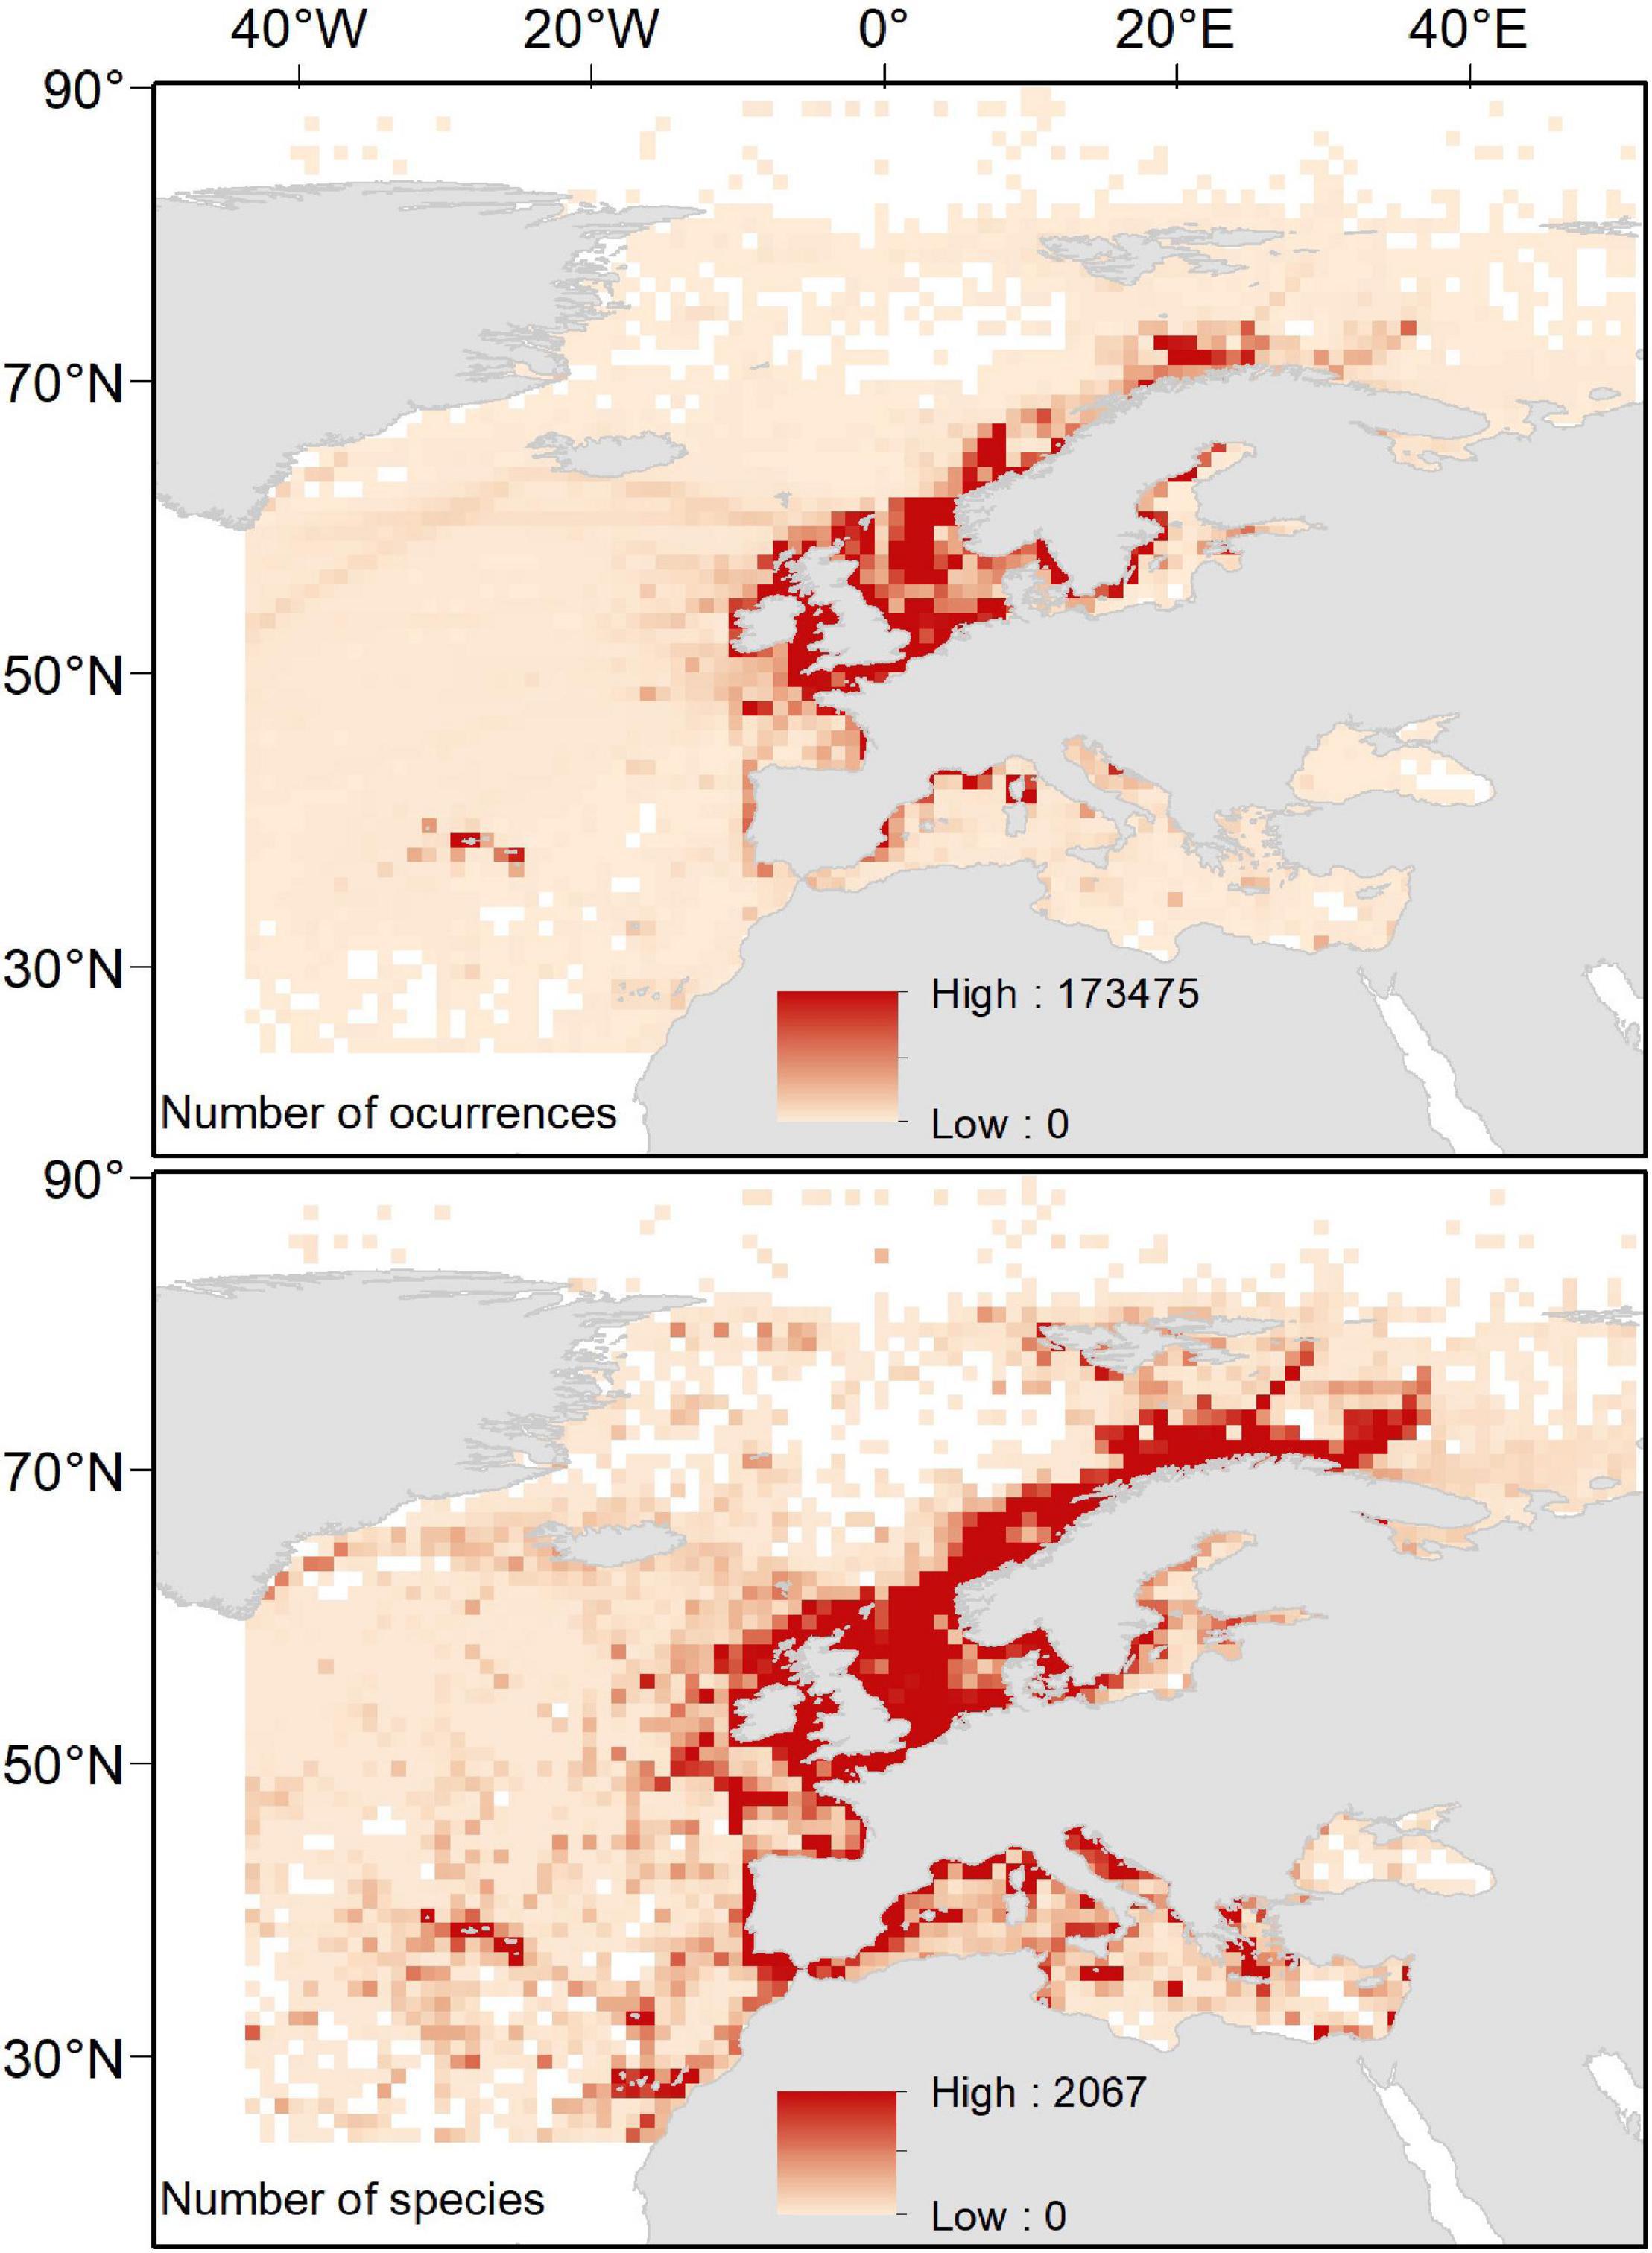
Figure 2. Spatial distribution of total number of occurrences and total number of species per cell in a 1° × 1° grid map.
When evaluating the relationship between our proxies to sampling effort and species richness, we observed a highly significant, non-linear effect of sampling effort on species richness (Table 1). As expected for the Michaelis–Menten equation, our data followed a decay curve, with an increasing decay in the rate at which new species are reported for a particular area (1° × 1° cell) as sampling effort rose (Figure 3). These trends were consistent among basins, with the likely exception of the Black Sea, where a near-linear relationship was observed, suggesting that the relationship was far from saturation. Accordingly, results for the Black Sea should be taken with caution. Based on these relationships, and derived thresholds informing on their saturation levels, we identify some areas (1° × 1° cells) in the European Seas where sampling effort was apparently suitable for achieving a good representation of the species richness (Figure 3). Most of these areas (50 out of 65 cells) occurred in the Atlantic EU, and, particularly, around the United Kingdom and the North Sea. However, they represent only a small fraction of the Atlantic EU total area (ca. 1.2% of cells within the Atlantic EU basin). Despite the relatively large sampling effort in the Baltic Sea (Figure 2), only 2 out of 126 cells were categorized as suitable according to the considered threshold. Nine out of 359 Mediterranean cells were categorized as suitable and distributed along the North-western Mediterranean Sea.
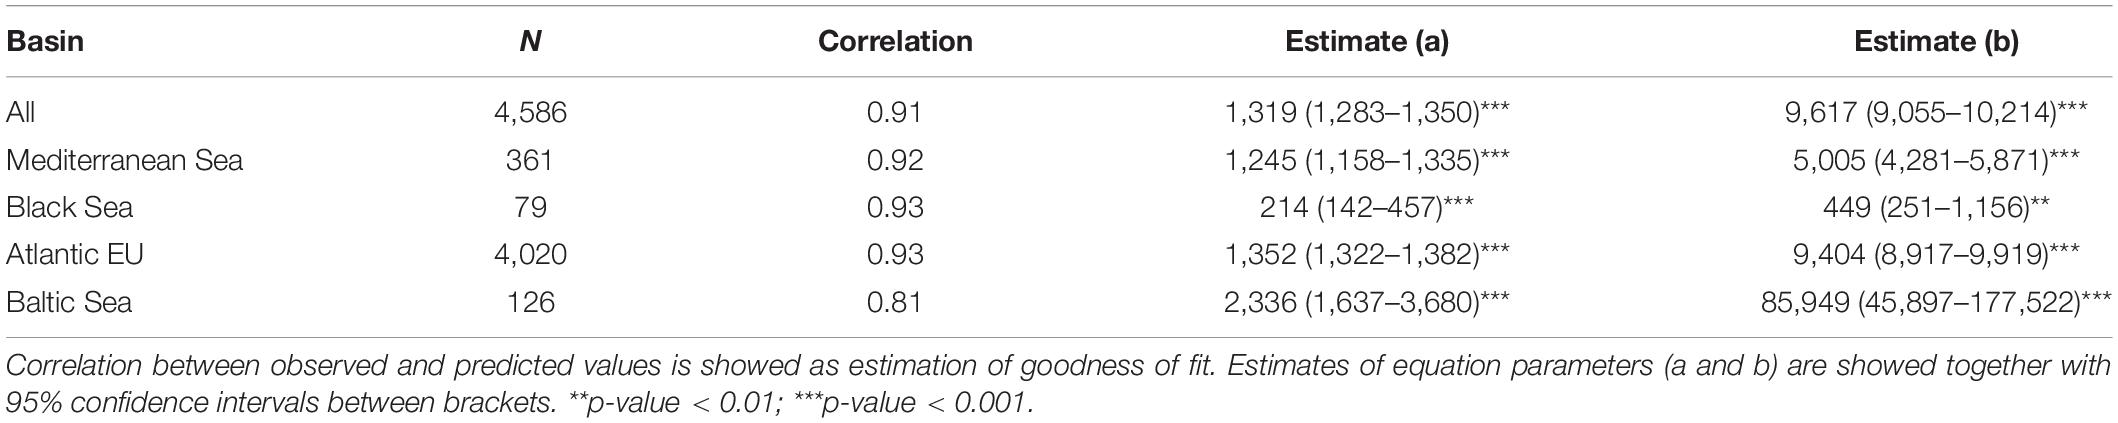
Table 1. Results of the non-liner regressions for all basins and for each individual basin.
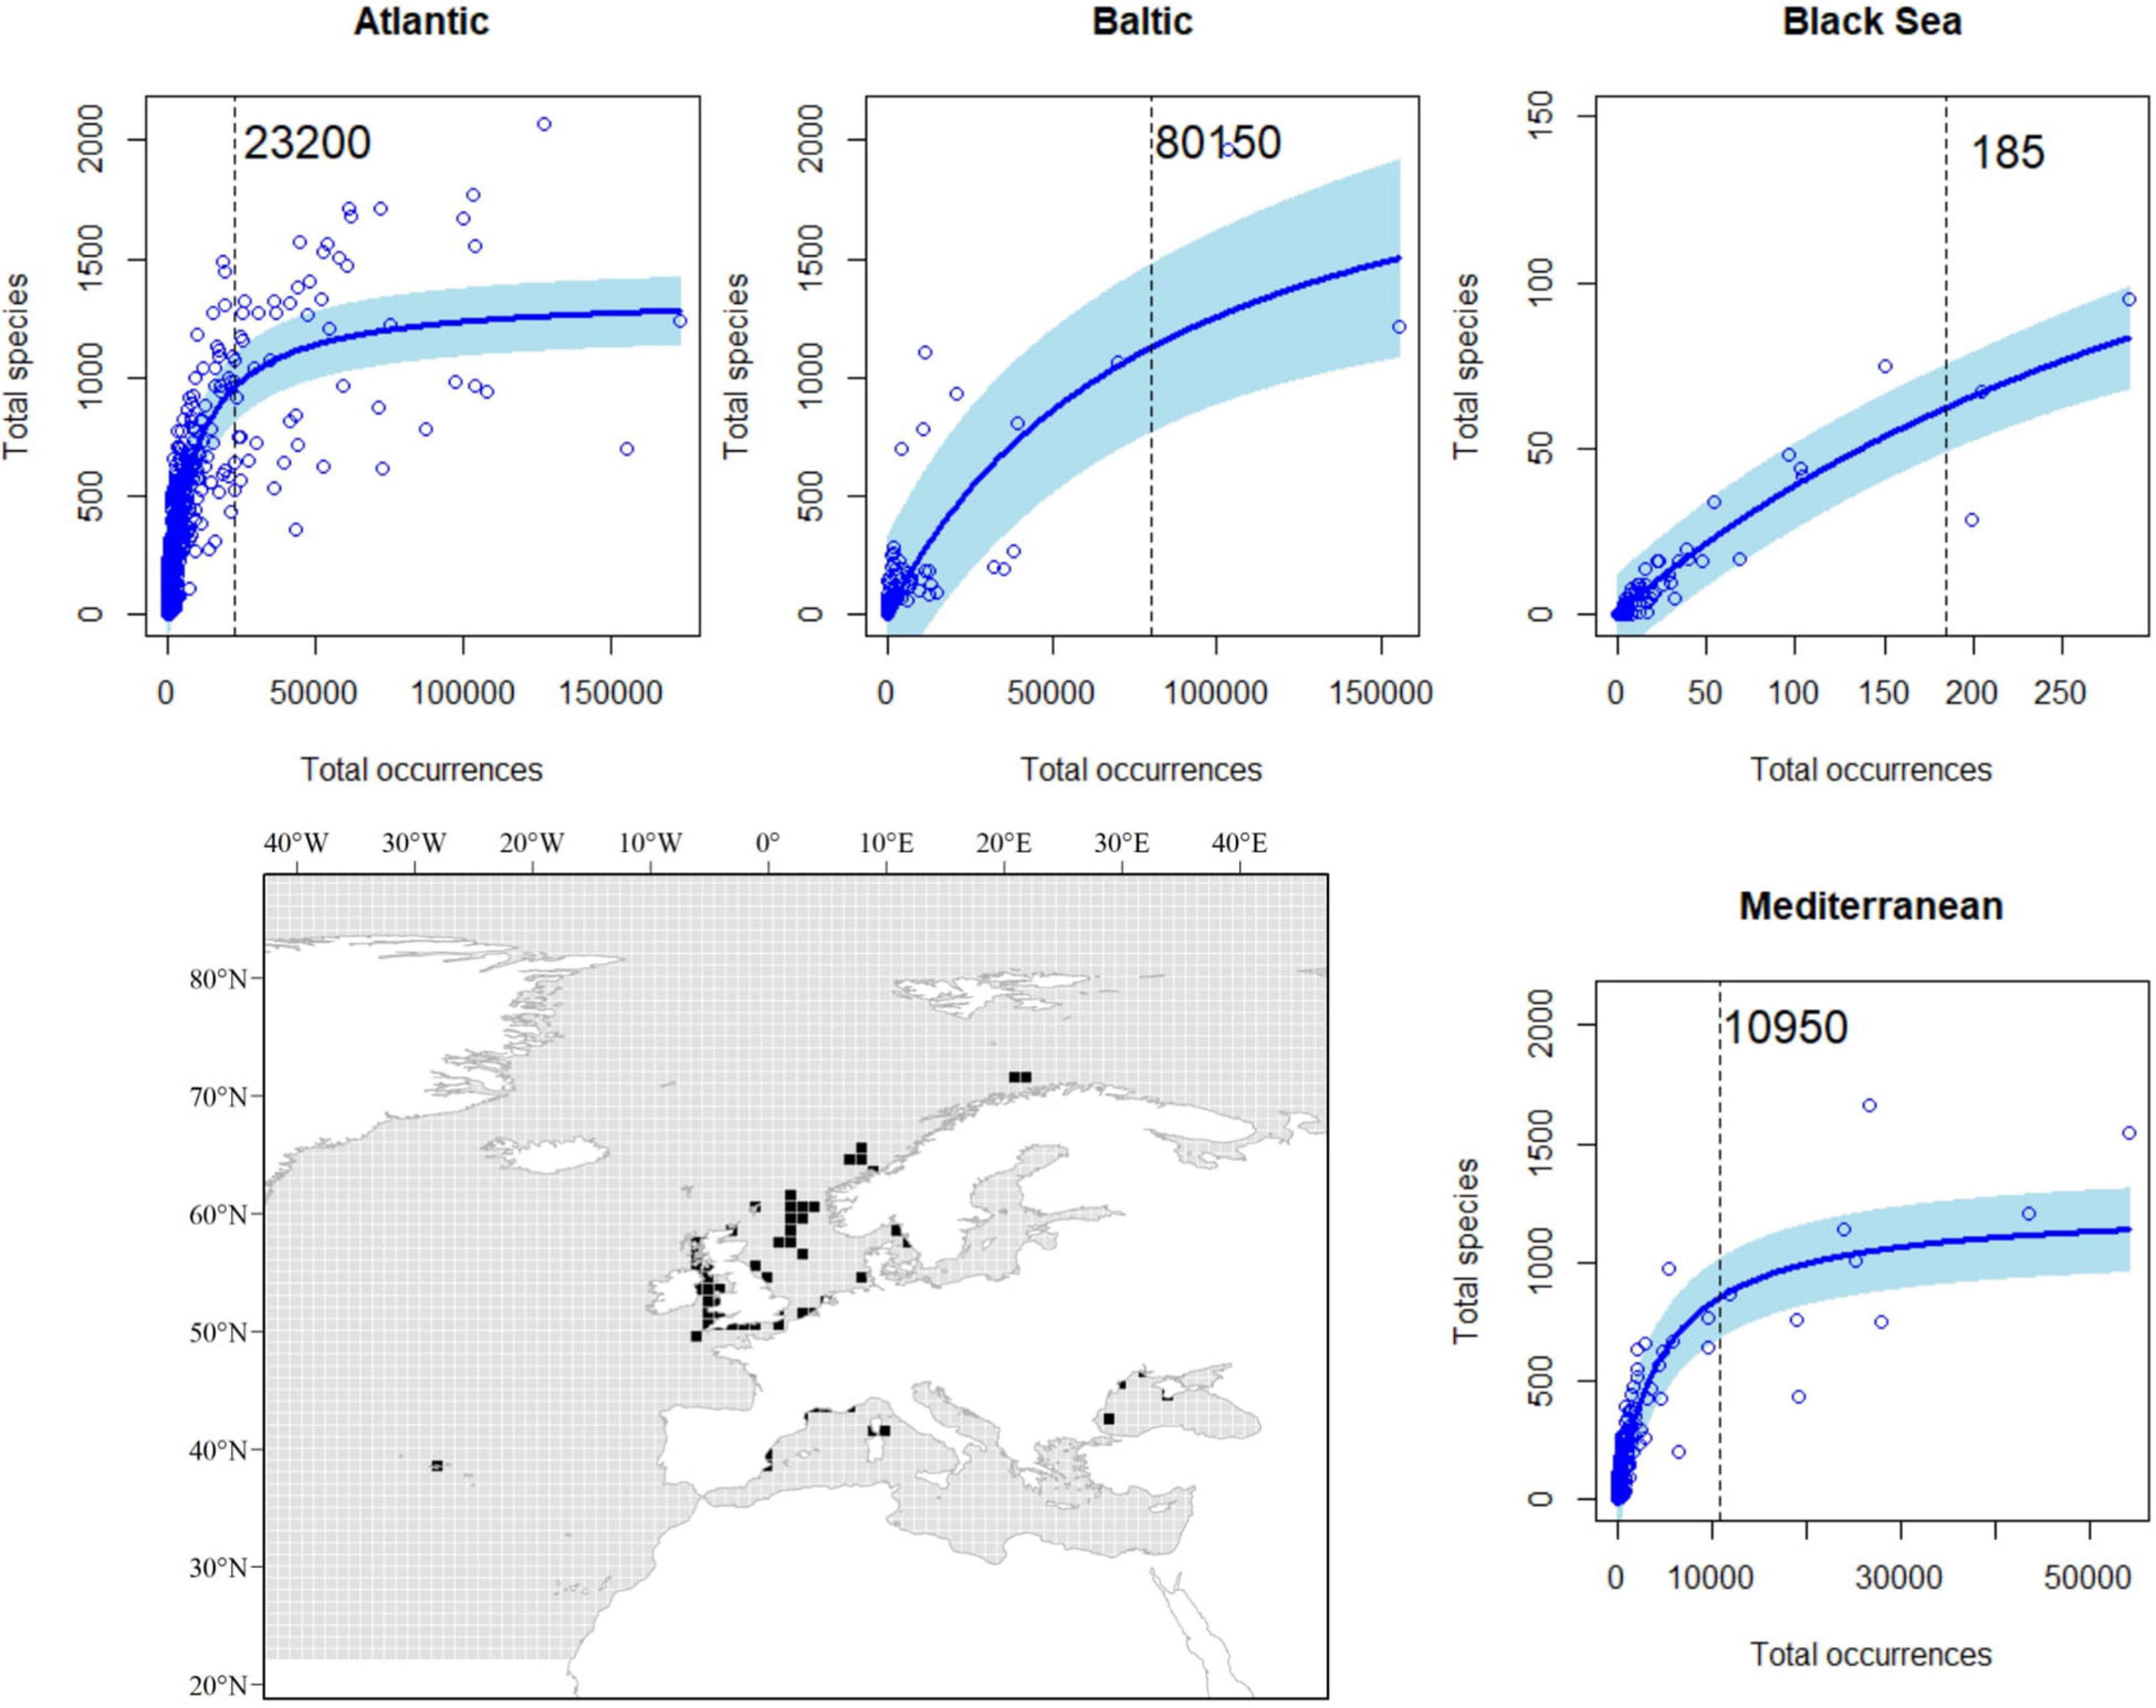
Figure 3. Relationship between the total number of occurrences and the total number of species per cell in a 1° × 1° grid map; basin-specific thresholds (vertical dashed lines) and the spatial representations of those areas (black) with an adequate sampling effort to achieve a good representation of species richness.
Regarding the temporal coverage of open biodiversity data available on GBIF, we identified a common pattern among basins, with a rapid increase in the number of reported occurrences in the late 20th century, a peak around the 2010s, coinciding with the end of CoML, and a decrease afterward. In the case of the Mediterranean Sea, the pattern was similar but delayed in time, with the steep increase in the number of occurrences befalling in the mid/late 2010s, and peaking in the late 2020s. The Black Sea was likely the only exception to this pattern, as the number of reported occurrences was consistently low and largely oscillated along the time series (Figure 4).
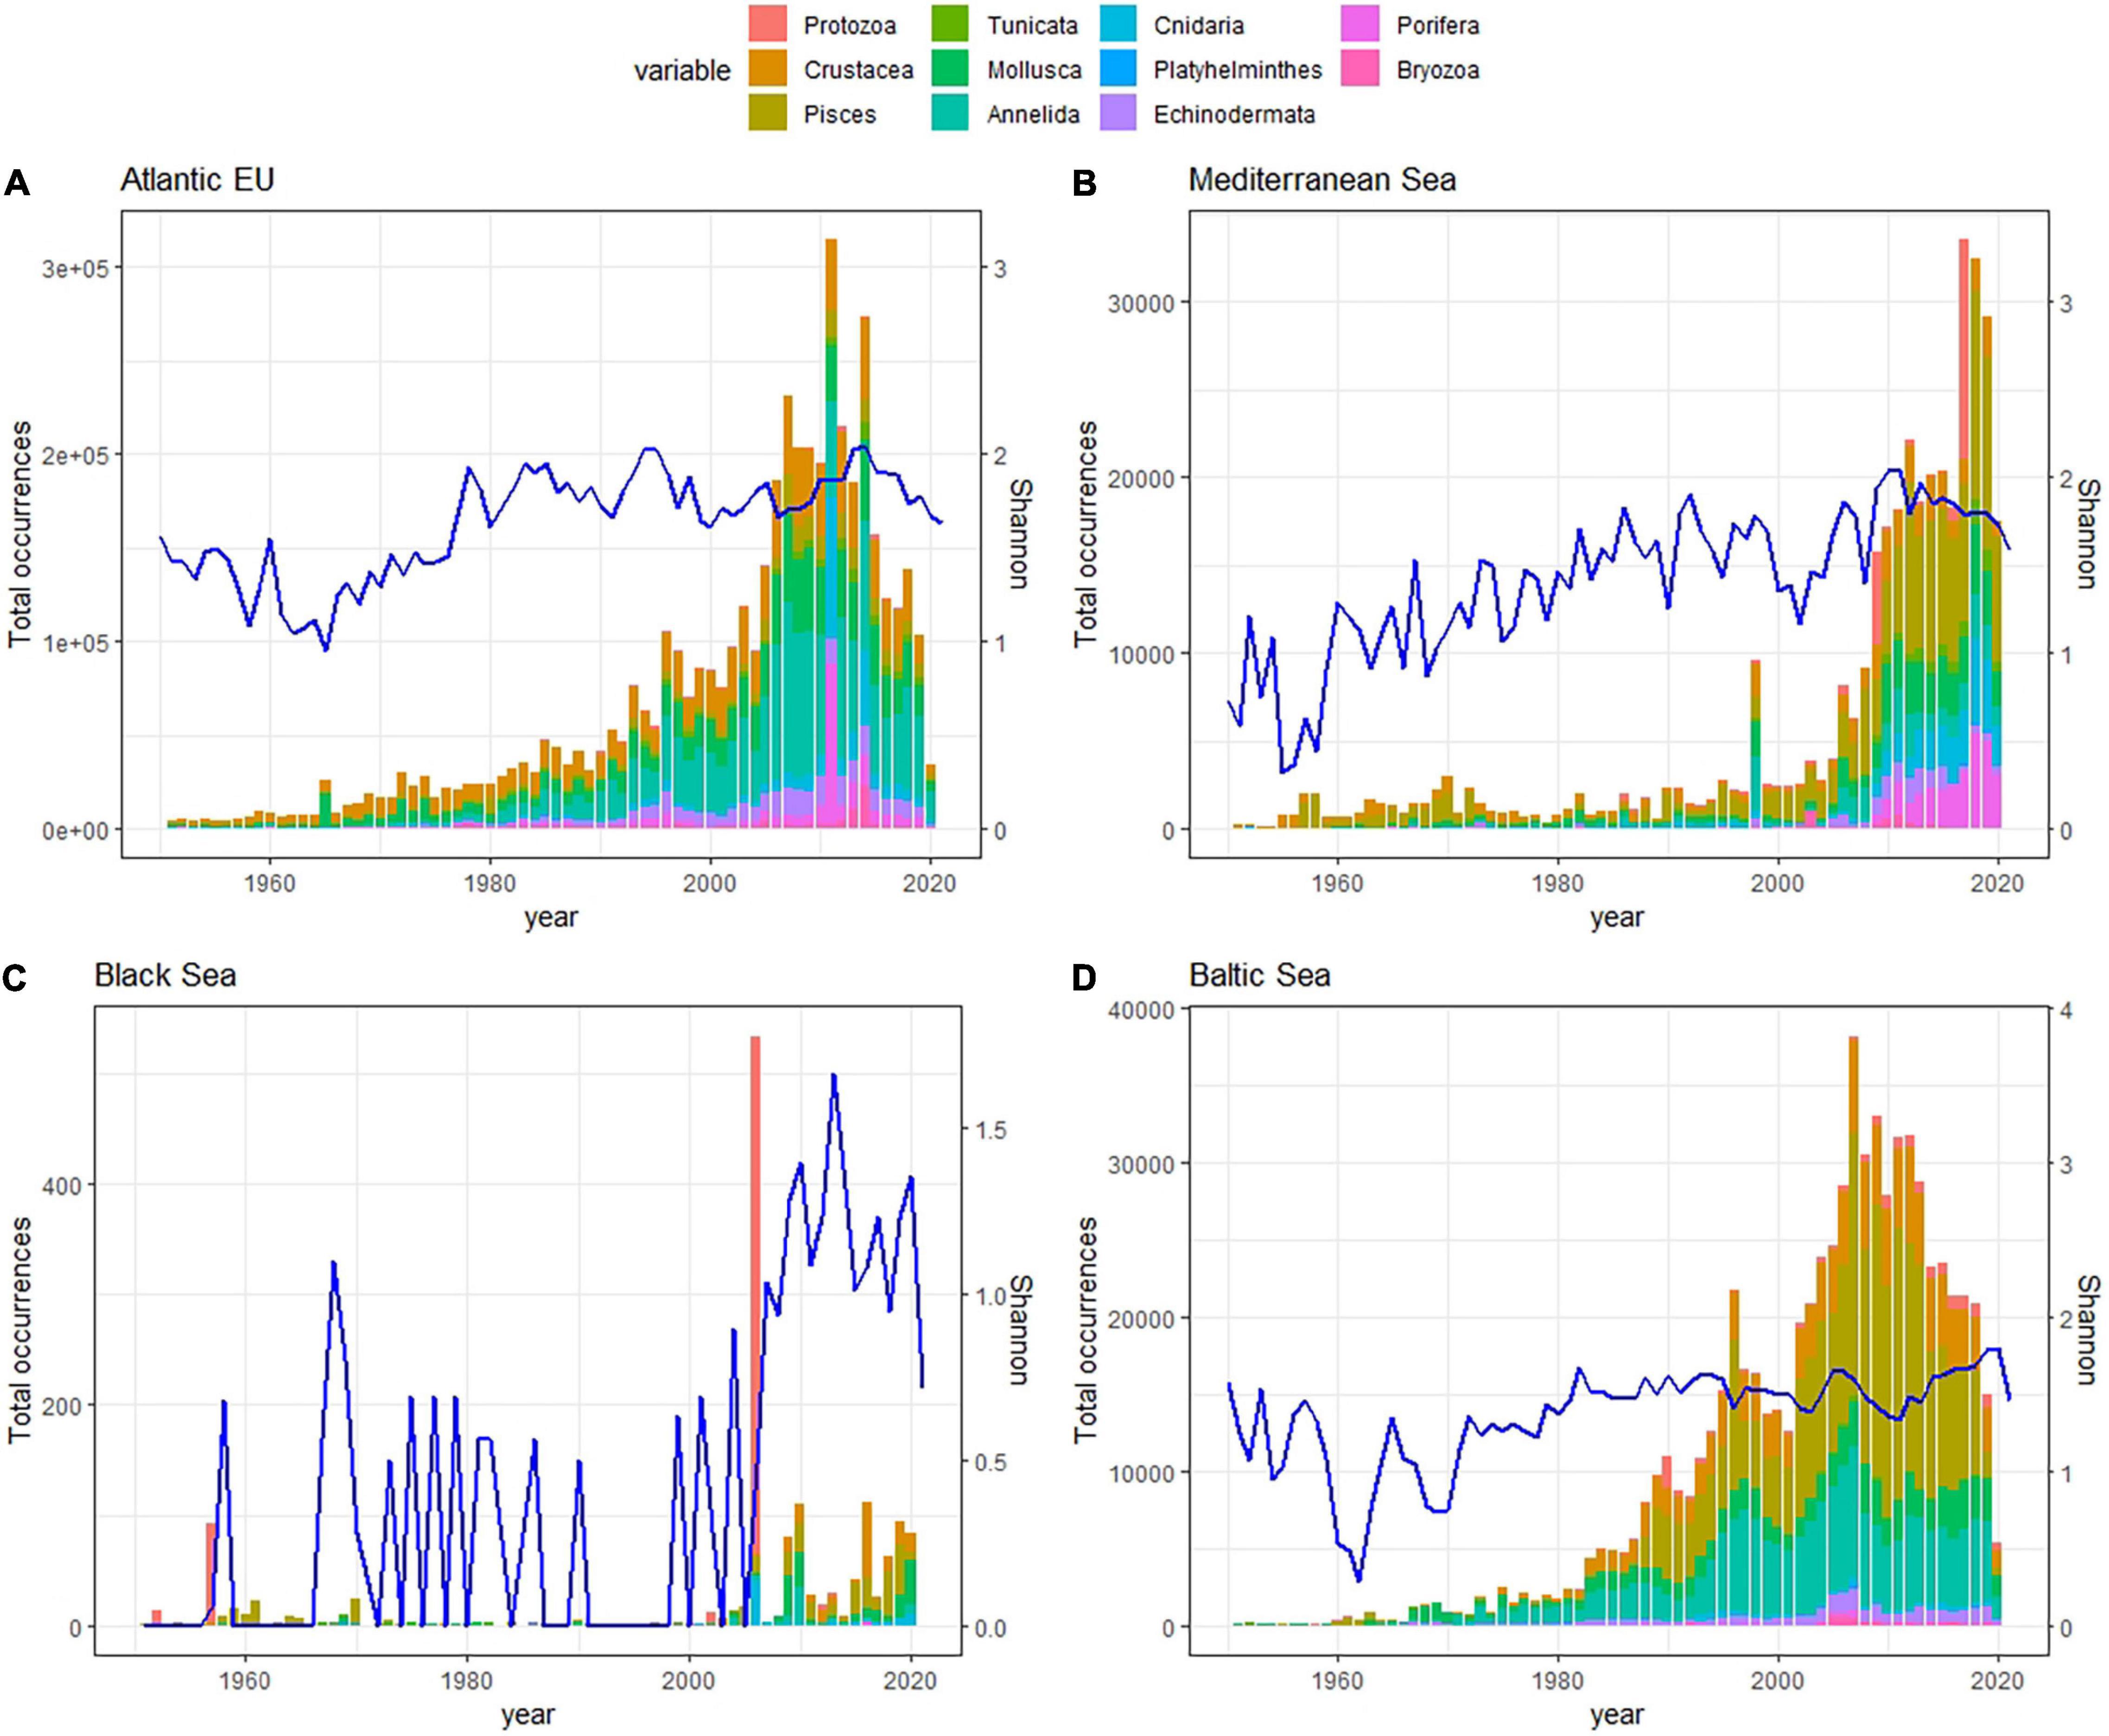
Figure 4. Stacked bar plot showing basin-specific trends in the total number of occurrences per taxa along the last decades for the Atlantic EU (A), Mediterranean Sea (B), Black Sea (C), and Baltic Sea (D). Note that first occurrences date back to the XVII century, but here we just represent the 1950–2020 period. Different taxa are represented in colors, and the year-specific Shannon Index (blue line), which considered the relative contribution of particular taxa to the total number of occurrences reported for a given year and basin, was used as an indicator of the completeness in taxonomic sampling along the time-series.
No or minor biases in the taxonomic sampling were observed for Atlantic EU and the Baltic Sea since the 1990s, as revealed by the relatively constant values in the basin-specific Shannon index (H′). In the case of the Mediterranean Sea, the positive trend in the Shannon index suggested an incomplete taxonomic sampling likely due to the absence of Echinodermata, Porifera, and Bryozoa reported before the beginning of the 2000s. In the Black Sea, the unstable trend in the Shannon index suggested that the taxonomic completeness of reported data is far from complete (Figure 4).
The taxonomic completeness was also evaluated by comparing the taxonomic detail of GBIF data with analogous results reported by Costello et al. (2010) when analyzing biodiversity information from the CoML (Figure 5 and Table 2). Overall, the total number of species reported in GBIF for the Atlantic EU and the Baltic Sea were higher than those previously reported in Costello et al. (2010), with the exception of the less conspicuous species; i.e., Protozoa and Annelida in the Atlantic EU, and Protozoa and Platyhelminthes in the Baltic Sea. In the case of Atlantic EU, this trend was consistent (except for Annelida) for both the area considered as Atlantic EU in Costello et al. (2010) and the area that we considered as the whole Atlantic EU, which additionally included Macaronesia and the Arctic Sea (Figure 1). The total number of species reported in GBIF increased when considering these additional areas. However, these differences varied among considered taxa, with Pisces and Mollusca showing the highest relative increases (38 and 30%, respectively), and Annelida and Platyhelminthes showing the lowest relative increases (6 and 3%, respectively; Table 2).
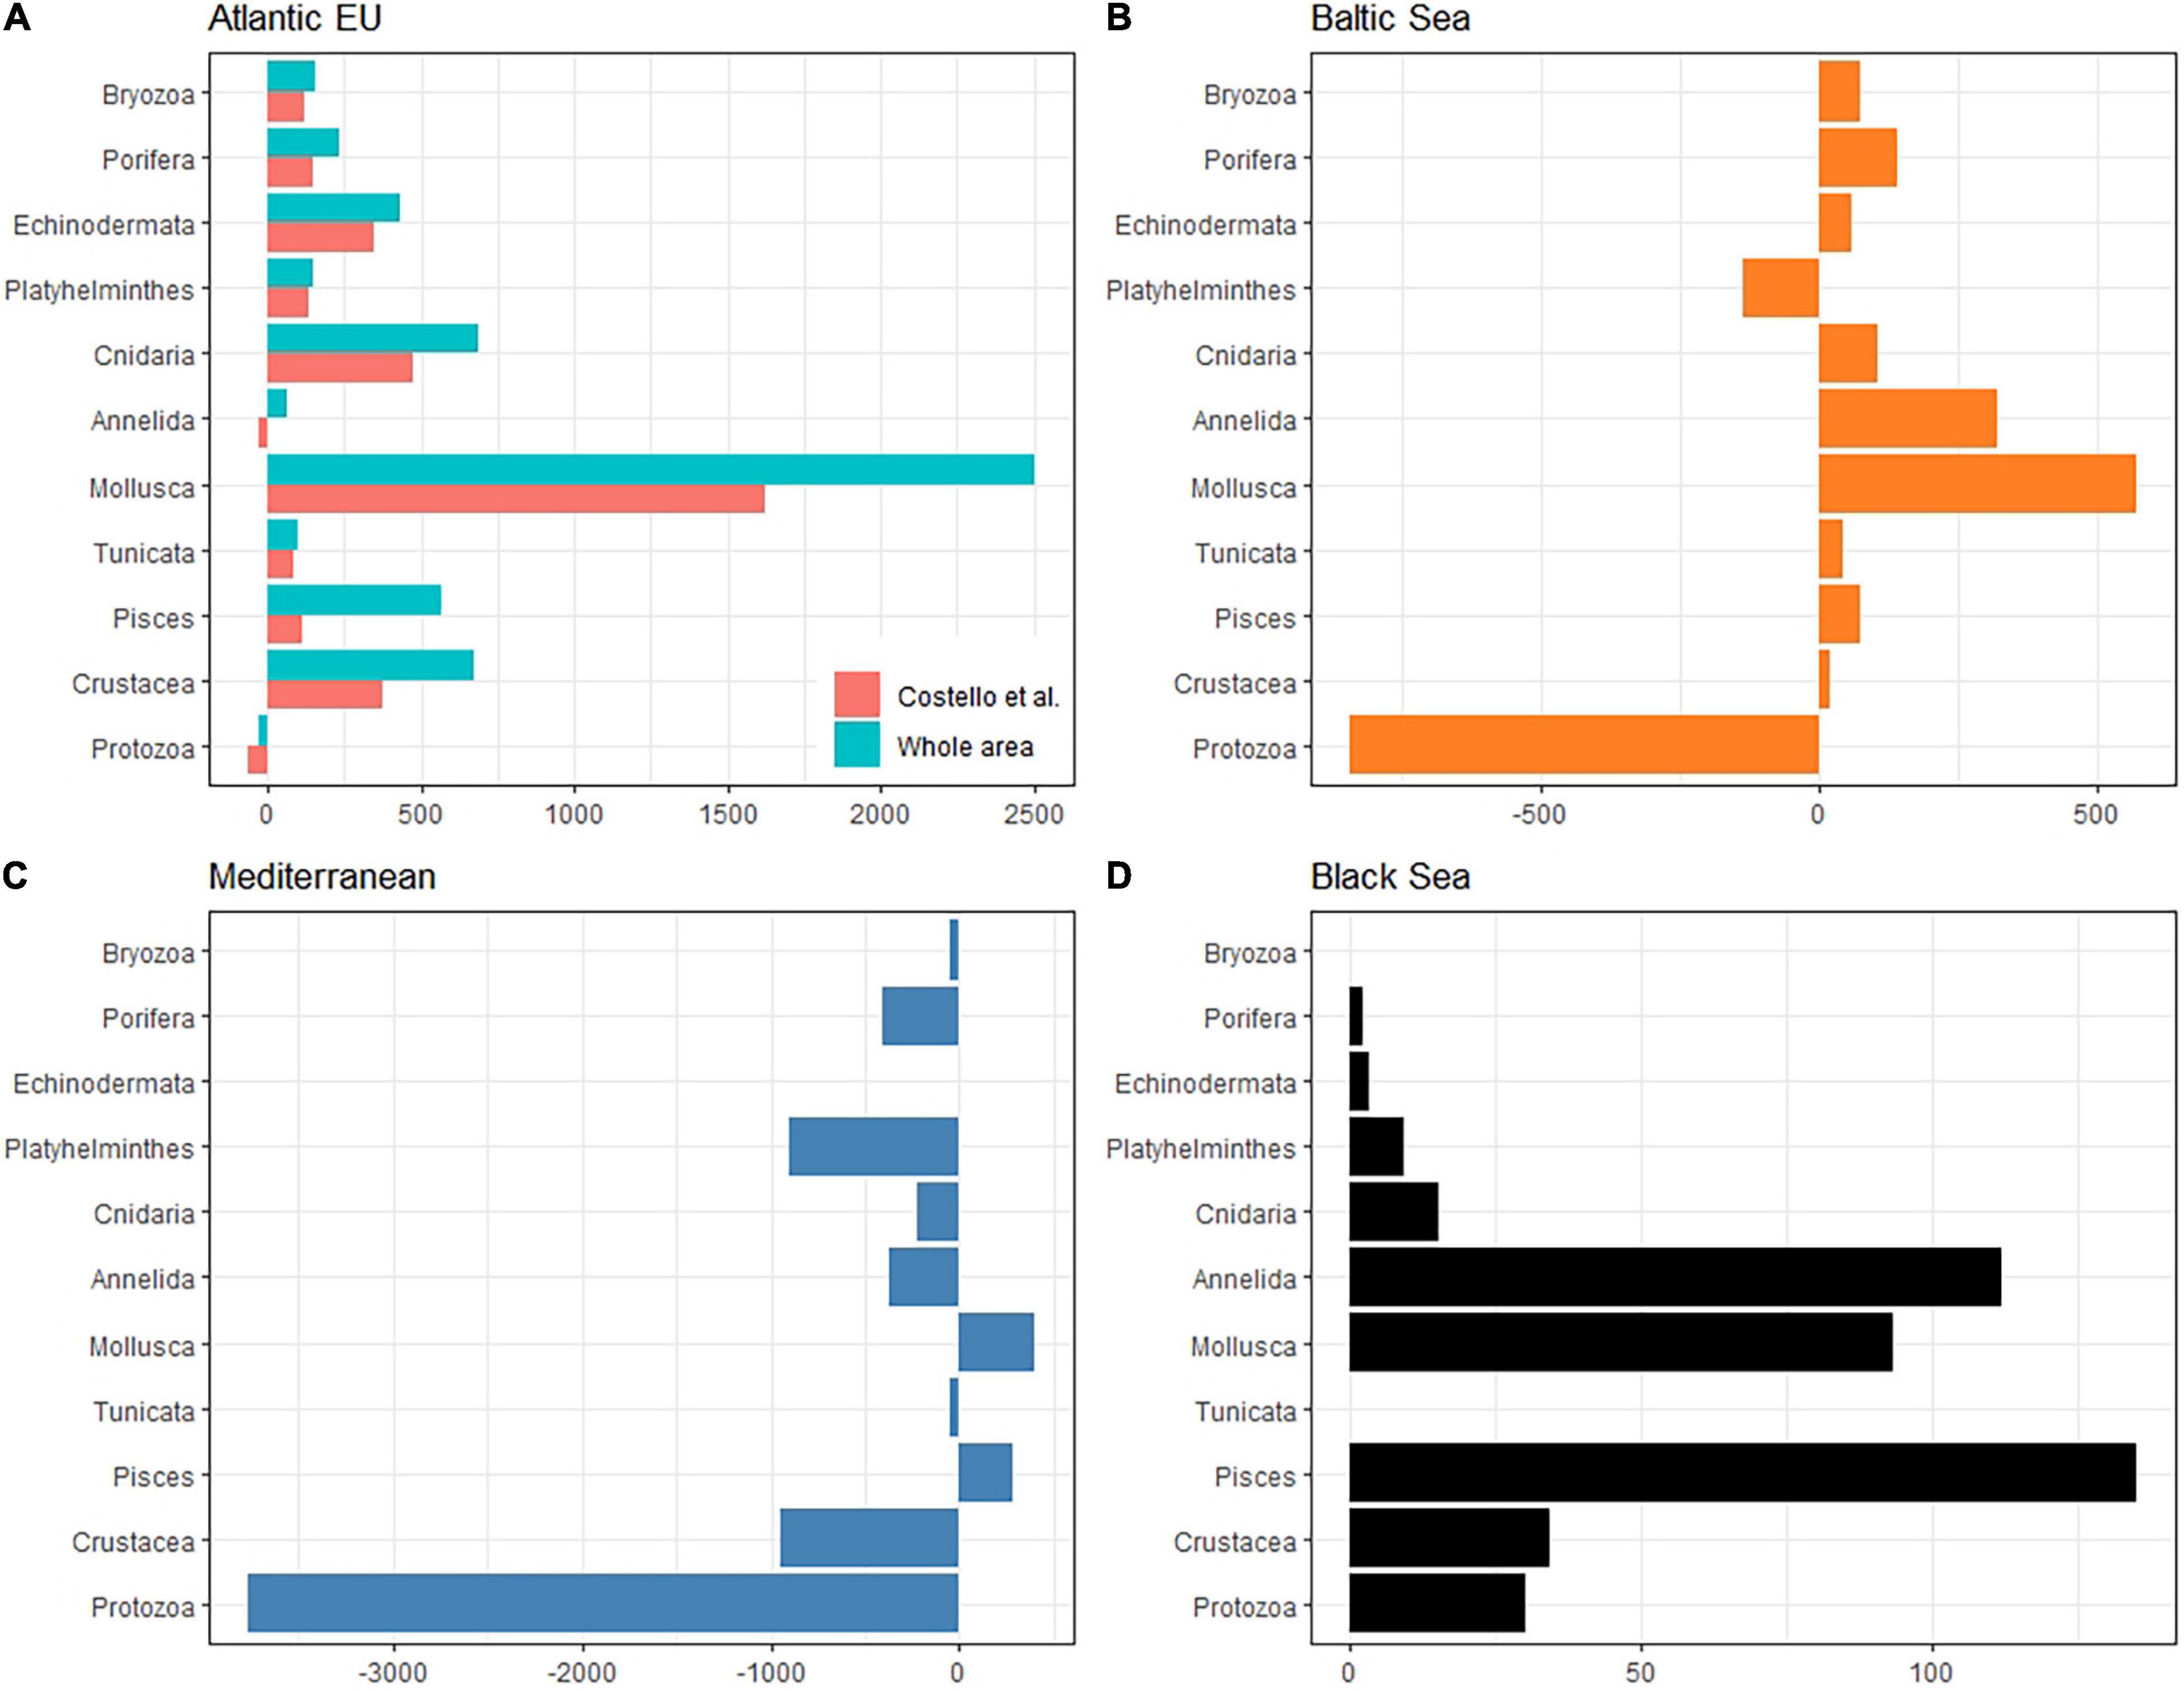
Figure 5. Bar plot showing the difference between the total number of species per taxa reported in GBIF with respect to analogous results from Costello et al. (2010). Comparisons have been made for the Atlantic EU (A), Mediterranean Sea (B), Black Sea (C), and Baltic Sea (D). Positive values indicate a higher number of species reported in GBIF. What we consider here as Atlantic EU (whole area) differs from Costello et al. (2010) in that we also include marine waters around the Macaronesia (including Azores, Madeira, and Canary Islands), and the northernmost Atlantic waters (see Figure 1). For comparative purposes, we also consider the same Atlantic EU area as Costello et al. (2010). Note also that Costello et al. (2010) did not report biodiversity data for the Black Sea.
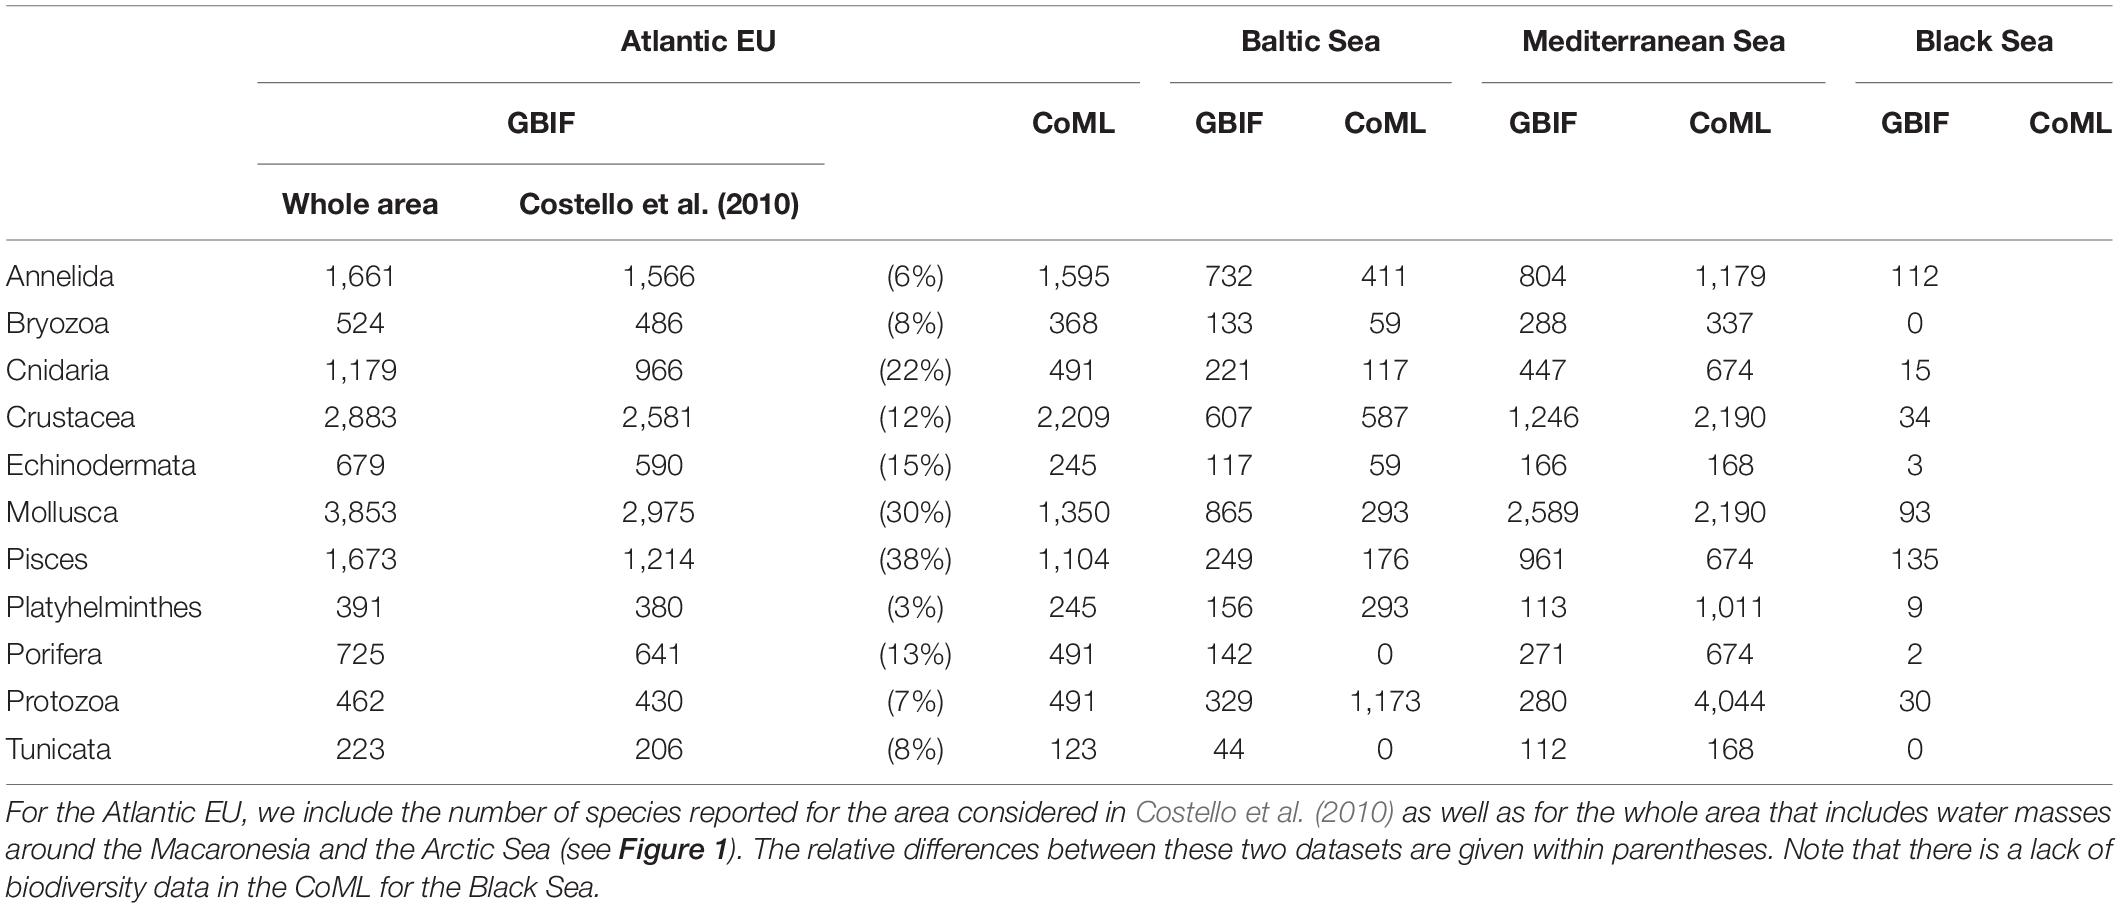
Table 2. Number of species per basin and taxa reported in GBIG and Costello et al. (2010) when analyzing biodiversity information from the Census of Marine Life (CoML).
For the Mediterranean Sea, we found a deficit in the number of species reported in GBIF, except for Mollusca and Pisces (Figure 5 and Table 2). The largest difference was found for the less conspicuous Protozoa. In the case of the Black Sea, no previous biodiversity information was reported in Costello et al. (2010), thus preventing from a comparative analysis. However, our results are still useful as an overview of the species richness and taxonomic completeness of open biodiversity data available on GBIF for this basin.
Top Contributors to Global Biodiversity Information Facility Datasets
The number of contributors to GBIF data differs among basins. However, the top 25 contributors represent ca. 90% of the total reported occurrences in the Atlantic EU and the Mediterranean Sea, and almost the 100% in the Baltic and the Black Seas (98 and 96%, respectively; Supplementary Table 2). The spectra for these relative contributions also differ among basins (Figure 6). For instance, the eight top contributors to reported occurrences in the Atlantic EU account for >60% of total occurrences. In contrast, the Swedish University of Agricultural Sciences (SLU) contributes alone to ca. 62% of reported occurrences in the Baltic Sea. In the Mediterranean Sea and the Black Sea, cumulative occurrences >60% are reached by the top three and four contributors, respectively (Figure 6 and Supplementary Table 2).
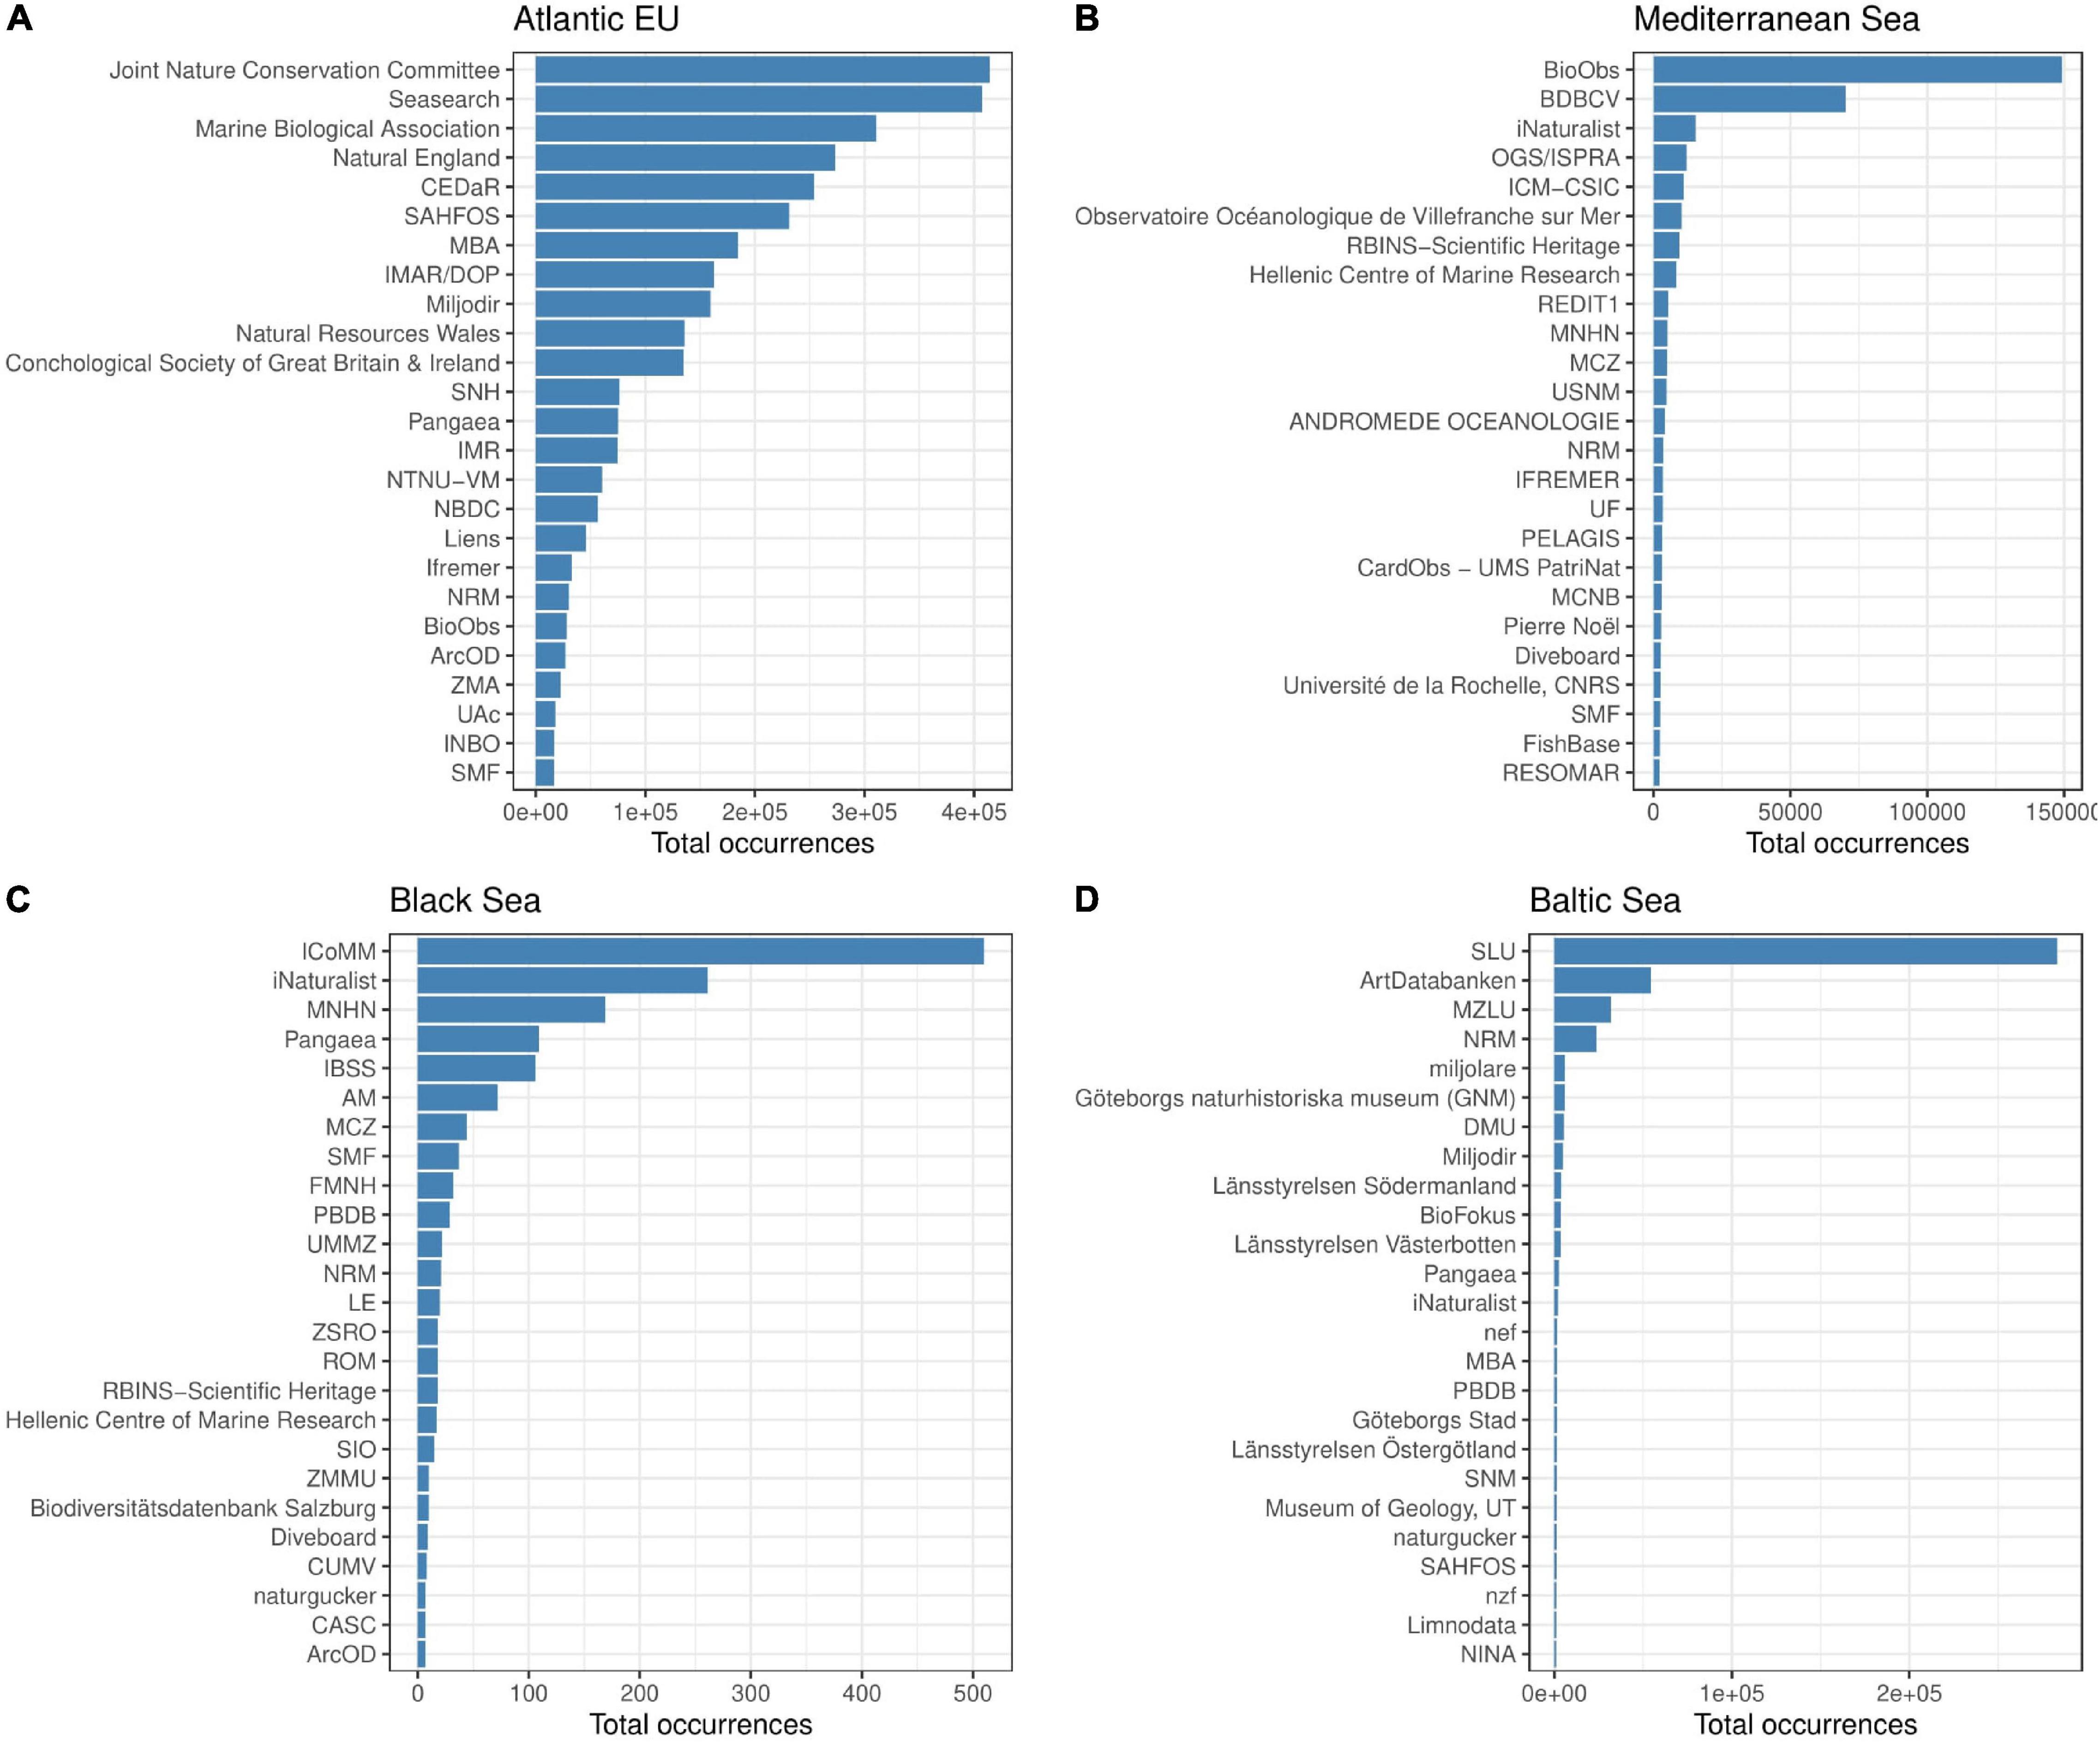
Figure 6. Bar plot showing the total number of occurrences reported by single Institutions for the basins considered in the study. Information on main contributors is provided for the Atlantic EU (A), Mediterranean Sea (B), Black Sea (C), and Baltic Sea (D). We focused on the top 25 contributors for visualization purposes. However, these top contributors account for most of the reported occurrences (ca. 90% in the Atlantic EU and the Mediterranean Sea, and almost 100% in the Baltic and the Black Seas, see Supplementary Table 2).
Discussion
Recent estimates suggest that ca. 48,000 marine species may exist in the European Seas, and that ca. 75% of them have been already described (Costello and Wilson, 2011). The proportion of species yet to be discovered here is, therefore, lower than elsewhere. Furthermore, most of these species’ occurrences are already publicly available in digital platforms such as GBIF (as revealed by our comparison between CoML and GBIF outputs), which may facilitate potential uses of online biodiversity databases. However, while this statement may hold true when considering the European Seas as a whole, we provide here solid evidence highlighting that available FAIR biodiversity data for the European Seas are not homogeneously distributed spatially, temporally, and taxonomically. Our assessments on the magnitudes and biases in different metrics of completeness of digitized biodiversity data with regard to these three dimensions are crucial for evaluating prospects for research and other applications and for prioritizing and monitoring activities to improve FAIR biodiversity datasets (Levin et al., 2014; Meyer et al., 2015, 2016b; Ball-Damerow et al., 2019).
Overall, our assessments on marine biodiversity showed a concentration of species in coastal waters, along with a northwestern-to-southeastern gradient of species richness, with most biodiversity hotspots occurring in the Atlantic basin and particularly in the North Sea, the coastal areas around the Scandinavian Peninsula and the United Kingdom. This general spatial trend widely concurs with those for previous biodiversity assessments (based on CoML) and may likely respond to analogous trends in marine productivity (Coll et al., 2010; Narayanaswamy et al., 2013). In agreement with previous assessments for the Mediterranean Sea, certain areas in the Alboran, Tyrrhenian, Adriatic, and Aegean Seas also emerged as important biodiversity hot spots likely due to the higher river and nutrient input, and the larger number of endemic species (Coll et al., 2010). Spatial patterns from GBIF biodiversity data also agree with previous assessments for the Atlantic Ocean showing that the northernmost and more productive Atlantic waters support also the higher species richness (Narayanaswamy et al., 2013). As an addition to these previous assessments, we also highlight certain inshore areas in the Macaronesia (including Azores, Madeira, and Canary Islands) as biodiversity hot spots.
Besides the ecological/environmental mechanisms underlying the spatial gradients in marine biodiversity, observed patterns may be also partially driven by the heterogeneous distribution of available data (driven by heterogeneous sampling effort and/or data mobilization) and the gaps in our knowledge of the biota (or the lack of information mobilization) along the southern and the eastern rims (Coll et al., 2010; Narayanaswamy et al., 2013; Levin et al., 2014). Indeed, our estimators on the sampling effort necessary to achieve a good representation of the species richness for a given area suggest that only a little proportion of the European Seas is well represented/studied, and that these well-studied areas concentrate in the North Sea, around United Kingdom and the North-westernmost areas of the Mediterranean Sea.
Socio-economic factors, such as proximity to research institutions, country participation in data-sharing networks, international cooperation, and financial resources (among others) may be driving detection, recording, or mobilization of biodiversity data into data-sharing networks (Meyer et al., 2015). Accordingly, most of the top contributors to marine biodiversity data for the European Seas are mainly based in high-income countries from North-western Europe. Hence, biodiversity data acquisition and mobilization are biased regionally, reflecting sparse efforts along the southern and easternmost marine areas.
Despite the spatial heterogeneity and the observed differences in the distribution of sampling effort and species richness, we observed a similar temporal trend in the reported number of occurrences among basins (with the exception of the Baltic Sea, for which the number of occurrences was consistently low throughout the last decades). In particular, we observed a steep increase in the number of reported occurrences from 1990s to 2000s coinciding with the digitalization of our society, the increase in Internet data traffic and the broad development of digital data-sharing platforms such as GBIF (note that GBIF was officially established in 20013). Overall, these increasing trends peaked in the earlies 2010s matching with the end of the CoML, and thus pointing to a massive mobilization of biodiversity data acquired during this multinational biodiversity assessment project. In the case of the Mediterranean Sea, a second, even larger peak occurred a few years later. After these peaks, the number of reported occurrences has been decreasing to date, with current numbers being similar to those reported in the 2000s. This could potentially weaken prospects for GBIF-based research and applications to marine conservation and monitoring of marine ecosystems. Indeed, monitoring biodiversity trends requires more than a single snapshot of the status and distribution of species (Boakes et al., 2010). Accordingly, high temporal coverage, i.e., continuous recording of species through time, is essential for monitoring species’ responses to environmental change, evaluating changes in biodiversity and to providing historical baselines (Whittaker et al., 2005; Boakes et al., 2010; Meyer et al., 2016b).
According to our proxy to the long-term taxonomical completeness (yearly and basin-specific Shannon index, H′), minor taxonomical biases should be expected for Atlantic EU and the Baltic Sea since the 1990s, matching with the steep increase in the number of recorded occurrences. However, while this statement may hold true for the whole basins, reported geographical biases may imply taxonomical biases at those areas or marine regions where sampling effort was relatively low. In the case of the Mediterranean Sea, we observed a gradual increase in H′ as a likely result of the inclusion of several taxa in GBIF records since the 2000s (i.e., Echinodermata, Porifera, and Bryozoa). This suggests an early taxonomical bias that may prevent from putting the status of the present-day biota into a proper historical context (Willis et al., 2007; Boakes et al., 2010). In the case of the Baltic Sea, the chaotic trend in H′ values suggests an unbalanced taxonomic sampling.
Taxonomical biases can prevent from biodiversity comparisons among areas and periods, and imply that completeness pattern of a single-taxon is a poor predictor for un-assessed taxa and highlights the need to identify taxon-specific information gaps (Vale and Jenkins, 2012; Meyer et al., 2015). These biases may be caused by species traits that affect detection and collection probabilities. For instance, more records might be available for early-described species, those that are more conspicuous and show higher abundances, or those that attract more scientific or public interest (Meyer et al., 2016a, and the references therein). Accordingly, previous assessments (based on CoML) revealed that the most conspicuous, abundant, and likely more “appealing” or “charismatic” species of mollusks, crustaceans, bryozoans, echinoderms, fish, and other vertebrates were the most well known in the European Seas (Narayanaswamy et al., 2013). Overall, these groups were also better represented in GBIF with respect to the CoML benchmark and the less conspicuous protozoans, annelids, and platyhelminths. However, this pattern contrasted for the worse sampled Mediterranean basin, where the number of species reported in GBIF was lower than those reported in CoML for most clades (particularly for the less conspicuous protozoans), with the only exceptions of mollusks and fish.
If we are to achieve a complete representation of our current ecosystems, biodiversity information must be comprehensive and not just focus on the most conspicuous or charismatic species, or those of greatest conservation concern (Boakes et al., 2010). In this regard is worth noting that very few institutions account for most of the occurrences available in GBIF. This is particularly true in the case of the Baltic Sea, where a single institution (SLU) contributes to more than 60% of reported occurrences. Biases by these top-contributing institutions toward particular taxa (e.g., research or conservation interest for target groups or species) may result, therefore, in GBIF taxonomical biases. Enlarging the number of contributors to GBIF and balancing their contributions may help to prevent taxonomical biases and increase completeness.
Information on species distributions in space and time is a central aspect of biodiversity knowledge that is needed for the effective management of biodiversity and associated ecosystem services in a rapidly changing world (Whittaker et al., 2005; Butchart et al., 2010; Levin et al., 2014). FAIR biodiversity data available in GBIF provide vital information about where and when species occur and are widely used in ecology, evolution, and conservation research (Ball-Damerow et al., 2019). This information has the potential to contribute and inform actions toward multiple research questions and conservation targets at the global level. This can be the case for the Sustainable Developed Goals adopted by all United Nations Member States and the Convention on Biological Diversity (CBD4) that call for a reduction in the rate of biodiversity loss and claim for the development of an advanced and shared biodiversity knowledge base. At the European level, open biodiversity data may also contribute to achieving the objectives of the Marine Strategy Framework Directive, as biological diversity is the first of the 11 descriptors of Good Environmental Status (GES) of the European marine waters. Examples of open biodiversity data uses toward these conservation targets may include marine spatial planning applications to minimize biodiversity loss through the improvement of networks of marine protected areas, safeguarding threatened species, and mapping and securing associated ecosystem services (Levin et al., 2014).
While acknowledging the potential of open biodiversity data, our assessments suggest that severe spatial, temporal, and taxonomical gaps and biases exist in FAIR biodiversity information, even for the comparatively well-known European Seas (see also Boakes et al., 2010; Jetz et al., 2012; Meyer et al., 2015); and these require careful consideration when developing conservation research and applications (Levin et al., 2014; Meyer et al., 2015; Ball-Damerow et al., 2019). For instance, the pervasive lack of biodiversity data for the south-easternmost marine areas (including the Black Sea) indicates that there are not sufficient occurrence (available) data to facilitate modeling approaches. Temporal biases in species occurrences toward the most recent decades may hamper our ability to monitor species’ and biodiversity’s responses to human impacts and environmental changes; whereas taxonomic biases toward the most conspicuous species may impede biodiversity comparisons across sites and periods. National to international join efforts aimed at generating and mobilizing biodiversity data should focus on data-deficient areas, periods, and taxa. These same recommendations could be extended to other, less studied marine regions in the world for which we should expect exacerbated spatial, temporal, and taxonomical biases in available FAIR biodiversity information. This will contribute to future modeling efforts toward building reliable and integrated marine assessments and digital twins of the oceans in general, and the European Seas, in particular.
Understanding the key driving factors of bias is important to prioritize activities in biodiversity data acquisition and mobilization. For instance, spatial distance to data-contributing institutions has been previously highlighted as one of the key drivers of spatial biases (Meyer et al., 2015). Together with the higher financial support to research in the northern, higher-income countries, this may contribute to explaining the northwestern-to-southeastern gradient in sampling effort and species richness in the European Seas. Overall, this may result in high levels of informational redundancy concentrated in a few northern places, often at the expenses of other, poorly known areas in the southern and eastern rims. While this extensive data availability may benefit local conservation efforts in the northern marine regions as well as many purely scientific endeavors, this can also trade off against global-scale data needs and integrative assessments required to support cost-effective progresses toward global biodiversity conservation (Meyer et al., 2015). An effective strategy for addressing these spatial gaps in FAIR biodiversity data may therefore lie in supporting international programs and cooperation, aimed at enhancing data acquisition and mobilization efforts in institutions nearby identified data gaps, and supporting participation in international data-sharing programs through direct partnerships or capacity building assistance (Meyer et al., 2015).
Further initiatives should also focus on preventing temporal biases by maintaining the necessary local and long-term logistics of field sampling, specimen processing (e.g., identification), and incorporation of data on global biodiversity information systems. Initiatives aimed at enhancing the identification and digitation of specimens in museum collections could also contribute to minimizing these biases in available FAIR biodiversity data (Ariño, 2010; Page et al., 2015; Ball-Damerow et al., 2019). In this regard, taxonomic work and support to taxonomists should remain also a priority, especially in the relatively poorly sampled non-vertebrates, because the utility of data-basing collections rests on the accuracy of the identifications and their taxonomical completeness (Graham et al., 2004). There is also much room for several large emerging economies including Russia or Turkey for addressing gaps in biodiversity data in poorly known areas for the eastern Mediterranean and the Black Sea. Success in building an adequate information basis for global biodiversity conservation and thus globally informed policies for environmental sustainability will depend on their support and may be determined by political rather than economic factors (Meyer et al., 2015). In addition to these geographical, social, economic, and political factors limiting or biasing the availability and accessibility of biodiversity data, limitations inherent to ongoing research/academic systems may also add to the critical caveat of applying digitized data in research and conservation. Research funding usually leading to peer-reviewed publications is not improving the ability to address biodiversity information gaps and biases as greatly as direct support for data mobilization programs (Meyer et al., 2015). This suggests that most of the strongest limiting factors of completeness affect digitization and mobilization of existing data rather than the actual collection of new records in the field. In part, this is because current data-archiving policies and academic reward systems do not favor data-sharing activities (Whitlock, 2011; Enke et al., 2012; Meyer et al., 2015). The recent expansion of data journals (Chavan and Penev, 2011), online platforms for reporting species occurrence observations (Pimm et al., 2015), and efforts over the past decade to digitize specimen records (Page et al., 2015), have resulted in a steep increase in the number of data papers and papers describing a new database over time (Ball-Damerow et al., 2019). However, there is still a long way to go for this type of scientific activity to be recognized in a similar way to “classic” research work when it comes to obtaining the necessary merits and academics rewards to be competitive in scholarships, job positions, and calls for funding research. Improved reward systems, new data publishing mechanisms, and journal and public funding agencies’ requirements aimed at making biodiversity data publicly available can incentivize both individual scientists and larger project teams to openly share biodiversity records (Whitlock, 2011; Enke et al., 2012; Meyer et al., 2015).
While biodiversity assessments led by trained field biologists will continue to play an important role in long-term monitoring of marine biodiversity as well as the creation of primary information for under-surveyed areas, novel approaches using digital data in active (e.g., citizen science; Chandler et al., 2017) or passive (iEcology and conservation culturomics; Ladle et al., 2016; Jarić et al., 2020a) ways are already providing increasingly valuable records for certain taxa at comparatively low cost (Hochachka et al., 2012; Jarić et al., 2020b).
Data Availability Statement
The datasets analyzed for this study can be found in the GBIF (www.gbif.org, accessed in June 2021) through different queries. Details on each query and associated DOIs are included in the article/Supplementary Table 1. Further inquiries can be directed to the corresponding author.
Author Contributions
All authors conceived the work and contributed substantially to the interpretation of results, and the writing, reviewing, and editing of the manuscript. JP, MC, and FR provided the funding. FR and VS extracted and analyzed the data. FR drafted the manuscript.
Funding
This work has been co-funded by the H2020 MINKE (Metrology for Integrated Marine Management and Knowledge-Transfer Network; grant agreement No. 101008724), the H2020 Cos4Cloud (co-designed citizen observatories for the European Open Science Cloud EOSC – Cos4Cloud; grant agreement No. 863463), and H2020-FutureMares (Climate Change and Future Marine Ecosystem Services and Biodiversity; grant agreement No. 869300), and the Spanish government through the “Severo Ochoa Center of Excellence” accreditation (grant agreement No. CEX2019-000928-S, hereafter SO). FR was supported by SO and VS by a “Juan de la Cierva Incorporación” research fellowship (grant agreement No. IJC2018-035389-I) granted by the Spanish Ministry of Science and Innovation.
Conflict of Interest
The authors declare that the research was conducted in the absence of any commercial or financial relationships that could be construed as a potential conflict of interest.
Publisher’s Note
All claims expressed in this article are solely those of the authors and do not necessarily represent those of their affiliated organizations, or those of the publisher, the editors and the reviewers. Any product that may be evaluated in this article, or claim that may be made by its manufacturer, is not guaranteed or endorsed by the publisher.
Acknowledgments
We thank Katia Cezón and Cristina Villaverde (GBIF Spain) for their valuable help during GBIF data extraction. We are also grateful to Carlos Veloy (ICM-CSIC) for reviewing a preliminary draft of the manuscript.
Supplementary Material
The Supplementary Material for this article can be found online at: https://www.frontiersin.org/articles/10.3389/fmars.2021.802235/full#supplementary-material
Footnotes
- ^ www.gbif.org, accessed in June 2021.
- ^ https://www.gbif.org/publisher/search
- ^ https://www.gbif.org/document/80661/gbif-memorandum-of-understanding
- ^ https://www.cbd.int
References
Ariño, A. H. (2010). Approaches to estimating the universe of natural history collections data. Biodiv. Inf. 7, 81–92. doi: 10.17161/bi.v7i2.3991
Ariño, A. H. (2018). Putting your finger upon the simplest data. BISS 2:e26300. doi: 10.3897/biss.2.26300
Ariño, A. H., Chavan, V., and Faith, D. P. (2013). Assessment of user needs of primary biodiversity data: analysis, concerns, and challenges. Biodiv. Inf. 8, 59–93. doi: 10.17161/bi.v8i2.4094
Ball-Damerow, J. E., Brenskelle, L., Barve, N., Soltis, P. S., Sierwald, P., Bieler, R., et al. (2019). Research applications of primary biodiversity databases in the digital age. PLoS One 14:e0215794. doi: 10.1371/journal.pone.0215794
Beaman, R., and Cellinese, N. (2012). Mass digitization of scientific collections: new opportunities to transform the use of biological specimens and underwrite biodiversity science. ZK 209, 7–17. doi: 10.3897/zookeys.209.3313
Boakes, E. H., McGowan, P. J. K., Fuller, R. A., Chang-qing, D., Clark, N. E., O’Connor, K., et al. (2010). Distorted views of biodiversity: spatial and temporal bias in species occurrence data. PLoS Biol. 8:e1000385. doi: 10.1371/journal.pbio.1000385
Boyce, D. G., Lotze, H. K., Tittensor, D. P., Carozza, D. A., and Worm, B. (2020). Future ocean biomass losses may widen socioeconomic equity gaps. Nat. Commun. 11:2235. doi: 10.1038/s41467-020-15708-9
Burrows, M. T., Schoeman, D. S., Buckley, L. B., Moore, P., Poloczanska, E. S., Brander, K. M., et al. (2011). The pace of shifting climate in marine and terrestrial ecosystems. Science 334, 652–655. doi: 10.1126/science.1210288
Butchart, S. H. M., Walpole, M., Collen, B., van Strien, A., Scharlemann, J. P. W., Almond, R. E. A., et al. (2010). Global biodiversity: indicators of recent declines. Science 328, 1164–1168. doi: 10.1126/science.1187512
Chandler, M., See, L., Copas, K., Bonde, A. M. Z., López, B. C., Danielsen, F., et al. (2017). Contribution of citizen science towards international biodiversity monitoring. Biol. Conserv. 213, 280–294. doi: 10.1016/j.biocon.2016.09.004
Chavan, V., and Penev, L. (2011). The data paper: a mechanism to incentivize data publishing in biodiversity science. BMC Bioinformatics 12:S2. doi: 10.1186/1471-2105-12-S15-S2
Coll, M., Piroddi, C., Albouy, C., Ben Rais Lasram, F., Cheung, W. W. L., Christensen, V., et al. (2012). The Mediterranean Sea under siege: spatial overlap between marine biodiversity, cumulative threats and marine reserves. Glob. Ecol. Biogeogr. 21, 465–480. doi: 10.1111/j.1466-8238.2011.00697.x
Coll, M., Piroddi, C., Steenbeek, J., Kaschner, K., Lasram, F. B. R., Aguzzi, J., et al. (2010). The biodiversity of the Mediterranean Sea: Estimates, patterns, and threats. PLoS One 5:e11842. doi: 10.1371/journal.pone.0011842
Costello, M. J., Coll, M., Danovaro, R., Halpin, P., Ojaveer, H., and Miloslavich, P. (2010). A census of marine biodiversity knowledge, resources, and future challenges. PLoS One 5:e12110. doi: 10.1371/journal.pone.0012110
Costello, M. J., and Wilson, S. P. (2011). Predicting the number of known and unknown species in European seas using rates of description: predicting species diversity. Glob. Ecol. Biogeogr. 20, 319–330. doi: 10.1111/j.1466-8238.2010.00603.x
Costello, M. J., Wilson, S. P., and Houlding, B. (2013). More taxonomists describing significantly fewer species per unit effort may indicate that most species have been discovered. Syst. Biol. 62, 616–624. doi: 10.1093/sysbio/syt024
Cuyvers, L., Berry, W., Gjerde, K. M., Thiele, T., and Wilhem, C. (2018). Deep Seabed Mining. Gland: IUCN.
Enke, N., Thessen, A., Bach, K., Bendix, J., Seeger, B., and Gemeinholzer, B. (2012). The user’s view on biodiversity data sharing — Investigating facts of acceptance and requirements to realize a sustainable use of research data —. Ecol. Inf. 11, 25–33. doi: 10.1016/j.ecoinf.2012.03.004
Graham, C. H., Ferrier, S., Huettman, F., Moritz, C., and Peterson, A. T. (2004). New developments in museum-based informatics and applications in biodiversity analysis. Trends Ecol. Evol. 19, 497–503. doi: 10.1016/j.tree.2004.07.006
Halpern, B. S., Frazier, M., Potapenko, J., Casey, K. S., Koenig, K., Longo, C., et al. (2015). Spatial and temporal changes in cumulative human impacts on the world’s ocean. Nat. Commun. 6:7615. doi: 10.1038/ncomms8615
Halpern, B. S., Walbridge, S., Selkoe, K. A., Kappel, C. V., Micheli, F., D’Agrosa, C., et al. (2008). A global map of human impact on marine ecosystems. Science 319, 948–952. doi: 10.1126/science.1149345
Hobern, D., Apostolico, A., Arnaud, E., Bello, J. C., Canhos, D., Dubois, G., et al. (2012). Global Biodiversity Informatics Outlook: Delivering Biodiversity Knowledge in the Information Age. Copenhagen: Global Biodiversity Information Facility.
Hochachka, W. M., Fink, D., Hutchinson, R. A., Sheldon, D., Wong, W.-K., and Kelling, S. (2012). Data-intensive science applied to broad-scale citizen science. Trends Ecol. Evol. 27, 130–137. doi: 10.1016/j.tree.2011.11.006
Hoegh-Guldberg, O., and Bruno, J. F. (2010). The impact of climate change on the world’s marine ecosystems. Science 328, 1523–1528. doi: 10.1126/science.1189930
IPCC (2014). Climate Change 2014: Synthesis Report. Contribution of Working Groups I, II and III to the Fifth Assessment Report of the Intergovernmental Panel on Climate Change. Geneva: IPCC.
Jarić, I., Correia, R. A., Brook, B. W., Buettel, J. C., Courchamp, F., Di Minin, E., et al. (2020a). iEcology: harnessing large online resources to generate ecological insights. Trends Ecol. Evol. 35, 630–639. doi: 10.1016/j.tree.2020.03.003
Jarić, I., Roll, U., Arlinghaus, R., Belmaker, J., Chen, Y., China, V., et al. (2020b). Expanding conservation culturomics and iEcology from terrestrial to aquatic realms. PLoS Biol. 18:e3000935. doi: 10.1371/journal.pbio.3000935
Jetz, W., McPherson, J. M., and Guralnick, R. P. (2012). Integrating biodiversity distribution knowledge: toward a global map of life. Trends Ecol. Evol. 27, 151–159. doi: 10.1016/j.tree.2011.09.007
Katsanevakis, S., Levin, N., Coll, M., Giakoumi, S., Shkedi, D., Mackelworth, P., et al. (2015). Marine conservation challenges in an era of economic crisis and geopolitical instability: the case of the Mediterranean Sea. Mar. Policy 51, 31–39. doi: 10.1016/j.marpol.2014.07.013
Keating, K. A., and Quinn, J. F. (1998). Estimating species richness: the Michaelis-Menten Model revisited. Oikos 81, 411–416. doi: 10.2307/3547060
Ladle, R. J., Correia, R. A., Do, Y., Joo, G.-J., Malhado, A. C., Proulx, R., et al. (2016). Conservation culturomics. Front. Ecol. Environ. 14:269–275. doi: 10.1002/fee.1260
Landrigan, P. J., Stegeman, J. J., Fleming, L. E., Allemand, D., Anderson, D. M., Backer, L. C., et al. (2020). Human health and ocean pollution. Ann. Glob. Health 86:151. doi: 10.5334/aogh.2831
Levin, N., Coll, M., Fraschetti, S., Gal, G., Giakoumi, S., Göke, C., et al. (2014). Biodiversity data requirements for systematic conservation planning in the Mediterranean Sea. Mar. Ecol. Prog. Ser. 508, 261–281. doi: 10.3354/meps10857
Longino, J. T., Coddington, J., and Colwell, R. K. (2002). The ant fauna of a tropical rain forest: estimating species richness three different ways. Ecology 83, 689–702. doi: 10.1890/0012-9658(2002)083[0689:tafoat]2.0.co;2
Maldonado, C., Molina, C. I., Zizka, A., Persson, C., Taylor, C. M., Albán, J., et al. (2015). Estimating species diversity and distribution in the era of Big Data: To what extent can we trust public databases? Glob. Ecol. Biogeogr. 24, 973–984. doi: 10.1111/geb.12326
Meyer, C., Jetz, W., Guralnick, R. P., Fritz, S. A., and Kreft, H. (2016a). Range geometry and socio-economics dominate species-level biases in occurrence information. Glob. Ecol. Biogeogr. 25, 1181–1193. doi: 10.1111/geb.12483
Meyer, C., Weigelt, P., and Kreft, H. (2016b). Multidimensional biases, gaps and uncertainties in global plant occurrence information. Ecol. Lett. 19, 992–1006. doi: 10.1111/ele.12624
Meyer, C., Kreft, H., Guralnick, R., and Jetz, W. (2015). Global priorities for an effective information basis of biodiversity distributions. Nat. Commun. 6:8221. doi: 10.1038/ncomms9221
Micheli, F., Halpern, B. S., Walbridge, S., Ciriaco, S., Ferretti, F., Fraschetti, S., et al. (2013). Cumulative human impacts on Mediterranean and Black Sea marine ecosystems: assessing current pressures and opportunities. PLoS One 8:e79889. doi: 10.1371/journal.pone.0079889
Narayanaswamy, B. E., Coll, M., Danovaro, R., Davidson, K., Ojaveer, H., and Renaud, P. E. (2013). Synthesis of knowledge on marine biodiversity in European Seas: from census to sustainable management. PLoS One 8:e58909. doi: 10.1371/journal.pone.0058909
Narayanaswamy, B. E., Renaud, P. E., Duineveld, G. C. A., Berge, J., Lavaleye, M. S. S., Reiss, H., et al. (2010). Biodiversity trends along the western European margin. PLoS One 5:e14295. doi: 10.1371/journal.pone.0014295
Ojaveer, H., Jaanus, A., MacKenzie, B. R., Martin, G., Olenin, S., Radziejewska, T., et al. (2010). Status of biodiversity in the Baltic Sea. PLoS One 5:e12467. doi: 10.1371/journal.pone.0012467
Page, L. M., MacFadden, B. J., Fortes, J. A., Soltis, P. S., and Riccardi, G. (2015). Digitization of biodiversity collections reveals biggest data on biodiversity. Bioscience 65, 841–842. doi: 10.1093/biosci/biv104
Pimm, S. L., Alibhai, S., Bergl, R., Dehgan, A., Giri, C., Jewell, Z., et al. (2015). Emerging technologies to conserve biodiversity. Trends Ecol. Evol. 30, 685–696. doi: 10.1016/j.tree.2015.08.008
Pinsky, M. L., Reygondeau, G., Caddell, R., Palacios-Abrantes, J., Spijkers, J., and Cheung, W. W. L. (2018). Preparing ocean governance for species on the move. Science 360, 1189–1191. doi: 10.1126/science.aat2360
Pyke, G. H., and Ehrlich, P. R. (2010). Biological collections and ecological/environmental research: a review, some observations and a look to the future. Biol. Rev. 85, 247–266. doi: 10.1111/j.1469-185X.2009.00098.x
R Core Team (2021). R: A Language and Environment for Statistical Computing. Vienna: R Foundation for Statistical Computing.
Ramírez, F., Afán, I., Davis, L. S., and Chiaradia, A. (2017). Climate impacts on global hot spots of marine biodiversity. Sci. Adv. 3:e1601198. doi: 10.1126/sciadv.1601198
Rockström, J., Steffen, W., Noone, K., Persson, Å., Chapin, F. S., Lambin, E. F., et al. (2009). A safe operating space for humanity. Nature 461, 472–475. doi: 10.1038/461472a
Ruete, A. (2015). Displaying bias in sampling effort of data accessed from biodiversity databases using ignorance maps. BDJ 3:e5361. doi: 10.3897/BDJ.3.e5361
Steffen, W., Persson, Å., Deutsch, L., Zalasiewicz, J., Williams, M., Richardson, K., et al. (2011). The Anthropocene: from global change to planetary stewardship. AMBIO 40, 739–761. doi: 10.1007/s13280-011-0185-x
Sullivan, B. L., Aycrigg, J. L., Barry, J. H., Bonney, R. E., Bruns, N., Cooper, C. B., et al. (2014). The eBird enterprise: an integrated approach to development and application of citizen science. Biol. Conserv. 169, 31–40. doi: 10.1016/j.biocon.2013.11.003
Vale, M. M., and Jenkins, C. N. (2012). Across-taxa incongruence in patterns of collecting bias: correspondence. J. Biogeogr. 39, 1744–1748. doi: 10.1111/j.1365-2699.2012.02750.x
Whitlock, M. C. (2011). Data archiving in ecology and evolution: best practices. Trends Ecol. Evol. 26, 61–65. doi: 10.1016/j.tree.2010.11.006
Whitmee, S., Haines, A., Beyrer, C., Boltz, F., Capon, A. G., Dias, B. F., et al. (2015). Safeguarding human health in the Anthropocene epoch: report of The Rockefeller Foundation–Lancet Commission on planetary health. Lancet 386, 1973–2028. doi: 10.1016/S0140-6736(15)60901-1
Whittaker, R. J., Araújo, M. B., Jepson, P., Ladle, R. J., Watson, J. E. M., and Willis, K. J. (2005). Conservation Biogeography: assessment and prospect. Divers. Distrib. 11, 3–23. doi: 10.1111/j.1366-9516.2005.00143.x
Willis, K. J., Araújo, M. B., Bennett, K. D., Figueroa-Rangel, B., Froyd, C. A., and Myers, N. (2007). How can a knowledge of the past help to conserve the future? Biodiversity conservation and the relevance of long-term ecological studies. Philos. Trans. R. Soc. B Biol. Sci. 362, 175–187. doi: 10.1098/rstb.2006.1977
Keywords: biodiversity assessments, Census of Marine Life, completeness, European Seas, GBIF, open biodiversity data, FAIR principles
Citation: Ramírez F, Sbragaglia V, Soacha K, Coll M and Piera J (2022) Challenges for Marine Ecological Assessments: Completeness of Findable, Accessible, Interoperable, and Reusable Biodiversity Data in European Seas. Front. Mar. Sci. 8:802235. doi: 10.3389/fmars.2021.802235
Received: 26 October 2021; Accepted: 16 December 2021;
Published: 27 January 2022.
Edited by:
Paolo Favali, European Multidisciplinary Seafloor and Water Column Observatory, ERIC Foundation, ItalyReviewed by:
Dimitris Poursanidis, Foundation for Research and Technology Hellas (FORTH), GreeceAlvar Carranza, Universidad de la República, Uruguay
Copyright © 2022 Ramírez, Sbragaglia, Soacha, Coll and Piera. This is an open-access article distributed under the terms of the Creative Commons Attribution License (CC BY). The use, distribution or reproduction in other forums is permitted, provided the original author(s) and the copyright owner(s) are credited and that the original publication in this journal is cited, in accordance with accepted academic practice. No use, distribution or reproduction is permitted which does not comply with these terms.
*Correspondence: Francisco Ramírez, ramirez@icm.csic.es