Facilitating Salt Marsh Restoration: The Importance of Event-Based Bed Level Dynamics and Seasonal Trends in Bed Level Change
 Pim W. J. M. Willemsen1,2*
  Erik M. Horstman1
  Tjeerd J. Bouma3
  Martin J. Baptist4,5
  Marinka E. B. van Puijenbroek4
  Bas W. Borsje1
- 1Water Engineering and Management, University of Twente, Enschede, Netherlands
- 2Department of Ecosystems and Sediment Dynamics, Deltares, Delft, Netherlands
- 3Department of Estuarine and Delta Systems, NIOZ Royal Netherlands Institute for Sea Research, Utrecht University, Yerseke, Netherlands
- 4Wageningen Marine Research, Wageningen University & Research, Den Helder, Netherlands
- 5Aquatic Ecology and Water Quality Management Group, Wageningen University & Research, Wageningen, Netherlands
Intertidal salt marshes provide a range of valuable ecosystem services which typically increase with marsh width. Understanding the drivers for salt marsh expansion versus retreat is thus key to managers. Previous research highlights the influence of short-term (daily/event) bed level dynamics on germination and establishment and subsequent vegetation presence. However, more recent literature suggests the importance of medium-term seasonal bed level dynamics on viable seed availability and subsequent vegetation presence. This study aims to assess event-based and seasonal bed level dynamics for vegetation presence in natural and semi-natural salt marshes and to provide generic thresholds for vegetation presence. To gain insight into bed level dynamics, data was used from autonomous Optical and Acoustic Surface Elevation Dynamics sensors (O-SED and A-SED) around the edge of natural and semi-natural salt marshes. Sensors were installed at vegetated and unvegetated measurement station Field observations from 22 O-SEDs deployed at 4 well-established natural salt marshes in the Western Scheldt estuary and 4 O-SEDs at a well-established semi-natural salt marsh in the Wadden Sea were reanalyzed. Six novel A-SEDs were deployed at a pioneer semi-natural salt marsh in the Ems-Dollard Estuary. The measurement duration at all salt marshes was at least 1 year. The A-SED sensor was successfully validated against manual measurements. Furthermore, vegetation data and water level data were obtained. No significant difference was observed between natural and semi-natural salt marshes. However, a significant difference between vegetated and unvegetated measurement stations for short-term bed level dynamics was observed. Vegetation was found to be present at locations restricted by short-term bed level variability smaller than or equal to 12 mm, emphasizing the presence of a short-term threshold. Although trends in the non-growing season were significantly different between vegetated and unvegetated stations, seasonal thresholds for vegetation presence were not found. The findings imply that knowledge of bed level-dynamics in well-established natural marshes can be used to predict vegetation presence in constructed semi-natural marshes. The importance of local short-term dynamics for vegetation presence instead of longer-term dynamics highlights possibilities for developing favorable conditions for vegetation presence in marsh restoration projects and the construction of new salt marsh ecosystems.
Introduction
Salt marshes have proven to deliver a range of valuable ecosystem services, like providing habitats to unique flora and fauna, carbon sequestration and coastal protection by wave attenuation (e.g., Duarte et al., 2013; Möller et al., 2014; Zhu et al., 2020). More recently, the long-term coastal protection services of salt marsh size has been quantified, by analyzing the relations between the width of the salt marsh and its wave attenuating capacity through time (Willemsen et al., 2018; Vuik et al., 2019). Such long-term analyses are needed for the successful implementation of salt marshes as nature-based solutions (NbS) in coastal management, as coastal defense schemes are built to last for decades (Borsje et al., 2011; Temmerman et al., 2013). Long-term (years to decades) lateral dynamics of the marsh edge that determine the width of a marsh via marsh expansion or retreat (Harmsworth and Long, 1986; Van der Wal et al., 2008) have been related to various factors. For example, at the large-scale marsh expansion and retreat has been related to changes in sea level (Allen, 2000), changes in wind and waves (Schwimmer, 2001; van der Wal and Pye, 2004), channel deepening and migration (Pringle, 1995; Pye, 1995; Cox et al., 2003), sediment supply (Ladd et al., 2019) and sedimentation and erosion processes (van der Wal et al., 2002). At a local scale the lateral dynamics of the marsh edge have been related to factors such as seed availability (Rand, 2000; van Regteren et al., 2017, 2020b) short-term sediment dynamics (Bouma et al., 2016; Willemsen et al., 2018) and soil properties (Wolters and Bakker, 2002).
Wave attenuation by marshes, as well as the buildup of the marsh soil, critically depends on the density of the vegetation (e.g., Barbier et al., 2008; Bouma et al., 2014). The establishment of pioneer plants is the first stage of making the environment more suitable for subsequent plant colonization and marsh development by locally decreasing hydrodynamic energy (van Regteren et al., 2020a). However, vegetation can only colonize locations where, amongst other factors, hydrodynamic forces and morphodynamic stresses remain below certain critical thresholds (Balke et al., 2016; Bouma et al., 2016). That is, given fulfillment of local biological conditions such as seed availability, an inundation-free period is required for initial establishment, followed by a calm period with rather low waves and limited bed level dynamics for subsequent growth (Hu et al., 2015b; Cao et al., 2018; Poppema et al., 2019), which is described as a Window of Opportunity (WoO; Balke et al., 2014). These WoOs capture the first weeks/months of vegetation establishment and growth (Cao et al., 2019; Poppema et al., 2019). The WoO theory is primarily focused on the growing season during which the seedlings establish (Balke et al., 2014). In addition to the growing season, year-round (including the non-growing season) bed level change has been observed to be an important factor in driving the lateral dynamics of the salt marsh edge (Willemsen et al., 2018; van Regteren et al., 2019). Extending on the WoO theory, these studies suggest that year-round disturbances are also important for the presence of vegetation.
Semi-natural salt marshes are marshes that are (partly) created by humans for their ecosystem services. They often consist of intertidal areas that are made suitable for vegetation establishment by engineering measures that reduce local disturbances. However, initial conditions differ, depending on the design and construction methods applied. For example, semi-natural marshes can be obtained by artificially elevating the intertidal area with dredged sediments (Ford et al., 1999; Schrift et al., 2008) and/or by reducing hydrodynamic and morphodynamic stresses by adding wave-attenuating structures (Baptist et al., 2021). Although the number of semi-natural (constructed) salt marshes is increasing (Maris et al., 2007; Mazik et al., 2007; Temmerman et al., 2013; Rahman et al., 2019), biophysical data on constructed salt marshes remain scarce. While daily to seasonal morphodynamics have been observed to drive the lateral location of the marsh edge in natural salt marshes (e.g., Bouma et al., 2016; Willemsen et al., 2018), observations of similar dynamics in constructed salt marshes are lacking. To be able to efficiently create constructed salt marshes for their ecosystem services, it is key to quantify morphodynamics and vegetation presence, and to compare those dynamics with those observed in natural salt marshes. We hypothesize that event-driven (short-term) and seasonal (medium-term) bed level dynamics do not differ between natural and semi-natural constructed salt marshes.
Continuous monitoring of bed level dynamics is required to enable the quantification of morphodynamics at a temporal resolution of hours, associated with the impacts of storm events. Simultaneously, these morphodynamics need to be monitored for a duration of multiple seasons to years to uncover seasonal bed level dynamics. Periodic bed level changes have been monitored extensively, by manual monitoring techniques using erosion pins (Stokes et al., 2010), steel reference plates (Andersen et al., 2006), sediment traps (Moskalski and Sommerfield, 2012), accretion poles (O’Brien et al., 2000) and sedimentation-erosion bars (Baptist et al., 2019). However, the use of autonomous systems (such as the Photo-Electronic Erosion Pin) to monitor bed level dynamics at a high temporal resolution (hours) over periods of seasons to years remains scarce due to instrument limitations and costs (Lawler, 2008; Hu et al., 2015a). More recently, the Optical Surface Elevation Dynamics sensor (O-SED) was developed and applied for continuous monitoring of bed level dynamics in the intertidal area, when the sensor is not submerged, at a temporal resolution of hours and for a duration of multiple months (Hu et al., 2017, 2020; Willemsen et al., 2018). This instrument was further developed into an Acoustic Surface Elevation Dynamics (A-SED) sensor, now able to capture bed level change when submerged.
In this study, we used data of both O-SED (26) and novel A-SED (6) sensors around the edge of natural and semi-natural salt marshes in order (1) to assess the magnitude of event-based and seasonal bed level dynamics in natural and semi-natural (constructed) salt marshes and (2) to identify generic thresholds of event-based and seasonal bed level dynamics for vegetation presence, both in natural and semi-natural salt marshes. These thresholds quantify maximum accretion and/or erosion vegetation around the salt marsh edge can withstand. The structure of this paper is as follows. In section “Materials and Methods” the study sites are introduced, followed by a description of the state-of-the-art instruments deployed for year-round field data collection of high-resolution bed level dynamics. Section “Results” presents the results of data analyses based on the collected field data and quantifies the bed level change limits for vegetation growth across the study sites. In section “Discussion” the main findings of this paper are discussed, followed by the main conclusions in section “Conclusion.”
Materials and Methods
Study Sites
The study sites are located around the North Sea coast of the Netherlands at the Western Scheldt estuary, Wadden Sea and Ems-Dollard estuary (Figure 1). Field data were previously collected at four natural salt marshes in the Western Scheldt, that have been thriving for decades and at one artificial semi-natural salt marsh in the Wadden Sea with brushwood structures also existing for decades (Willemsen et al., 2018, 2020). This data was reanalyzed. State-of-the-art A-SED sensors were deployed at a second semi-natural salt marsh in the Ems-Dollard Estuary that has been constructed in 2018 by creating an elevated bed protected by brushwood structures.
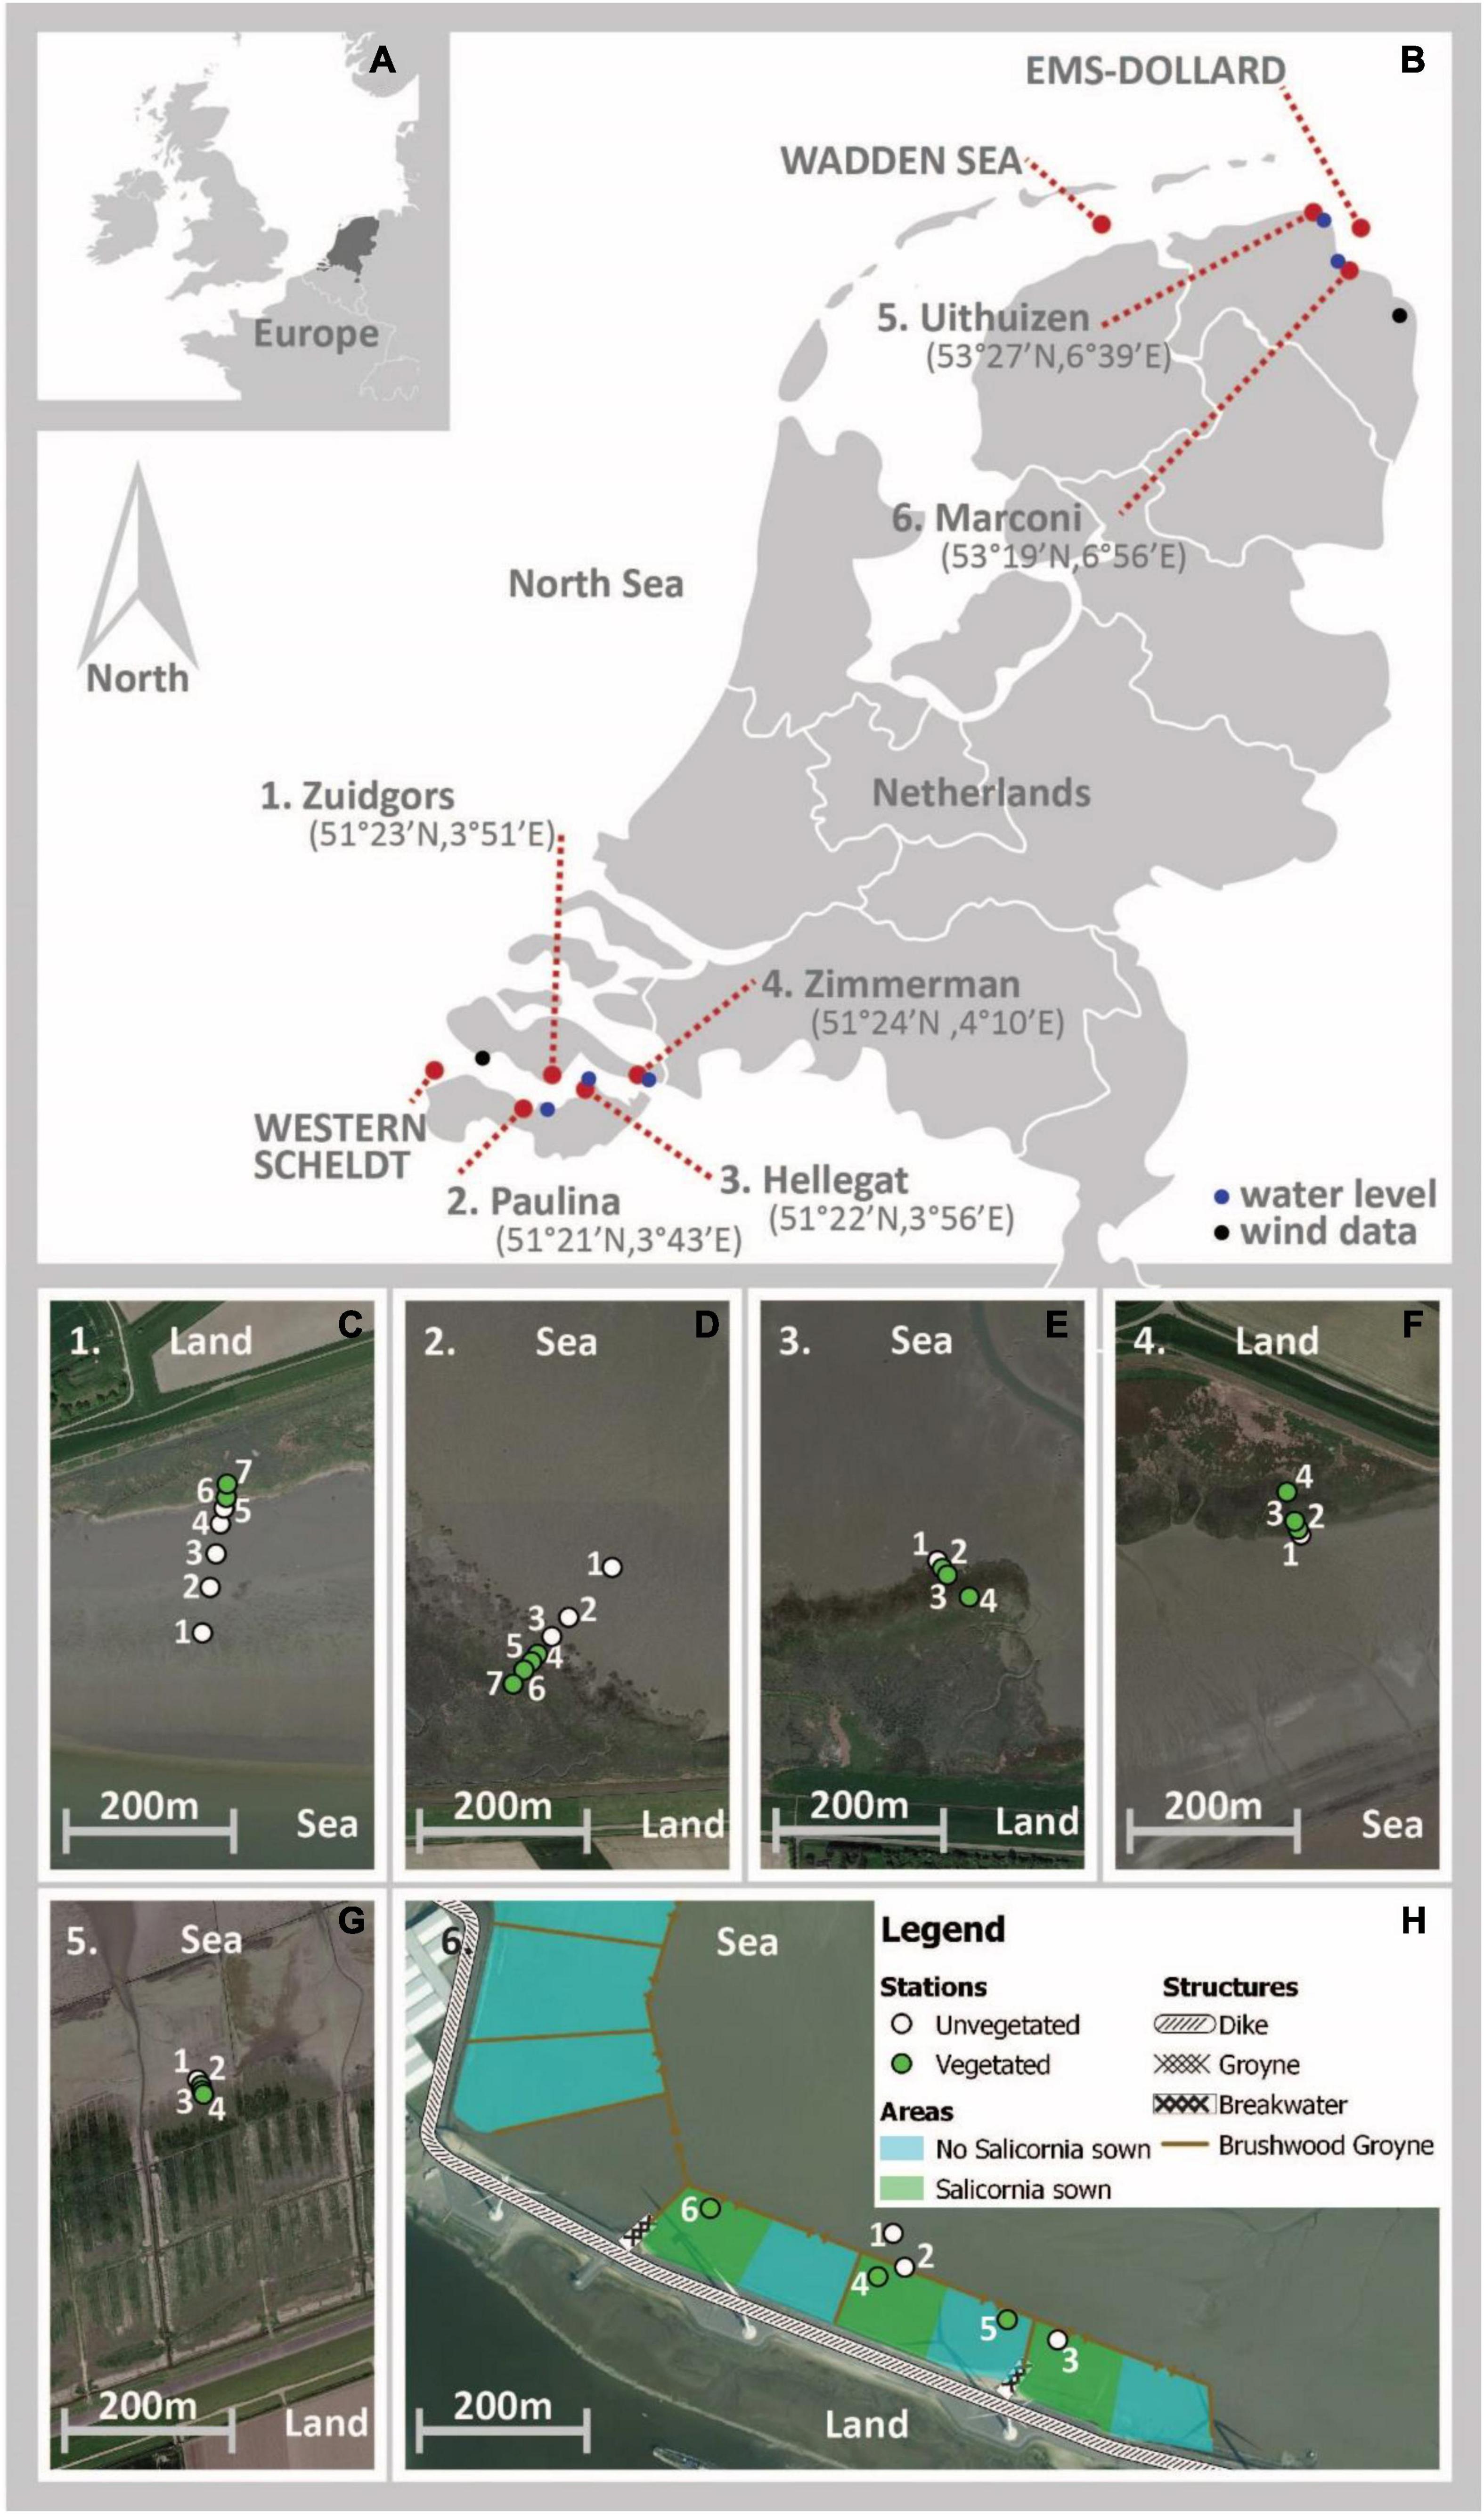
Figure 1. Study sites around the North Sea area (A) indicated with a red dot (B). Locations where water levels were continuously monitored are indicated with a blue dot and the location were wind data were collected is indicated with a black dot (B). The measurement stations (numbered) for bed level dynamics are marked with green (vegetated) and white (unvegetated) dots for each of the study sites (C–H). Source of background maps (C–G) is Google Maps, source of background map (H) is MapTiler and OpenStreetMap contributors.
Natural Salt Marshes
The four natural salt marsh sites are located in the Western Scheldt estuary, which is located in the southwestern delta of the Netherlands (51°20′N; 4°E; Figure 1 and Table 1). Two sites, Zuidgors Hellegat and Zimmerman, are located at the northern shores of the Western Scheldt, approximately 20 and 50 km from the mouth of the estuary, respectively. The other two sites in the Western Scheldt, Paulina and Hellegat, are located at the southern shores, approximately 15 and 27 km from the mouth, respectively. The sites at the northern shore are exposed, whereas the sites at the southern shore are more sheltered from the prevailing south-westerly winds (Callaghan et al., 2010). The sites Zuidgors and Paulina, are saline at 20–25 psu, whereas the two study sites further inland, Hellegat and Zimmerman, are brackish at 15–20 psu (Damme et al., 2005). The mesotidal to macrotidal Western Scheldt estuary is tide dominated with a semi-diurnal tide (Baeyens et al., 1997). The spring tidal range at Paulina, the study site closest to the mouth of the Western Scheldt estuary, is approximately 4.4 m and increases to 5.5 m at Zimmerman, the study site closest to the landward boundary of the estuary (Van der Wal et al., 2008). The grain size of the top layer of the bed (D50) varied between 18 and 132 μm (Willemsen et al., 2018; Table 1). In the more saline marshes in the west of the estuary, pioneer species such as perennial common cord grass (Spartina anglica) and the annual glasswort (Salicornia spp.) are occurring. Well-established vegetation, such as common saltmarsh grass (Puccinellia maritima), annual seablite (Suaeda maritima), and sea aster (Aster tripolium) are occurring higher in those marshes. At the most eastern, more brackish study sites, well-established seaside bulrush (Bolboschoenus maritimus) and common reed (Phragmites australis) are occurring as well as common cordgrass (Spartina spp.) (Van der Wal et al., 2008).
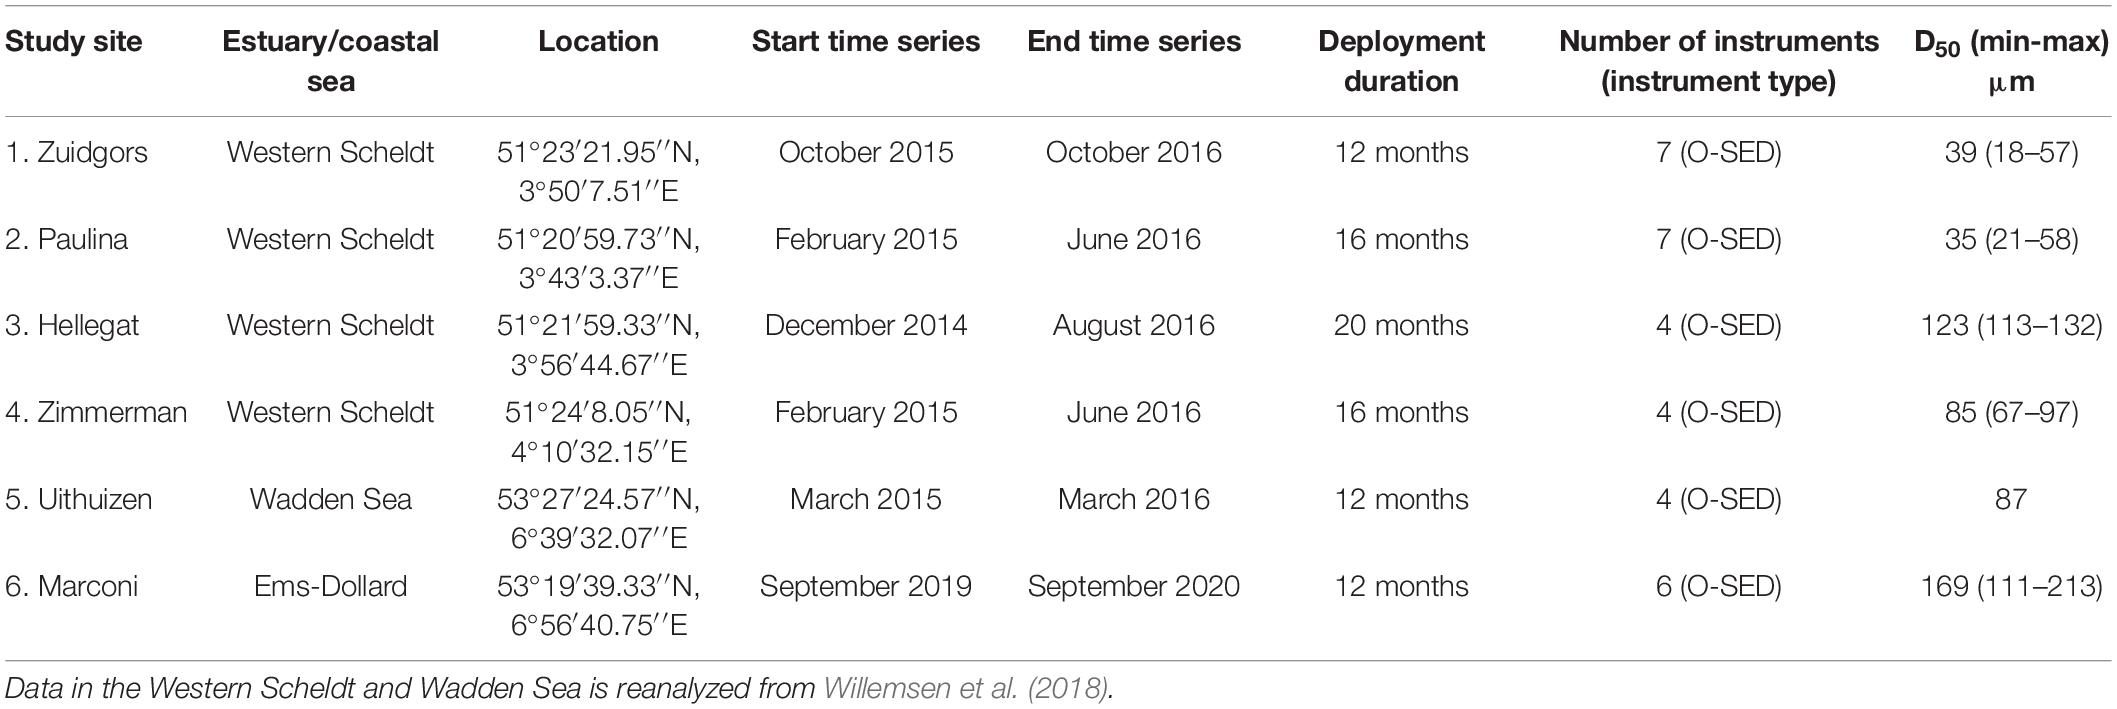
Table 1. Collection of bed level dynamics data using O-SED and A-SED sensors.
Semi-Natural Salt Marshes
The two semi natural salt marshes are located in the Wadden Sea and Ems-Dollard estuary. The semi-natural salt marsh site Uithuizen is located in the Wadden Sea area, close to the mouth of the Ems-Dollard estuary (53°27′N, 6°39′E; Figure 1 and Table 1). The Wadden Sea is a mesotidal to macrotidal estuary (Dieckmann et al., 1987), with a tidal range of approximately 3.0 m at Uithuizen. The salinity near Uithuizen is approximately 30 psu (Zimmerman, 1976; Ysebaert et al., 2016). The D50 at the study site was approximately 87 μm (Folmer et al., 2017; Table 1). Salt marsh development in this particular marsh is supported by brushwood structures (van Loon-Steensma, 2015). At this site, common glasswort (Salicornia europaea), common salt marsh grass (Puccinellia maritima) and common cordgrass (Spartina anglica), are pioneer species occurring in the lower salt marsh. Vegetation species occupying the higher marsh are couch grass (Elymus athericus), sea aster (Aster tripolium), and seepweed (Suaeda maritima).
The semi-natural Marconi salt marsh (53°19′39.33″N, 6°56′40.75″E; Figure 1 and Table 1) is located in the Ems-Dollard estuary, at Delfzijl. The mesotidal Ems-Dollard estuary is directly connected with the Wadden Sea estuary. The tidal range near Delfzijl is approximately 3.1 m, with a spring tidal range of 3.4 m (Dillingh, 2013). The salinity in the Ems-Dollard increases from southeast to northwest and is generally below 20 psu (Esselink et al., 1998), with approximately 23 psu locally near the Marconi salt marsh. The Marconi salt marsh was developed in 2018 at the seaward side of the jetty of the Port of Delfzijl. Mud (silt and clay) was mixed through the top layer of a sand fill on the foreshore of the jetty. The mud was collected during a local port extension project and temporarily stored in a land depot. The percentage of mud in the sand/mud mixture was varied intentionally between different sections of the salt marsh (ranging between 5 and 50%; Figure 1). The D50 at the top layer of the sections were measurement stations were located varied between 111 and 213 μm (De Vries et al., 2021; Table 1). To protect establishing vegetation from excessive hydrodynamic energy, permeable brushwood dams were constructed surrounding the different salt marsh sections. Moreover, to enhance vegetation growth, Salicornia procumbens was sown in part of the salt marsh sections. After its first year, vegetation species established at the Marconi salt marsh were mainly the pioneer and lower marsh species glasswort (Salicornia spp.), seaside bulrush (Bolboschoenus maritimus), spear-leaved orache (Atriplex prostrata), seepweed (Suaeda maritima), salt sandspurry (Spergularia sp.) and common salt marsh grass (Puccinellia distans) (De Vries et al., 2021).
Field Data Collection
Vegetation Data
At the natural salt marshes in the Western Scheldt and semi natural salt marsh in the Wadden Sea, where vegetation has already been developing for decades, vegetation presence was determined for each of the measurement stations. Measurement stations where vegetation was absent during the measurement periods were defined as bare tidal flat, whereas stations where vegetation was present were defined as vegetated salt marsh. Vegetation cover at the salt marsh stations was characterized as pioneer, low marsh and high marsh, each with a vegetation cover of at least 5%.
A similar approach was applied at the constructed Marconi salt marsh. Vegetation was not present when the measurement stations were installed, due to recent construction of the semi-natural salt marsh. Measurement stations at Marconi were set-up around the local mean high water level (1.4 m +NAP). Vegetation cover was monitored at the end of the growing season (September) to be able to observe annual species as well, and vegetation density was estimated using a decimal scale (Londo, 1976) in permanent quadrats (PQ’s) of 2 m × 2 m. At the end of the growing season, measurement stations were characterized either by vegetation presence or absence.
Water Level and Wind Data
Water level data were obtained from Rijkswaterstaat (Dutch waterways and public works Authority), for consistency across all study sites. Water level data were obtained at a 10 min interval at measurement stations near the study sites: Terneuzen, Bath, Hansweert, Uithuizen and Delfzijl (Figure 1). The surface elevation of the measurement stations, relative to NAP (Dutch Ordnance Datum), was initially measured with an RTK-DGPS for determining inundation periods of the individual measurement stations. The RTK-DGPS has a vertical accuracy of approximately 2 cm. Hourly wind data (wind speed and wind direction) were obtained from KNMI (The Royal Netherlands Meteorological Institute) measurement stations near the natural salt marsh Zuidgors and the constructed salt marsh Marconi, Vlissingen and Nieuw-Beerta, respectively.
Bed Level Dynamics
Bed level dynamics data were collected or reanalyzed at all study sites, both at locations with and without vegetation presence (Figure 1). All measurement stations were located close to the vegetation edge (or predicted vegetation edge at the end of the growing season), to assess the isolated influence of bed level dynamics on the occurrence of salt marsh vegetation, as well as the similarity of bed level dynamics at natural and semi-natural salt marshes. Field observations from a total of 32 measurement stations across the six study sites were analyzed, each for at least a 1 year duration (Table 1).
Bed level changes at the natural salt marshes in the Western Scheldt estuary were collected previously using the Optical Surface Elevation Dynamics (O-SED) sensor (Willemsen et al., 2018). This stand-alone sensor captures bed level change by using a measurement array of light sensitive cells (i.e., phototransistors) and has been successfully applied to quantify salt marsh dynamics in previous studies (Hu et al., 2015a,2017). The sensors were installed firmly in the bed, with half of the measurement array of 400 mm below the surface and half of the array extending above the sediment surface. The instruments were serviced, cleaned and data were downloaded every 2–6 months The sensors were pushed in or pulled out of the bottom after excessive sedimentation and erosion. The observations were corrected for this action during post-processing. A single surface elevation measurement was collected every 30 min. Raw data were converted to bed level change data using an existing post-processing script (Willemsen et al., 2018). The post-processed data have previously been validated successfully against sedimentation-erosion bars (Hu et al., 2015a) and erosion pins (Willemsen et al., 2018), with an accuracy of the obtained bed level changes of approximately 5.0 mm (Hu et al., 2015a). Data was reanalyzed specifically for the current study.
Bed level changes at the semi-natural salt marsh Uithuizen at the Wadden Sea coast were also previously collected using the O-SED sensor (Willemsen et al., 2018). Data collection, post-processing and reanalysis, was equal to collection, post-processing and reanalysis for marshes in the Western Scheldt. At the semi-natural constructed Marconi salt marsh, bed level change data were collected using state-of-the-art Acoustic Surface Elevation Dynamics (A-SED) instruments (Figure 2). This recently developed instrument measures the distance between the bed and the instrument through the echo of an acoustic signal (Appendix 1). The sensor operates stand-alone without requiring external power and data-logging systems. Furthermore the instrument is relatively inexpensive (±1,000 euro) compared to other (acoustic) measurement instruments (see Hu et al., 2015a). The instrument is set-up to be able to collect measurements when the sensor of the instrument is fully inundated. A burst of eight samples (sampling frequency of 5 Hz) was stored at a measurement interval of 5–15 min. The instruments were installed downward looking, with the sensor head aimed vertically at the bottom (Figure 2). The instruments were serviced, cleaned and data were downloaded every 2–3 months. A post-processing script was developed in Python to convert the acoustic return signals to bed level change data (Appendix 1). The measurements were validated with manual readings of the height above bed (HAB) of the sensors every time the instruments were serviced.
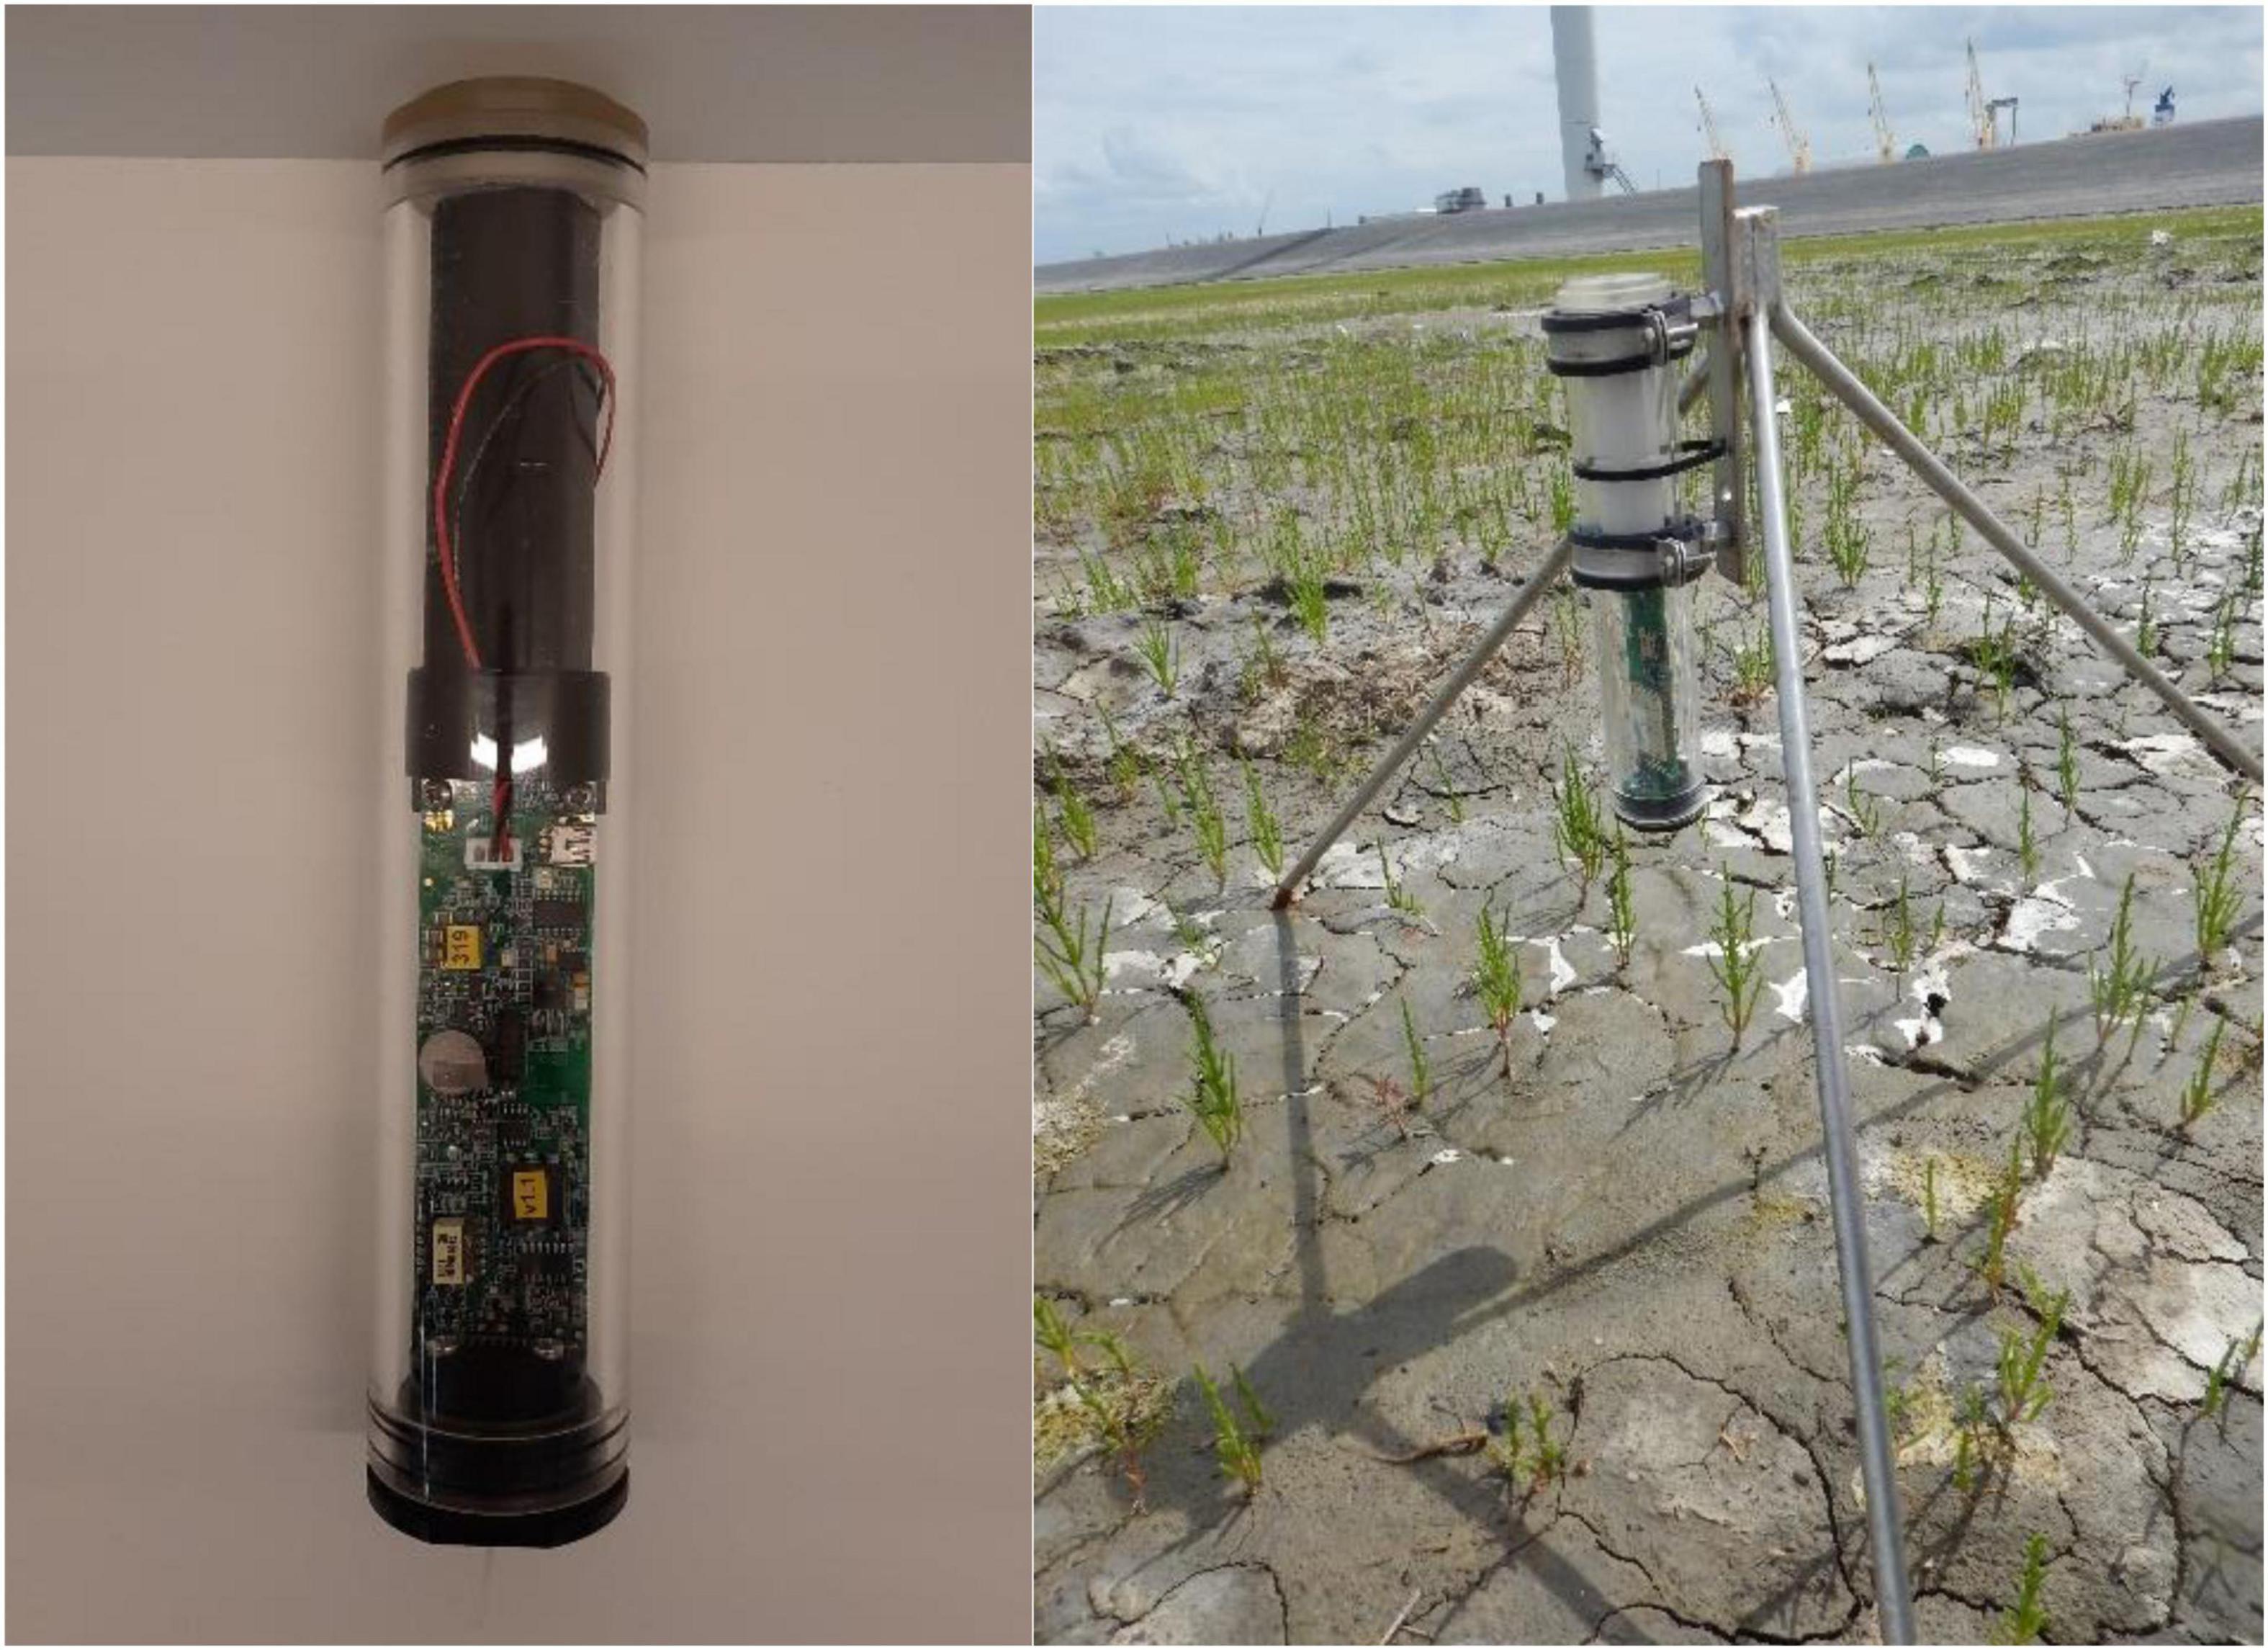
Figure 2. The A-SED sensor (left) and the A-SED sensor deployed in the field (right).
Data Analysis
The distribution of the magnitude of bed level change per measurement (with a measurement every 5–30 min) was determined per study site both for the stations were vegetation was present and absent, by calculating the difference of subsequent measurements. The standard deviation of every full time series of bed level dynamics was calculated to capture short-term event-based dynamics, since larger bed level change was observed to coincide with larger waves and stronger winds (c.f. Hu et al., 2015a; Willemsen et al., 2018). Medium-term seasonal bed level change was captured by calculating the linear least-squares regression of the observed bed level dynamics per season, with the slope of the regression representing the linear rate of change of the bed level over a single season. For this analysis, the seasons were defined as the growing season (April–September) and non-growing season (October–March). If gaps in the SED data appeared for three or more consecutive months, either in the growing or in the non-growing season, the seasonal rate of change of the station was discarded. Additionally, local water level data were compared with RTK-DGPS-derived bed level data of the measurement stations, to compute the time each site was submerged/emerged.
Validation of the Accuracy of the Novel Sensors and the Processing Software
Bed level change measurements collected with the A-SED sensors at all measurement stations at Marconi and the post-processing script (Appendix 1) were validated with manual measurements, analog to what was done earlier for the O-SED (Hu et al., 2015a; Willemsen et al., 2018). An average height above bed (HAB) was calculated for each burst of eight individual A-SED measurements. The raw data each of those eight measurements were first converted to a height above bed (HAB), which were subsequently averaged. The HAB of the A-SED was also manually measured upon installation and retrieval of the sensors, every 2–3 months. These manual measurements were compared with the first instrument measurement after installation and the last measurement before retrieval, respectively (Figure 3).
Figure 3. Comparison of height above bed measured by the A-SED and manually measured height above bed of the A-SED, every time the A-SED is installed and retrieved from the field at all measurement stations at the Marconi salt marsh. Green dots show the data, the blue line represents a linear fit of the data (the gray dashed line represents a perfect 1:1 correlation).
A direct comparison between the A-SED data and the manually obtained reference measurements provides a near-unity correlation: the least-squares regression line of the A-SED data and the manually obtained measurements has a slope of 1.0001 with an R2 of 0.99 (Figure 3). The height measured by the A-SED sensors was systematically higher than the manual observations by 2.13 cm. This offset was subsequently applied as a fixed calibration constant in the post-processing of the A-SED data. For the current analysis, however, this constant offset is not affecting the results, since all A-SED observations are converted into bed level change relative to the initial measurement of the time series. The accuracy of the sensor is defined as the absolute error between the A-SED sensor measurement and the true value assumed to be measured manually (c.f. Hu et al., 2015a). Based on all manual measurements, the accuracy is 7.6 mm with a standard deviation of 6.1 mm. The accuracy of the O-SED sensor was observed to be 5.0 mm (Hu et al., 2015a), comparable to the A-SED sensor.
Results
Vegetation Presence
Vegetation was present, for the full bed level dynamics measurement period, at 12 of the 22 measurement stations located at the natural salt marshes in the Western Scheldt (Zuidgors, Paulina, Hellegat, and Zimmerman). The vegetation cover at the vegetated stations was at least 5%. At the semi-natural salt marsh in the Wadden Sea vegetation was present at 3 of the 4 measurement stations (cover >5%) (Figure 1). Vegetation at the semi-natural salt marsh Marconi was still developing, due to its recent construction. Vegetation at the end of the growing season in September 2020 was present at 3 of the 6 measurement stations and consisted mainly of the annual Salicornia spp. The vegetation density at measurement stations 1, 2, 3, 4, 5, and 6 was 0, 0, 0, 10, 1, and 20%, respectively (Figure 1).
Inundation Time of the Measurement Stations
All well-established natural salt marshes in the Western Scheldt generally showed an inclining elevation from the most seaward measurement station toward the most landward measurement station. This is reflected in reducing inundation times at these measurement stations (Figure 4). The lowest elevation/inundation level where vegetation is present was strongly site-specific (Figure 4; dashed lines). In the Western Scheldt estuary, where four natural salt marshes were located, vegetation extended more seaward to lower elevations and was able to withstand shorter dry periods (i.e., longer inundation) at the southern shores (Paulina and Hellegat), compared to the northern shores (Zuidgors and Zimmerman). This might be explained by the prevailing wind conditions, adding local disturbances: Paulina and Hellegat are sheltered from the prevailing wind conditions, whereas Zuidgors and Zimmerman are more exposed to the prevailing southwesterly winds.
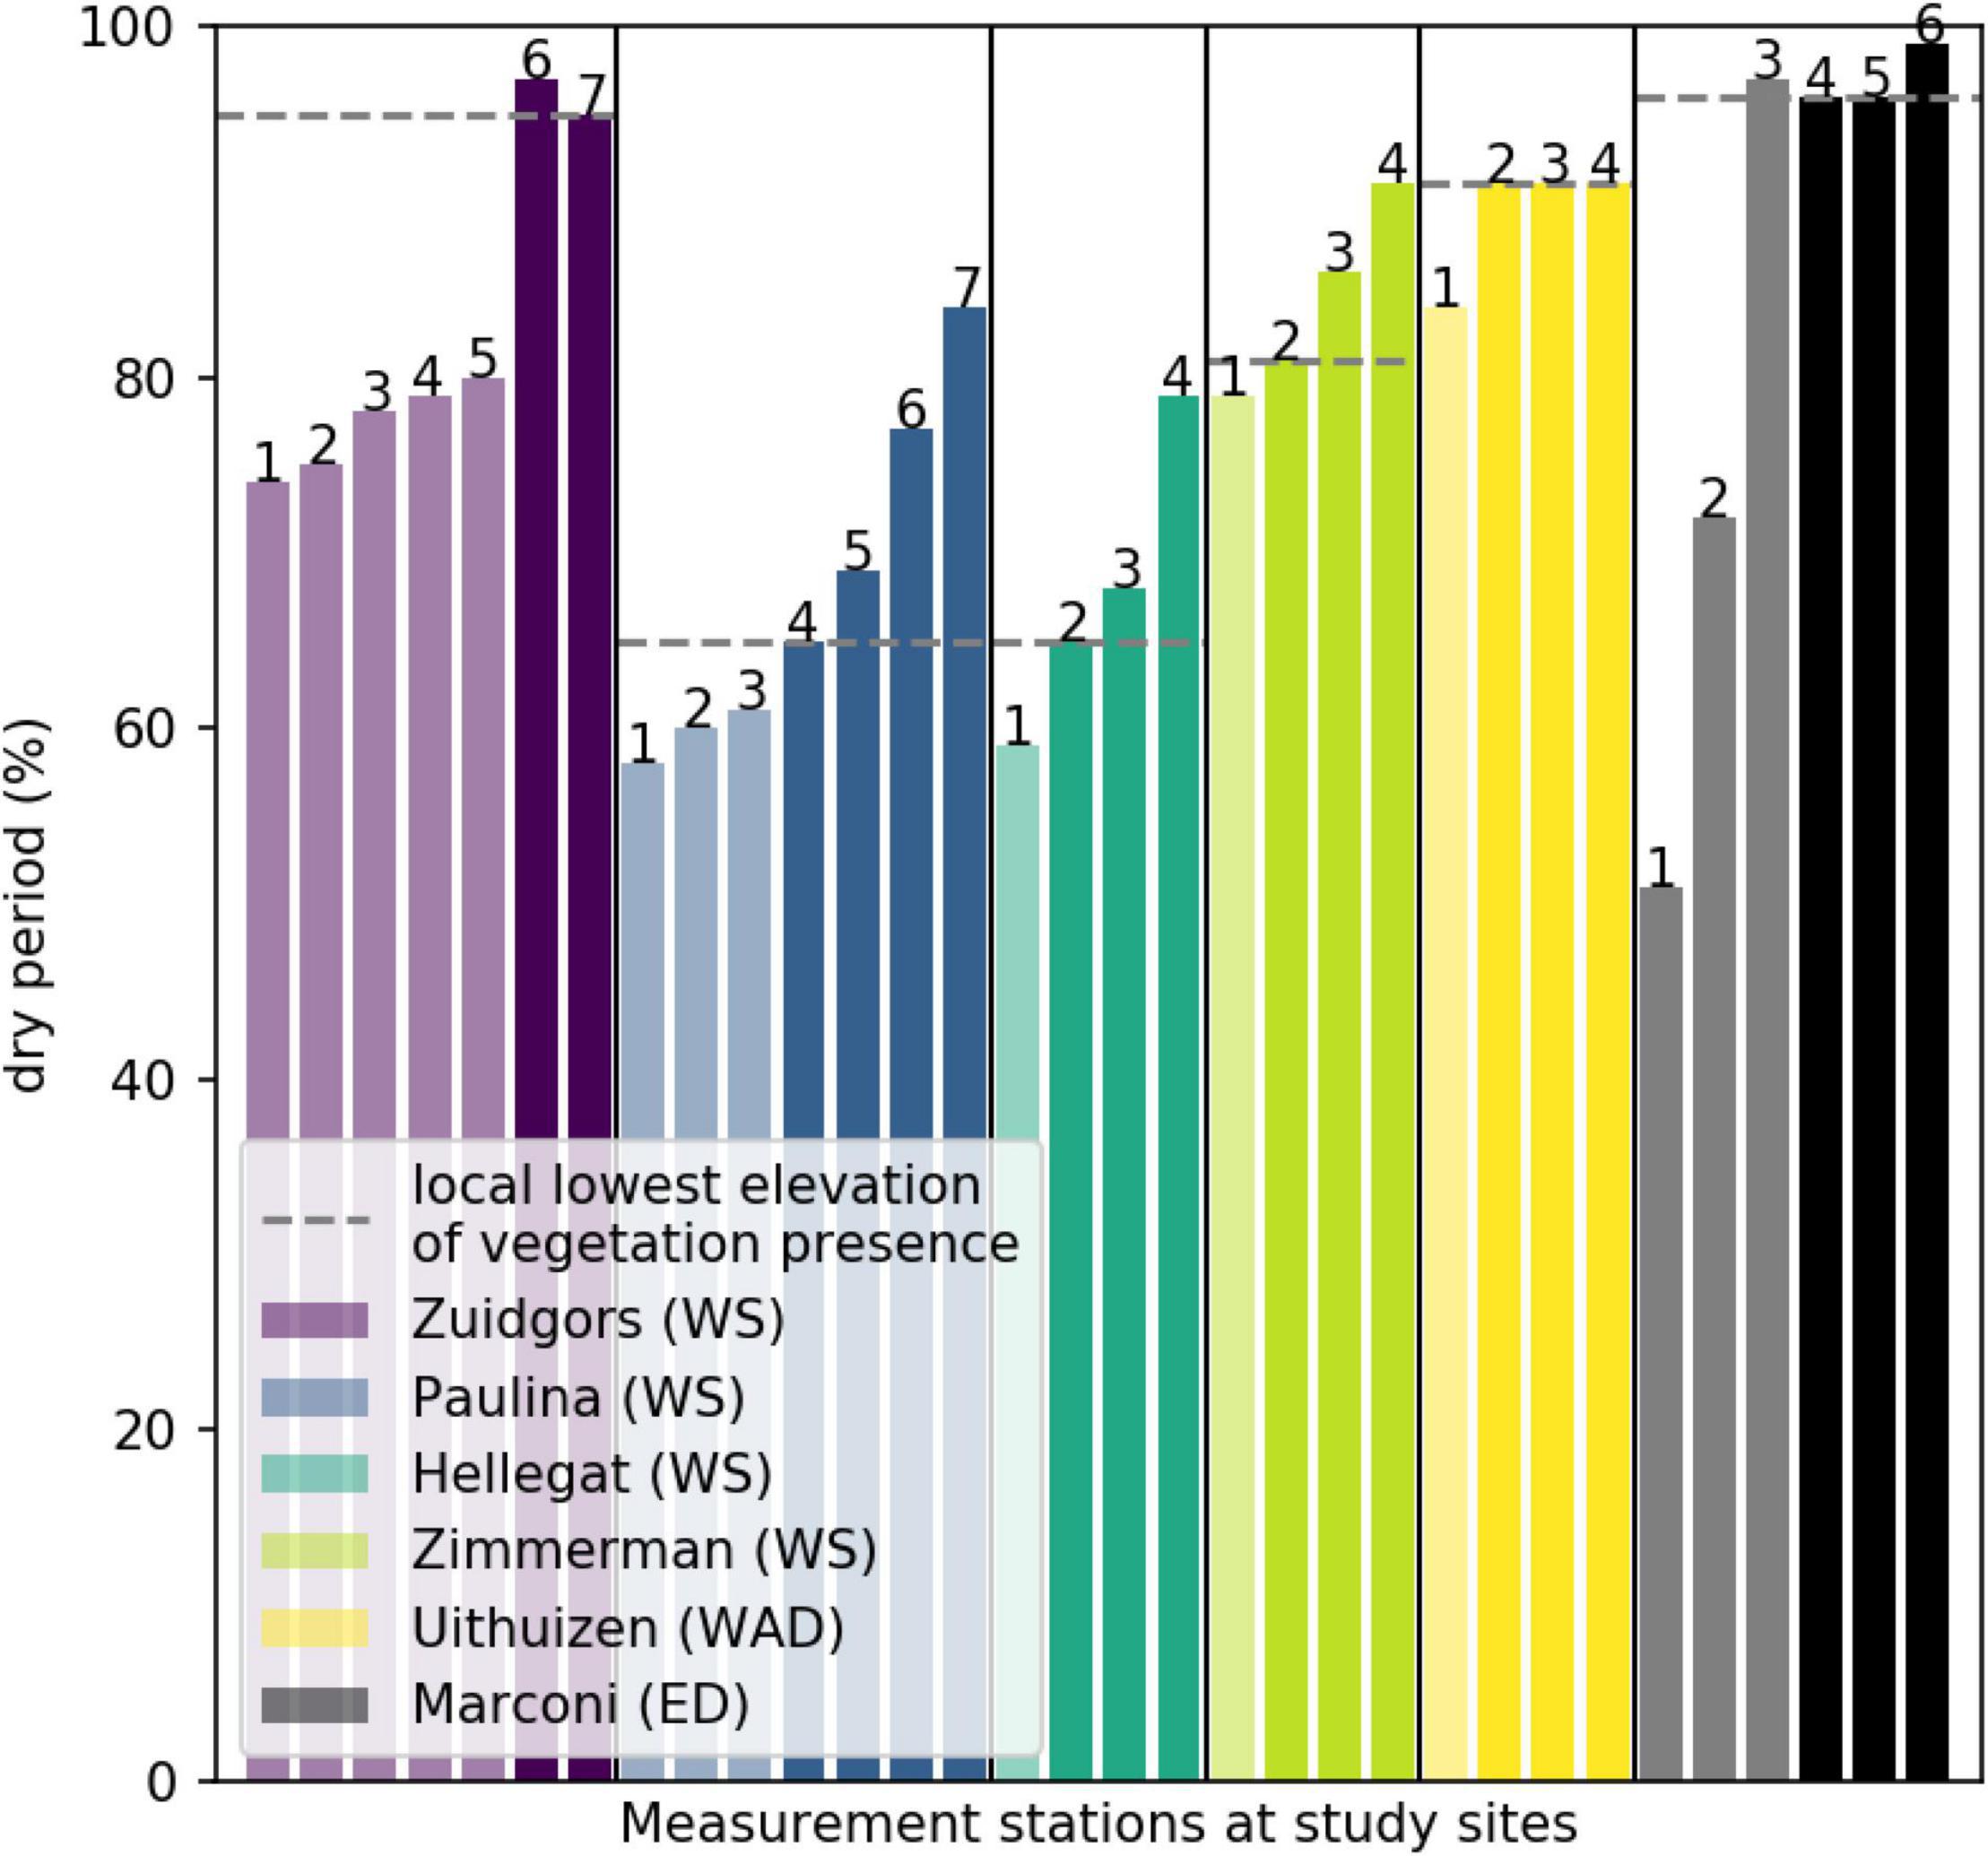
Figure 4. The relative duration a measurement station is not inundated (i.e., dry period). The light colored bars indicate a location where vegetation is absent (bare tidal flat), whereas the dark colored bars indicate a location where vegetation is present (vegetated salt marsh). The dashed lines indicate the local lowest elevation where vegetation is present per study site. Numbers relate to the numbers of the measurement stations, introduced in Figure 1. WS indicates Western Scheldt, WAD indicates Wadden Sea and ED indicates Ems-Dollard.
At the semi-natural salt marsh Uithuizen in the Wadden Sea the inundation period increased from the seaward to landward measurement stations, similar to the observations in the Western Scheldt estuary. At the semi-natural (recently constructed) Marconi salt marsh in the Ems-Dollard estuary, the inundation duration is longer at the measurement stations in front of the brushwood dams (Figure 4; Marconi stations 1 and 2). In general, the dry period at the measurement stations sheltered by the brushwood dams is longer, enabling vegetation to establish (Figure 4; stations 3, 4, 5, and 6). Nevertheless, even though the elevation of the most eastward measurement station sheltered by the brushwood dams (station 3) exceeds the local lowest elevation for vegetation to grow, vegetation was still not able to grow there. This might be explained by both the location of the test section being near to the edge of the constructed salt marsh, thereby having slightly higher hydrodynamic energy and/or by the low clay content of this test section (5%), resulting in less favorable growing conditions.
Although similar patterns were observed at all study sites, the inundation threshold for vegetation to be present was different. So the results show that inundation time can explain the presence of vegetation locally, within each study site. However, this physical parameter, strongly related to elevation, does not provide a generic threshold to the presence of vegetation for all study sites around the North Sea.
Bed Level Change
Between the time series of bed level dynamics (time scale of minutes), both deposition (positive) and erosion (negative), at all study sites there was a significant difference [two-way ANOVA; F(5,552643) = 7088, p < 0.001], indicating unique dynamics for all individual sites. Between the vegetated and unvegetated measurement stations, over all study sites there was a significant difference in the full bed level dynamics time series [F(1,552643) = 709, p < 0.001], highlighting different dynamics at measurement stations with and without vegetation.
The frequency distribution of absolute bed level change measurements (magnitude; both accretion and erosion are positive), both for stations with and without vegetation, showed some similarities (Figure 5). Small bed level changes were observed most often at all sites. The frequency of bed level change declined with increasing magnitudes of bed level change, whereafter a trend break was observed (at bed level change between 5 and 10 mm) toward a steeper decline (Figure 5). The shape of the frequency distribution before the trend break varied largely between the different study sites as well as the vegetated and unvegetated stations. Largest differences between the vegetated and unvegetated distributions were observed at the natural salt marsh Zimmerman and semi-natural marshes Uithuizen and Marconi, although the frequency of larger bed level changes at unvegetated stations exceeded those at the vegetated stations at Zimmerman and Uithuizen contrary to Marconi.
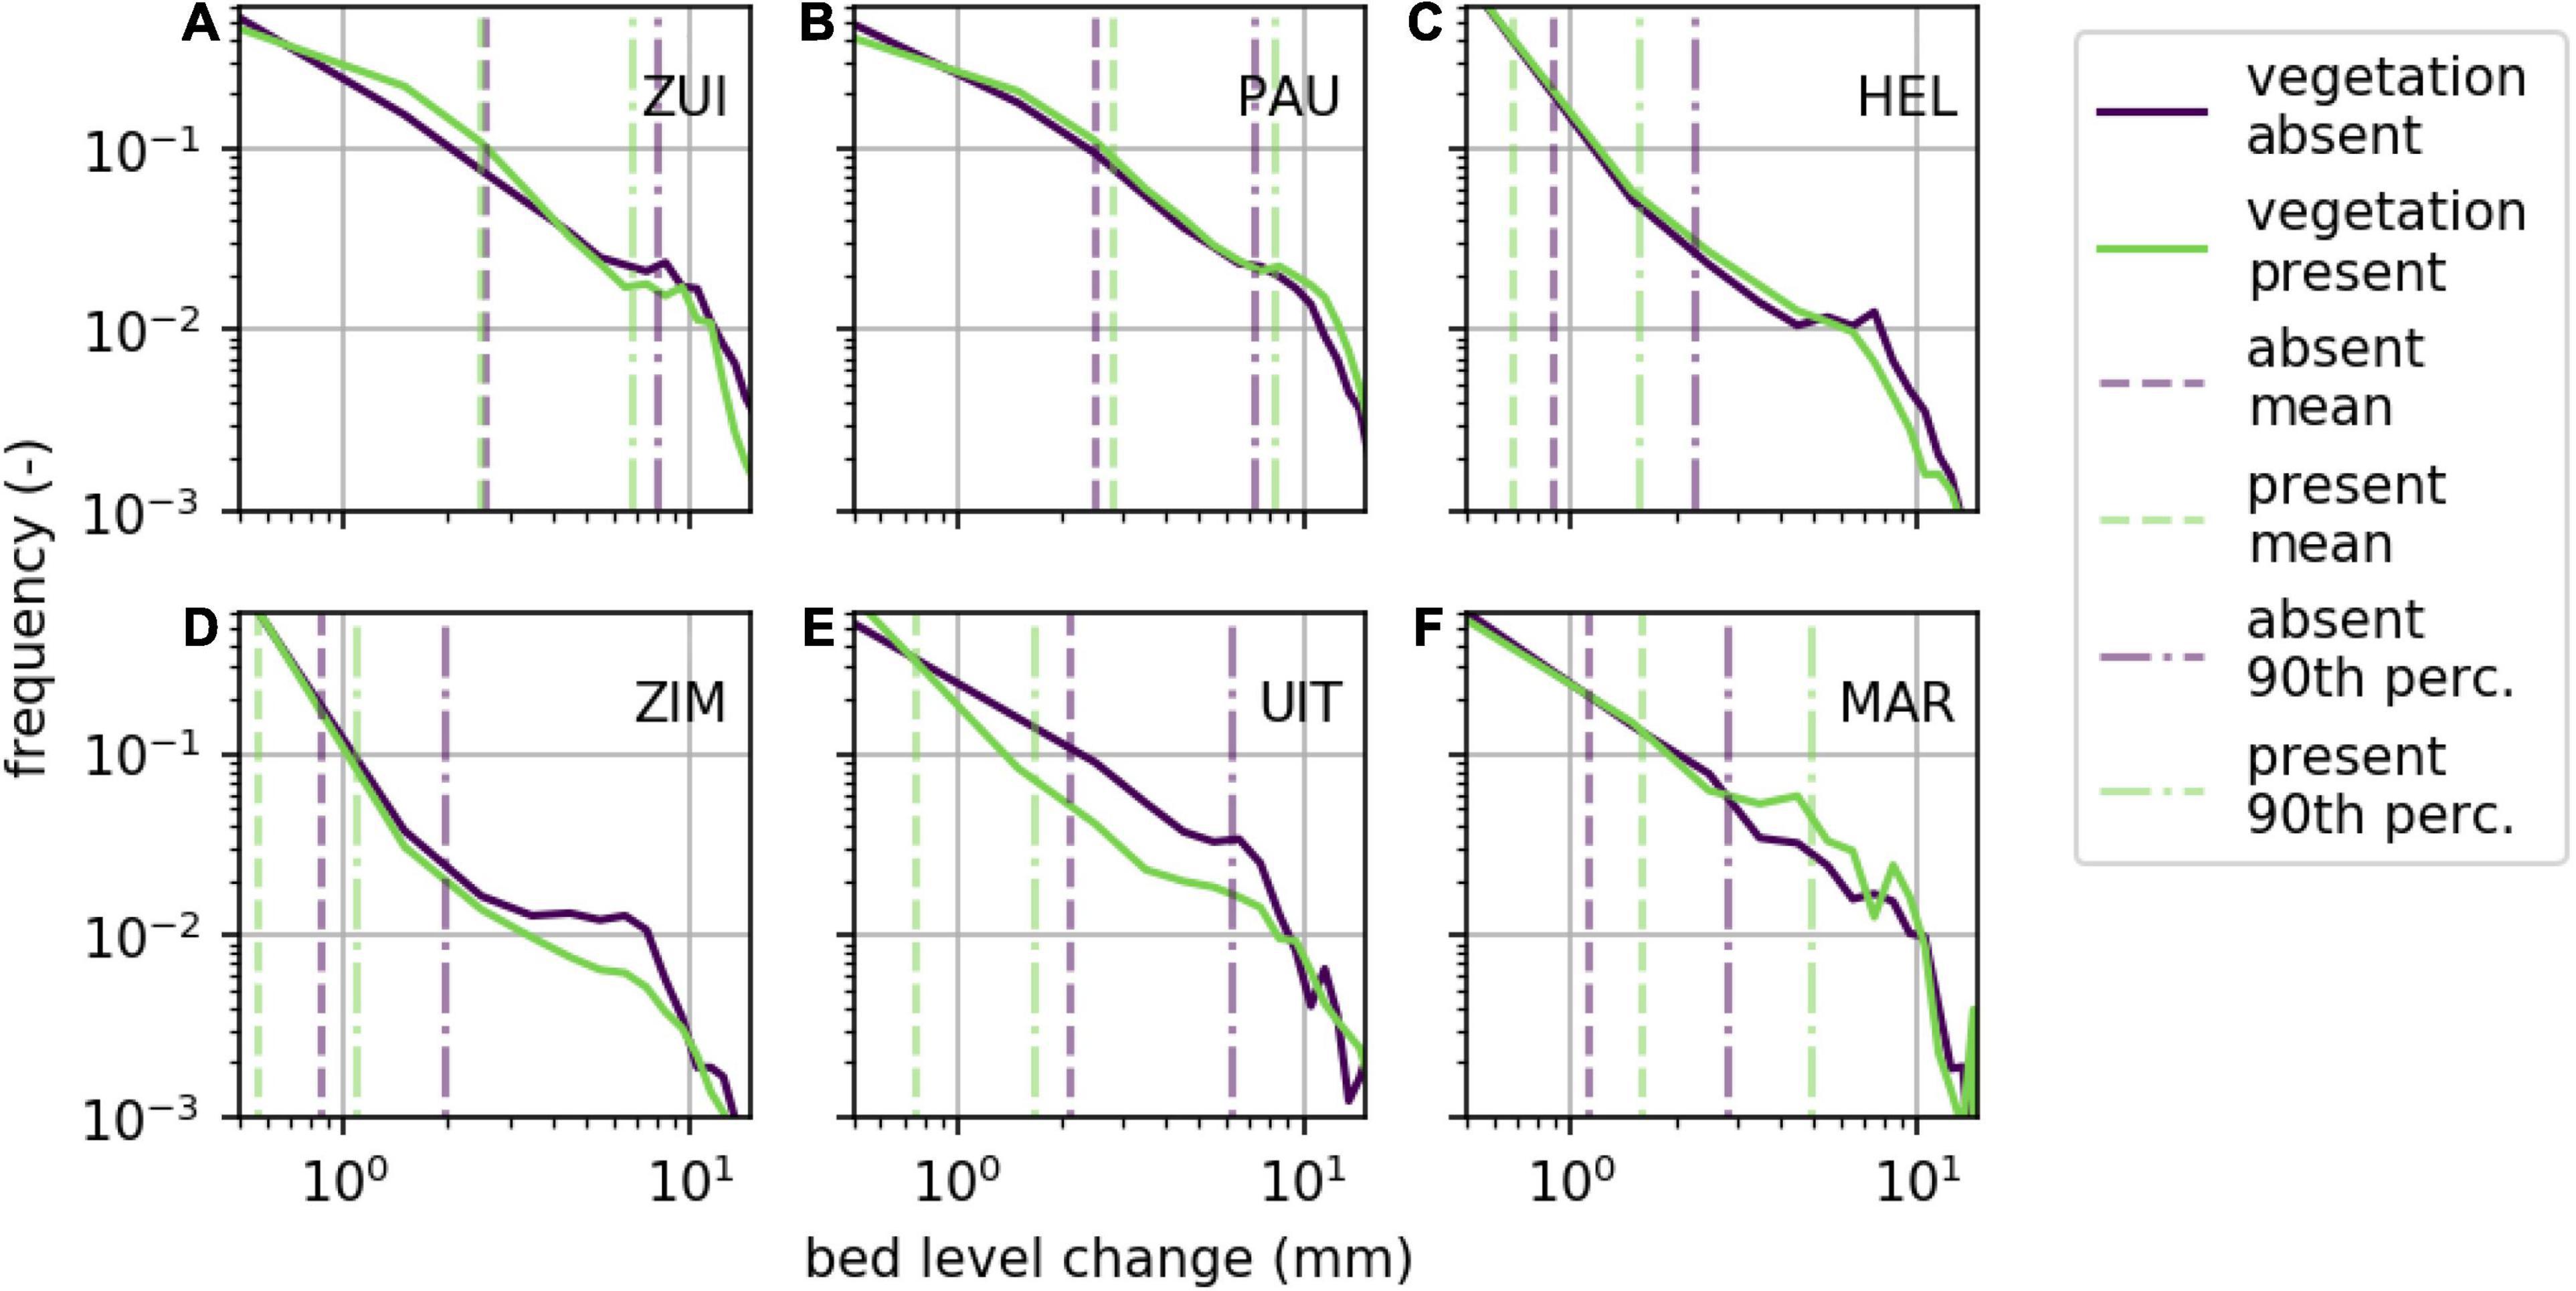
Figure 5. Distribution of bed level change measurements at study sites Zuidgors (A), Paulina (B), Hellegat (C), Zimmerman (D), Uithuizen (E), and Marconi (F). Data are combined for stations where vegetation is present (green) and absent (purple).
The mean and 90th percentile of absolute bed level change (magnitude; both accretion and erosion are positive) at the stations without vegetation did not exceed values at the stations with vegetation at all sites, contrary to expectations. The mean and 90th percentile at the unvegetated stations at Paulina and Marconi did not exceed the values at the vegetated stations at these sites, whereas the opposite was observed at the other study sites. For example, the mean bed level change for Hellegat over the full time series was 0.9 mm at the unvegetated and 0.7 mm at the vegetated stations, whereas for Marconi the mean bed level change was 1.1 mm at the unvegetated and 1.6 mm at the vegetated stations. No generic mean or 90th percentile bed level change threshold was found that distinguished between vegetated and unvegetated for all study sites.
Event-Based Bed Level Dynamics
Measured bed level change, both deposition (positive) and erosion (negative), was converted to a standard deviation to assess the magnitude of bed level change due to, e.g., wind-wave events. As an example bed level change data at the natural site Zuidgors were compared with locally occurring south and south-westerly wind conditions (associated with the longest fetch at this site), to highlight differences in bed level dynamics during storm and calm conditions that were captured with the (A-SED) sensors. The standard deviation of bed level change during a period with storm conditions (e.g. onshore wind speeds exceeding 75 km/h) generally was larger than the standard deviation during calm conditions, both at the unvegetated and vegetated measurement stations (Figure 6). Similar variability in the bed level dynamics due to storm conditions was observed at the semi-natural site Marconi. Storm conditions caused by locally occurring northerly onshore wind conditions (associated with the longest fetch for this site) were not present in the data. Nevertheless, bed level dynamics during onshore windy periods (periods with largest wind speeds, exceeding 40 km/h) were substantially larger than during calm periods (Figure 7), assuming no bed level change when stations were not inundated (Figure 7). At all study sites, unvegetated measurement stations showed substantially larger dynamics than measurement stations where vegetation was present (Figures 6–8). The standard deviation of bed level dynamics for the full measurement period generally showed larger values at the unvegetated stations than the vegetated stations across all measurement stations at the six study sites (Figure 8). A significant difference was observed between the measurement stations where vegetation was present and absent [two-way ANOVA; F(1,29) = 45, p < 0.001]. A significant difference for short-term event-based bed level change between measurement stations at natural and semi-natural salt marshes was not found.
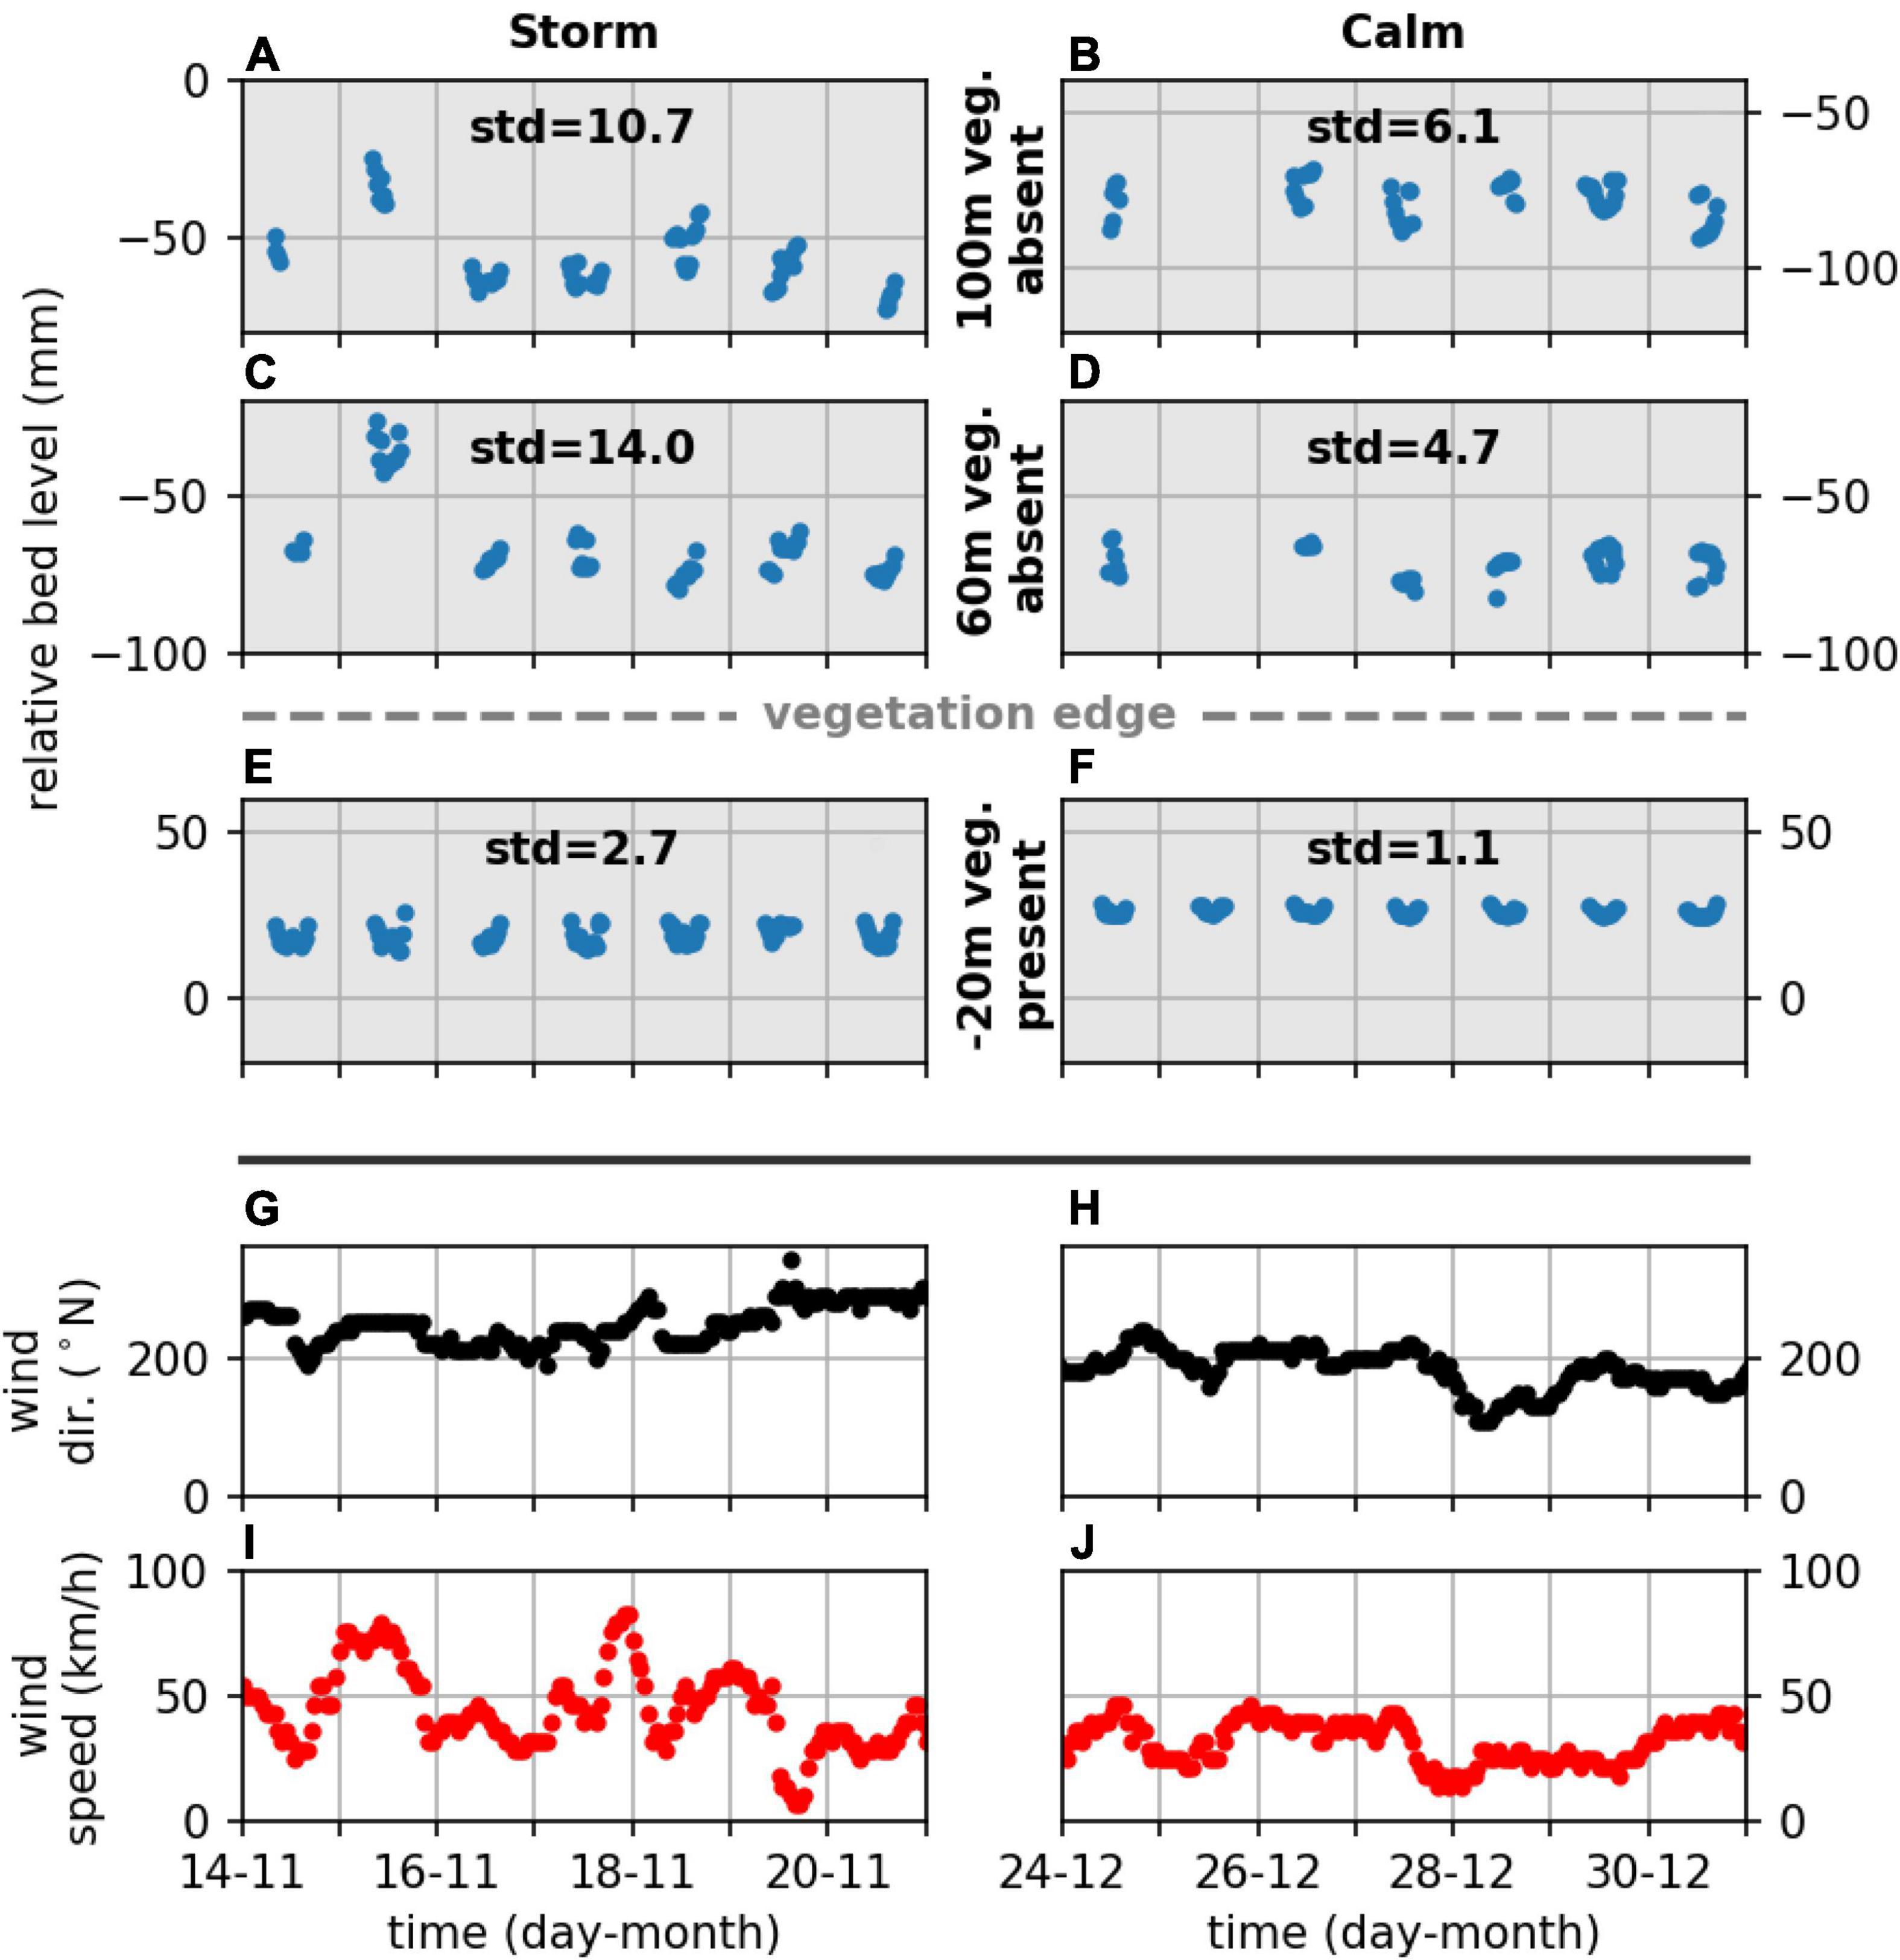
Figure 6. Bed level change [(A–F); blue dots], wind direction [(G,H); black dots] and wind speed [(I,J); red dots], during storm (left) and calm (right) wind conditions for three measurement stations at Zuidgors, two at unvegetated stations (A–D) and one at a vegetated station (E,F). The standard deviation (mm) of the bed level for the represented time series is printed in the panel (A–F).
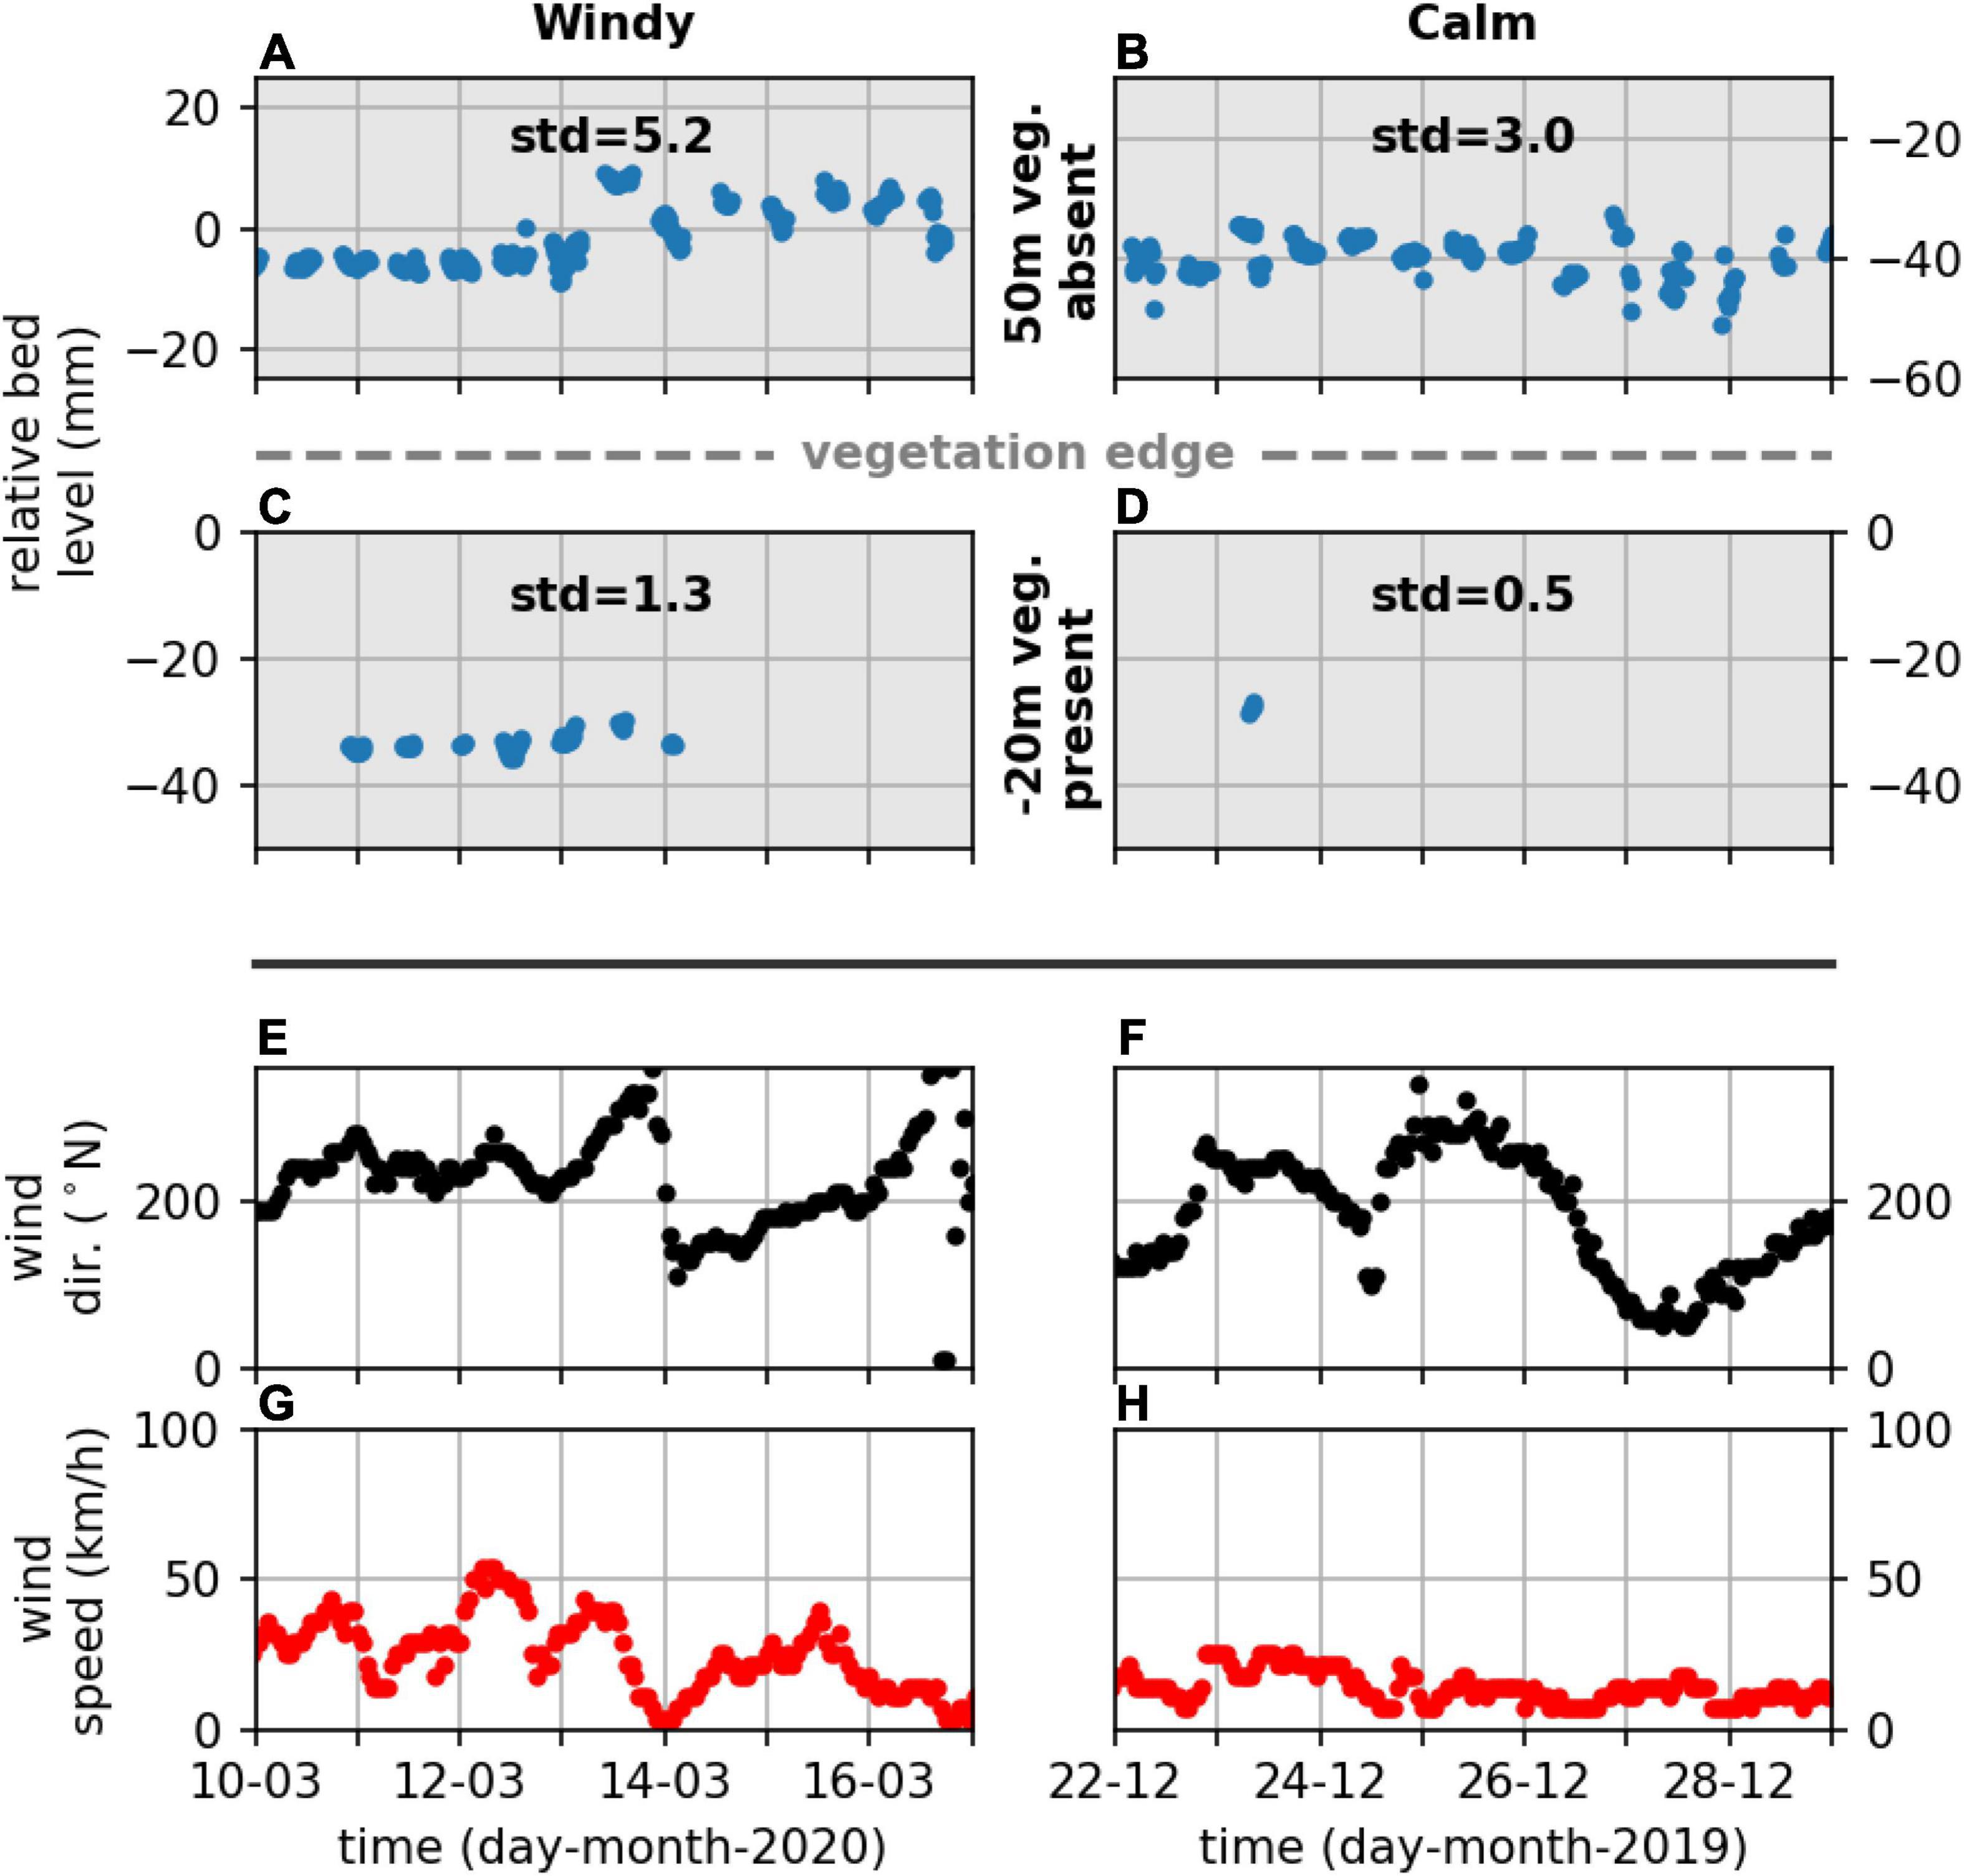
Figure 7. Bed level change [(A–D); blue dots], wind direction [(E,F); black dots] and wind speed [(G,H); red dots], during windy (left) and calm (right) wind conditions at two measurement stations at Marconi, one unvegetated and one vegetated. The standard deviation (mm) of the bed level for the represented time series is indicated (A–D).
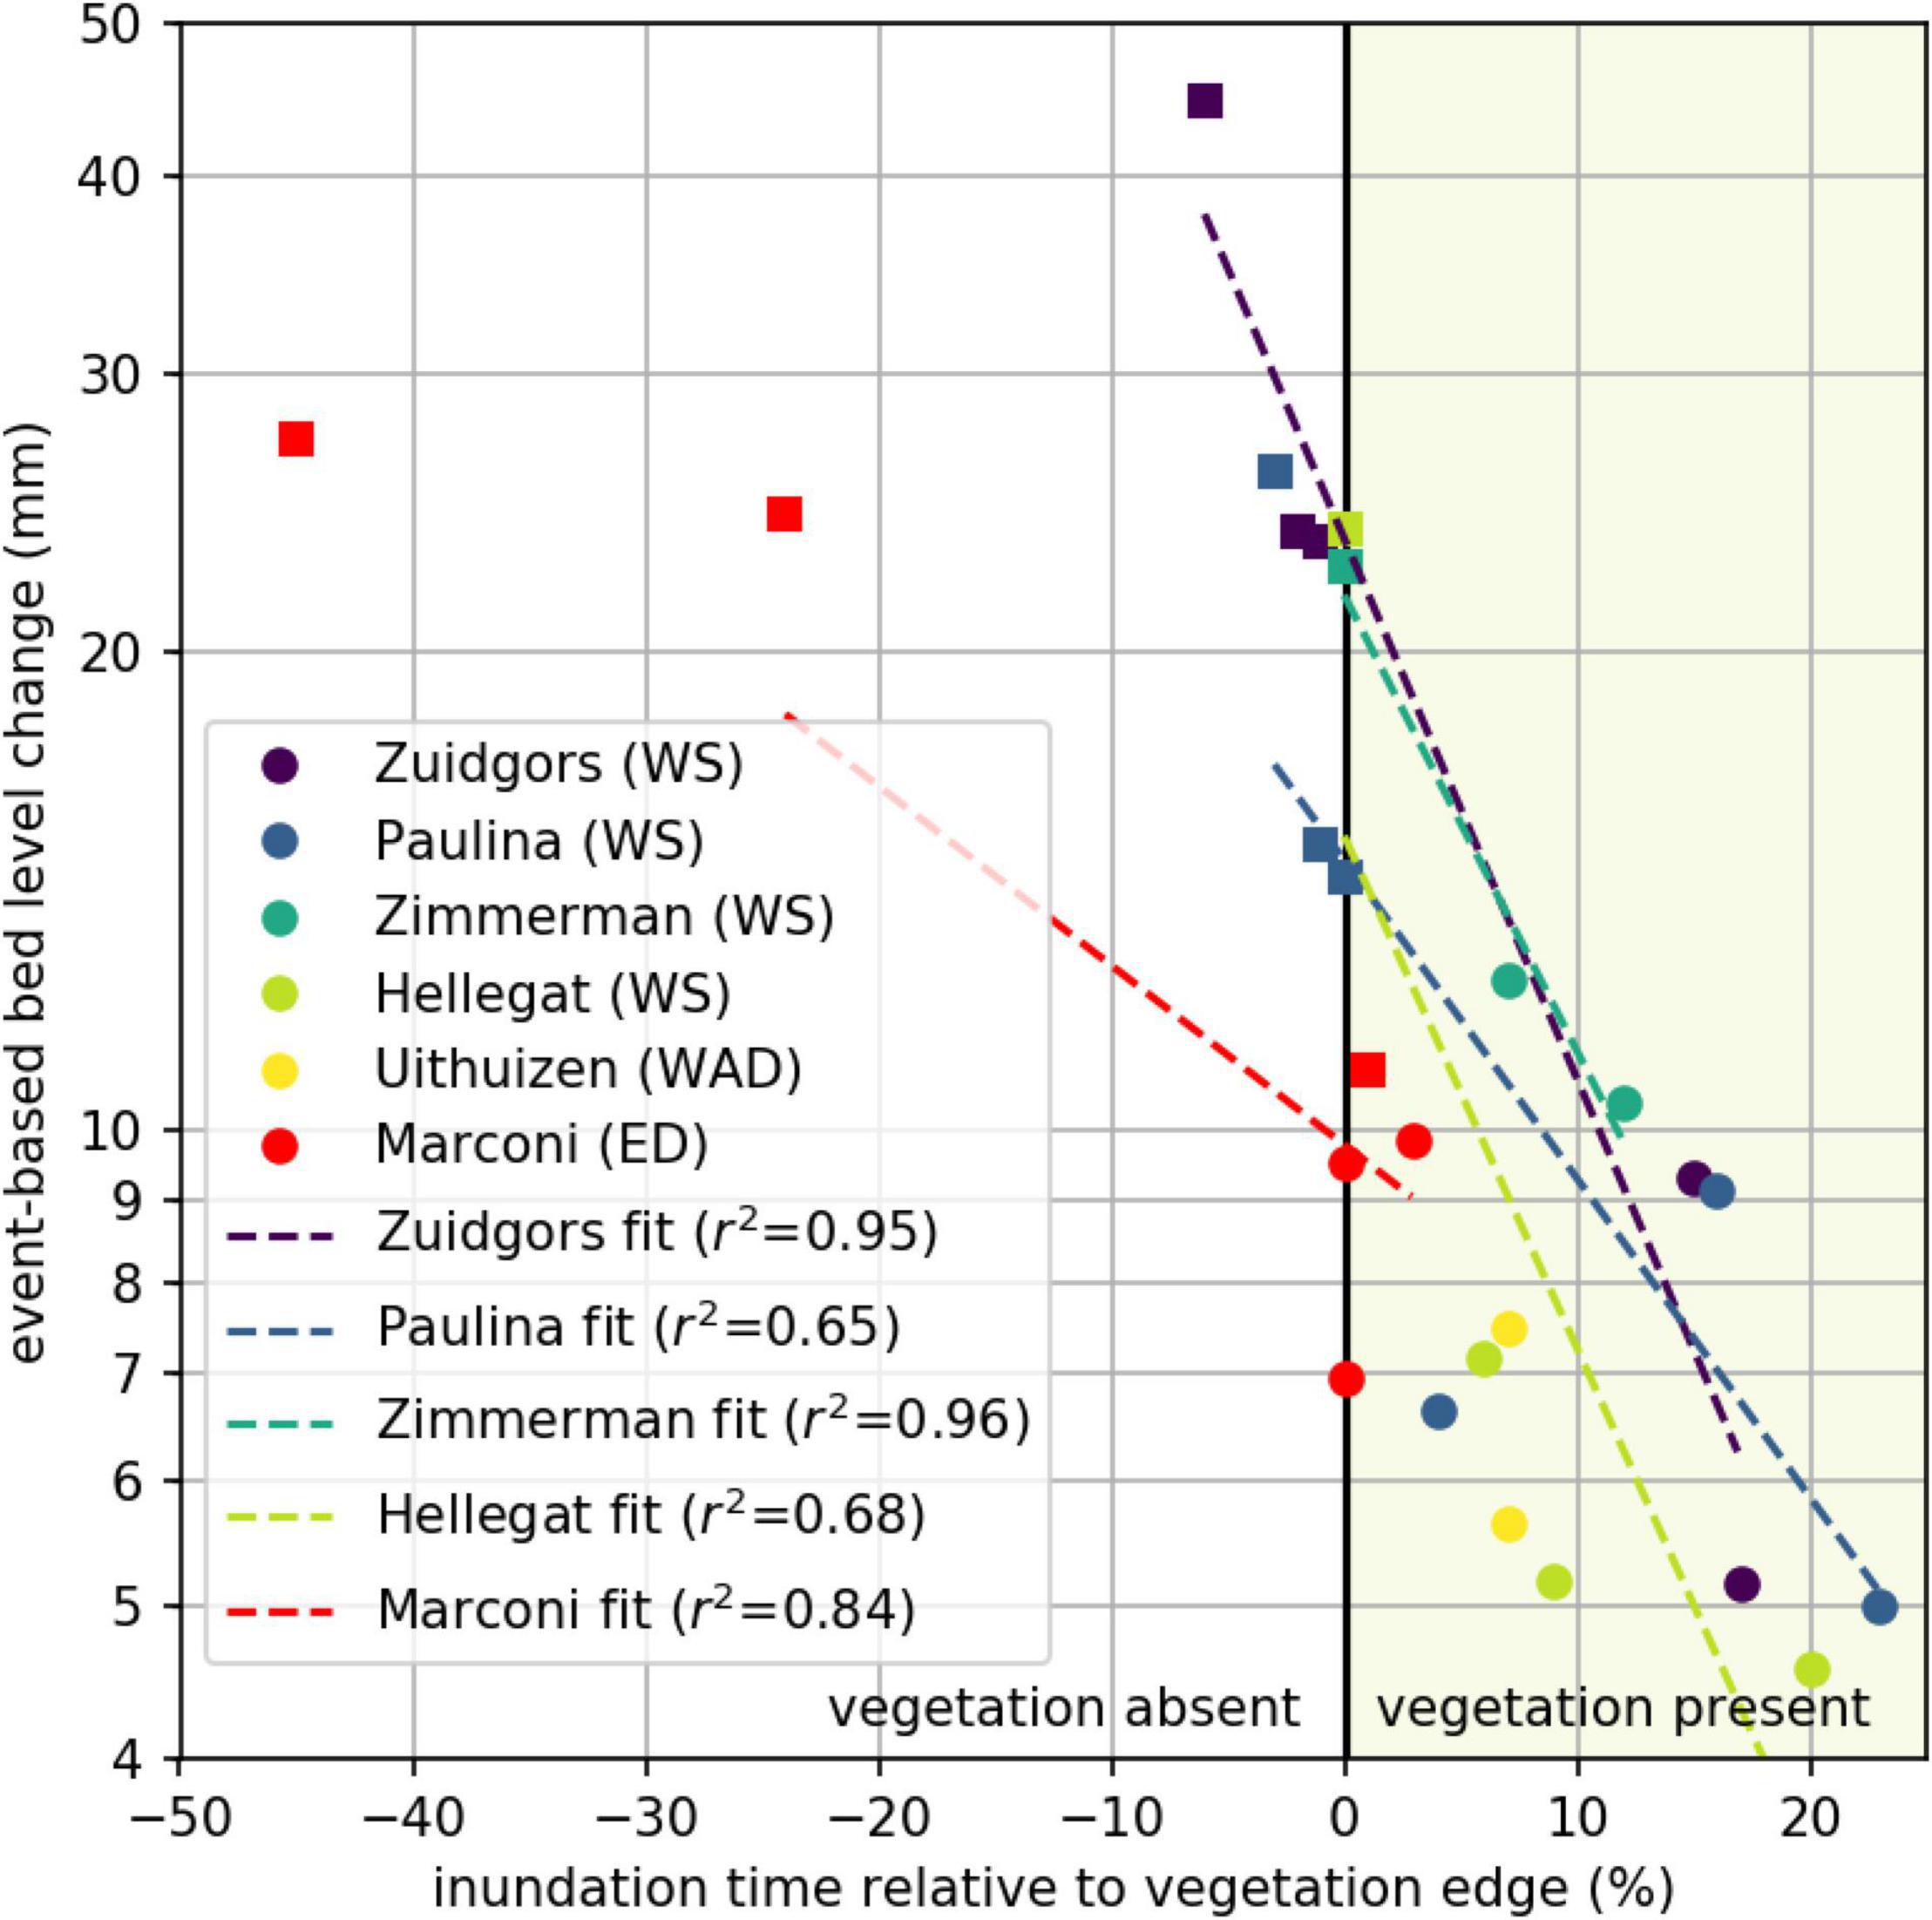
Figure 8. Event-based bed level change related to the inundation time relative to the vegetation edge, with unvegetated (left part; square markers) and vegetated (right part; round markers) measurement stations. Data per study site is fitted with a logarithmic fit (dashed lines).
The standard deviations of bed level dynamics for the full measurement period at all vegetated stations at the natural and semi-natural salt marshes were not exceeding 12 mm (Figure 8), indicating a threshold for vegetation presence. Event-based bed level change at unvegetated measurement stations was generally larger, except at one measurement station at Marconi (Figure 8). Supported by the significant difference between event-based bed level change at vegetated and unvegetated measurement stations: for vegetation to be present the maximum short-term bed level change should not exceed 12 mm.
Seasonal Trends in Bed Level Change
To extend from short-term, event-based bed level change toward medium-term seasonal trends in bed level change, seasonal rates of bed level change were computed (Figures 9, 10). In general, vegetated areas were accreting (up to 111 mm/season) or slightly eroding (up to 30 mm/season) during the growing season. Surprisingly, rates of change at the unvegetated measurement stations were larger during the growing season, both for accretion (up to 155 mm/season) and erosion (up to 90 mm/season) (Figure 10). During the non-growing season, the rates of change at the vegetated stations were of similar size as during the growing season (up to 52 mm/season accretion and up to 33 mm/season erosion). Dynamics at the unvegetated measurement station were generally lower in the non-growing season compared to the growing season (up to 102 mm/season) (Figure 10). Although the rates of change at the vegetated stations seemed generally lower than at the unvegetated stations at each individual study site (Figure 10), a significant difference between all vegetated and all unvegetated measurement stations was only observed during the non-growing season [two-way ANOVA; F(1,23) = 22, p < 0.001]. No significant difference was observed between vegetated and unvegetated measurement stations during the growing season. Dynamics at vegetated and unvegetated stations both in the growing and non-growing season overlapped such that a general threshold for vegetation presence was not found.
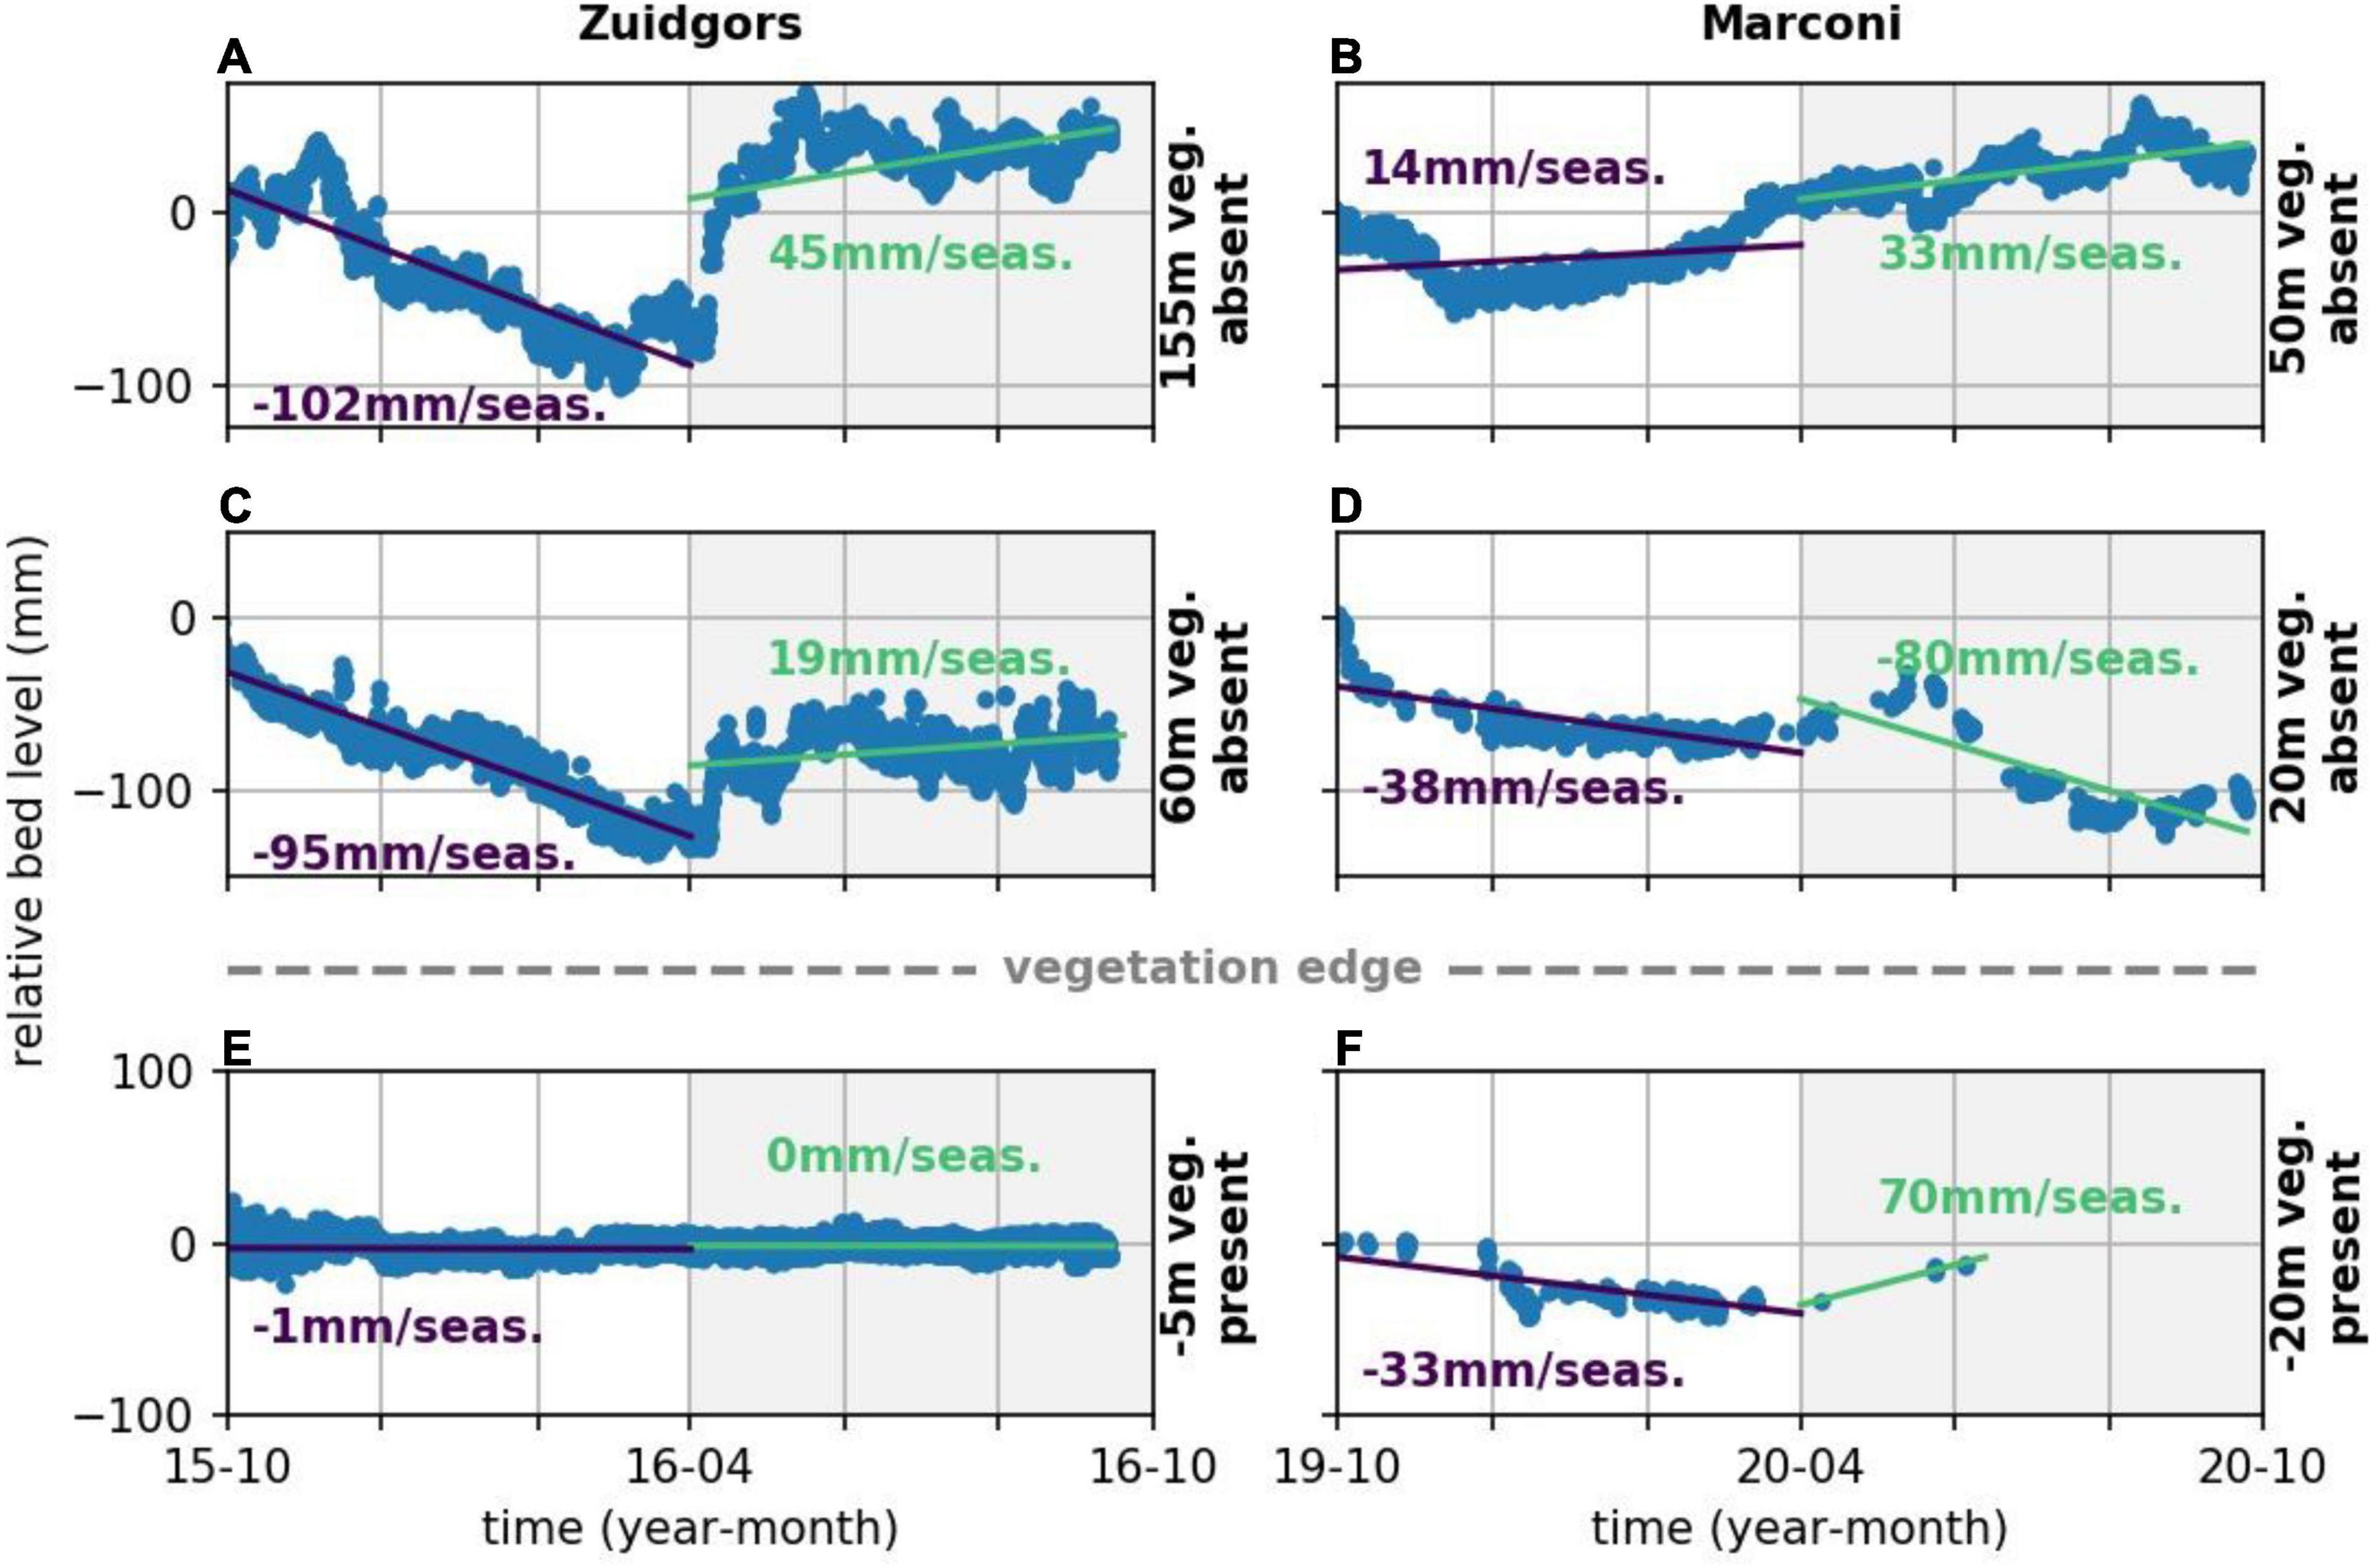
Figure 9. Time series of bed level change (blue dots) at Zuidgors (left) and Marconi (right) at unvegetated stations (A–D) and vegetated stations (E,F). The distance to the salt marsh edge (positive seaward and negative landward), is highlighted at the right-hand side of every subplot. The seasonal fit of the bed level change is indicated with a line and accompanied with a seasonal rate of change (purple for non-growing season and green for growing season).
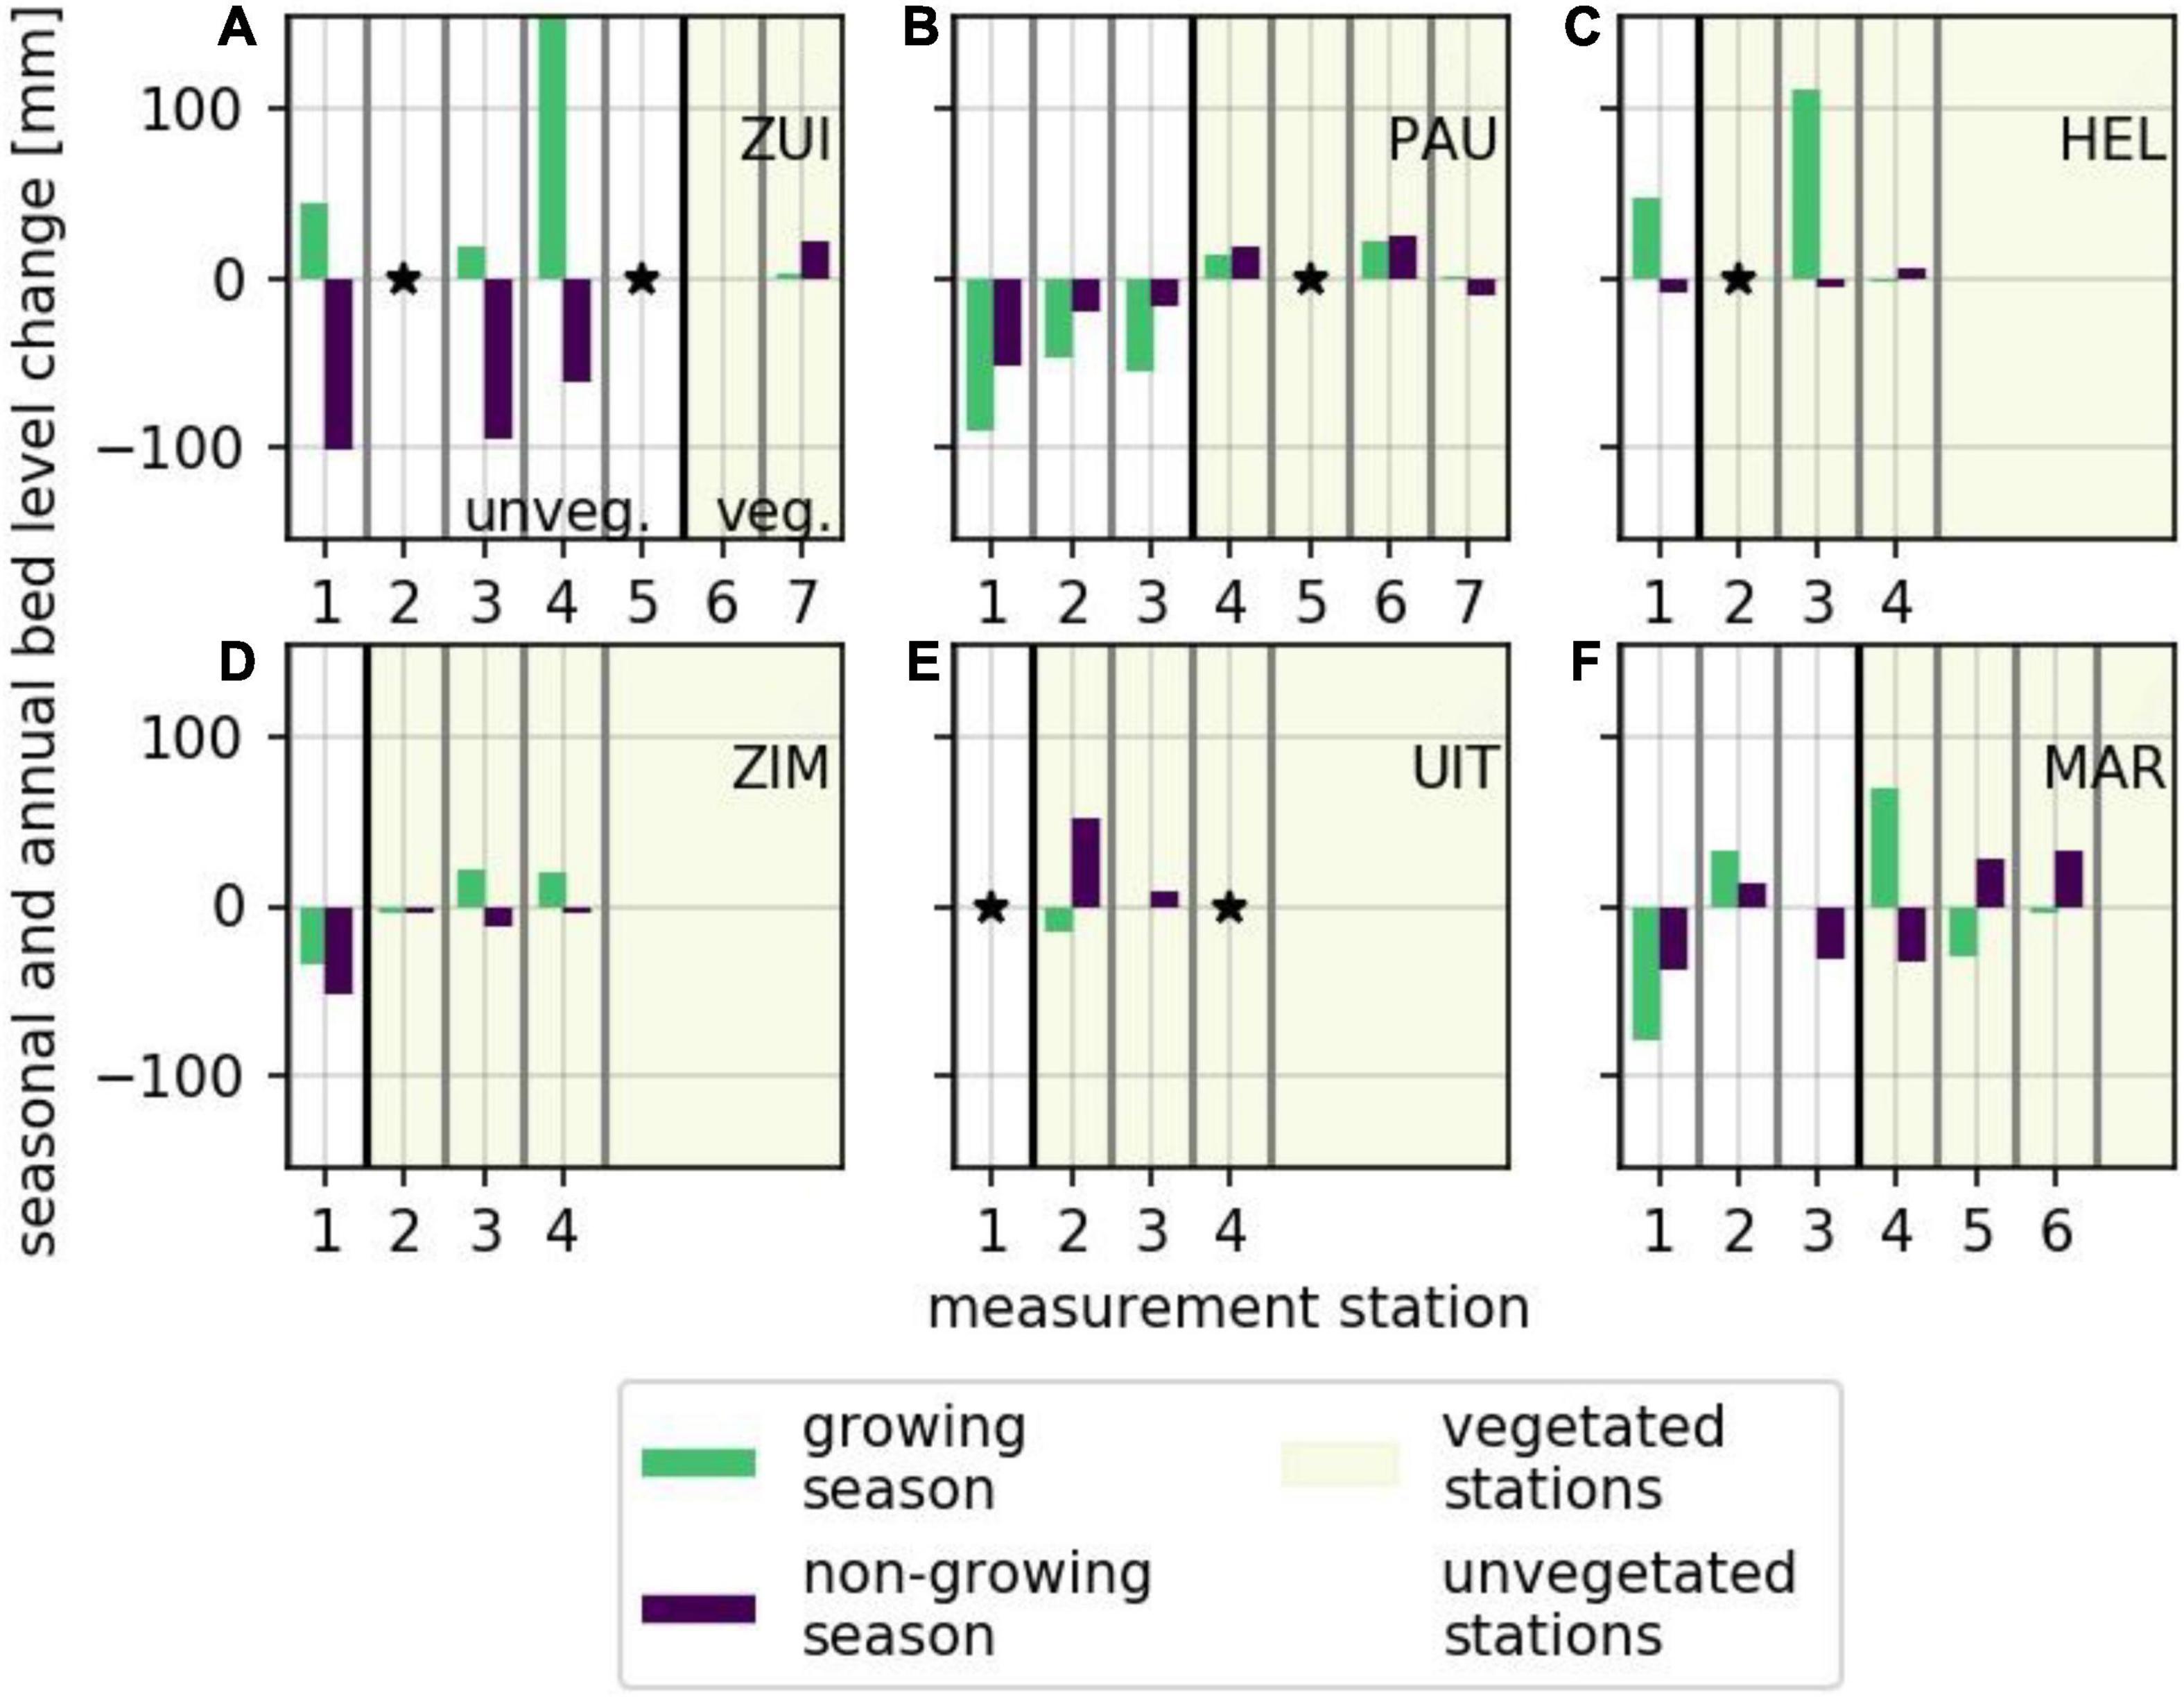
Figure 10. Rates of bed level change during growing (green) and non-growing season (purple) at vegetated (no shading) and unvegetated (shading) measurement stations (separated by a thick black line). (A) Zuidgors. (B) Paulina. (C) Hellegat. (D) Zimmerman. (E) Uithuizen. (F) Marconi. Asterisks indicate insufficient data as explained in section “Data Analysis.”
Rates of change at the natural marshes ranged from 90 mm/season erosion to 155 mm/season accretion in the growing season and from 102 mm/season erosion to 25 mm/season accretion in the non-growing season. Observed differences at the semi-natural marshes ranged from 80 mm/season erosion to 70 mm/season accretion in the growing season and from −38 mm/year sedimentation to 52 mm/season accretion during the non-growing season, indicating a larger range over the growing season. No significant difference was observed between natural and semi-natural salt marshes both at the medium-term growing and non-growing season.
Combining Short-Term Event-Based Bed Level Dynamics and Medium-Term Seasonal Trends in Bed Level Change
When plotting event-based and seasonal bed level dynamics against each other, measurement stations where vegetation is present are all grouped in a parameter space delimited by relatively low event-based bed level change (i.e., standard deviation of bed level dynamics time series (Figure 11). We did not find specific seasonal limitations preventing vegetation presence. Vegetation was present at a short-term event-based bed level variability smaller than or equal to 12 mm, exceedance of this threshold was found to coincide with the absence of vegetation. This threshold was found to be valid both for natural and semi-natural salt marshes.
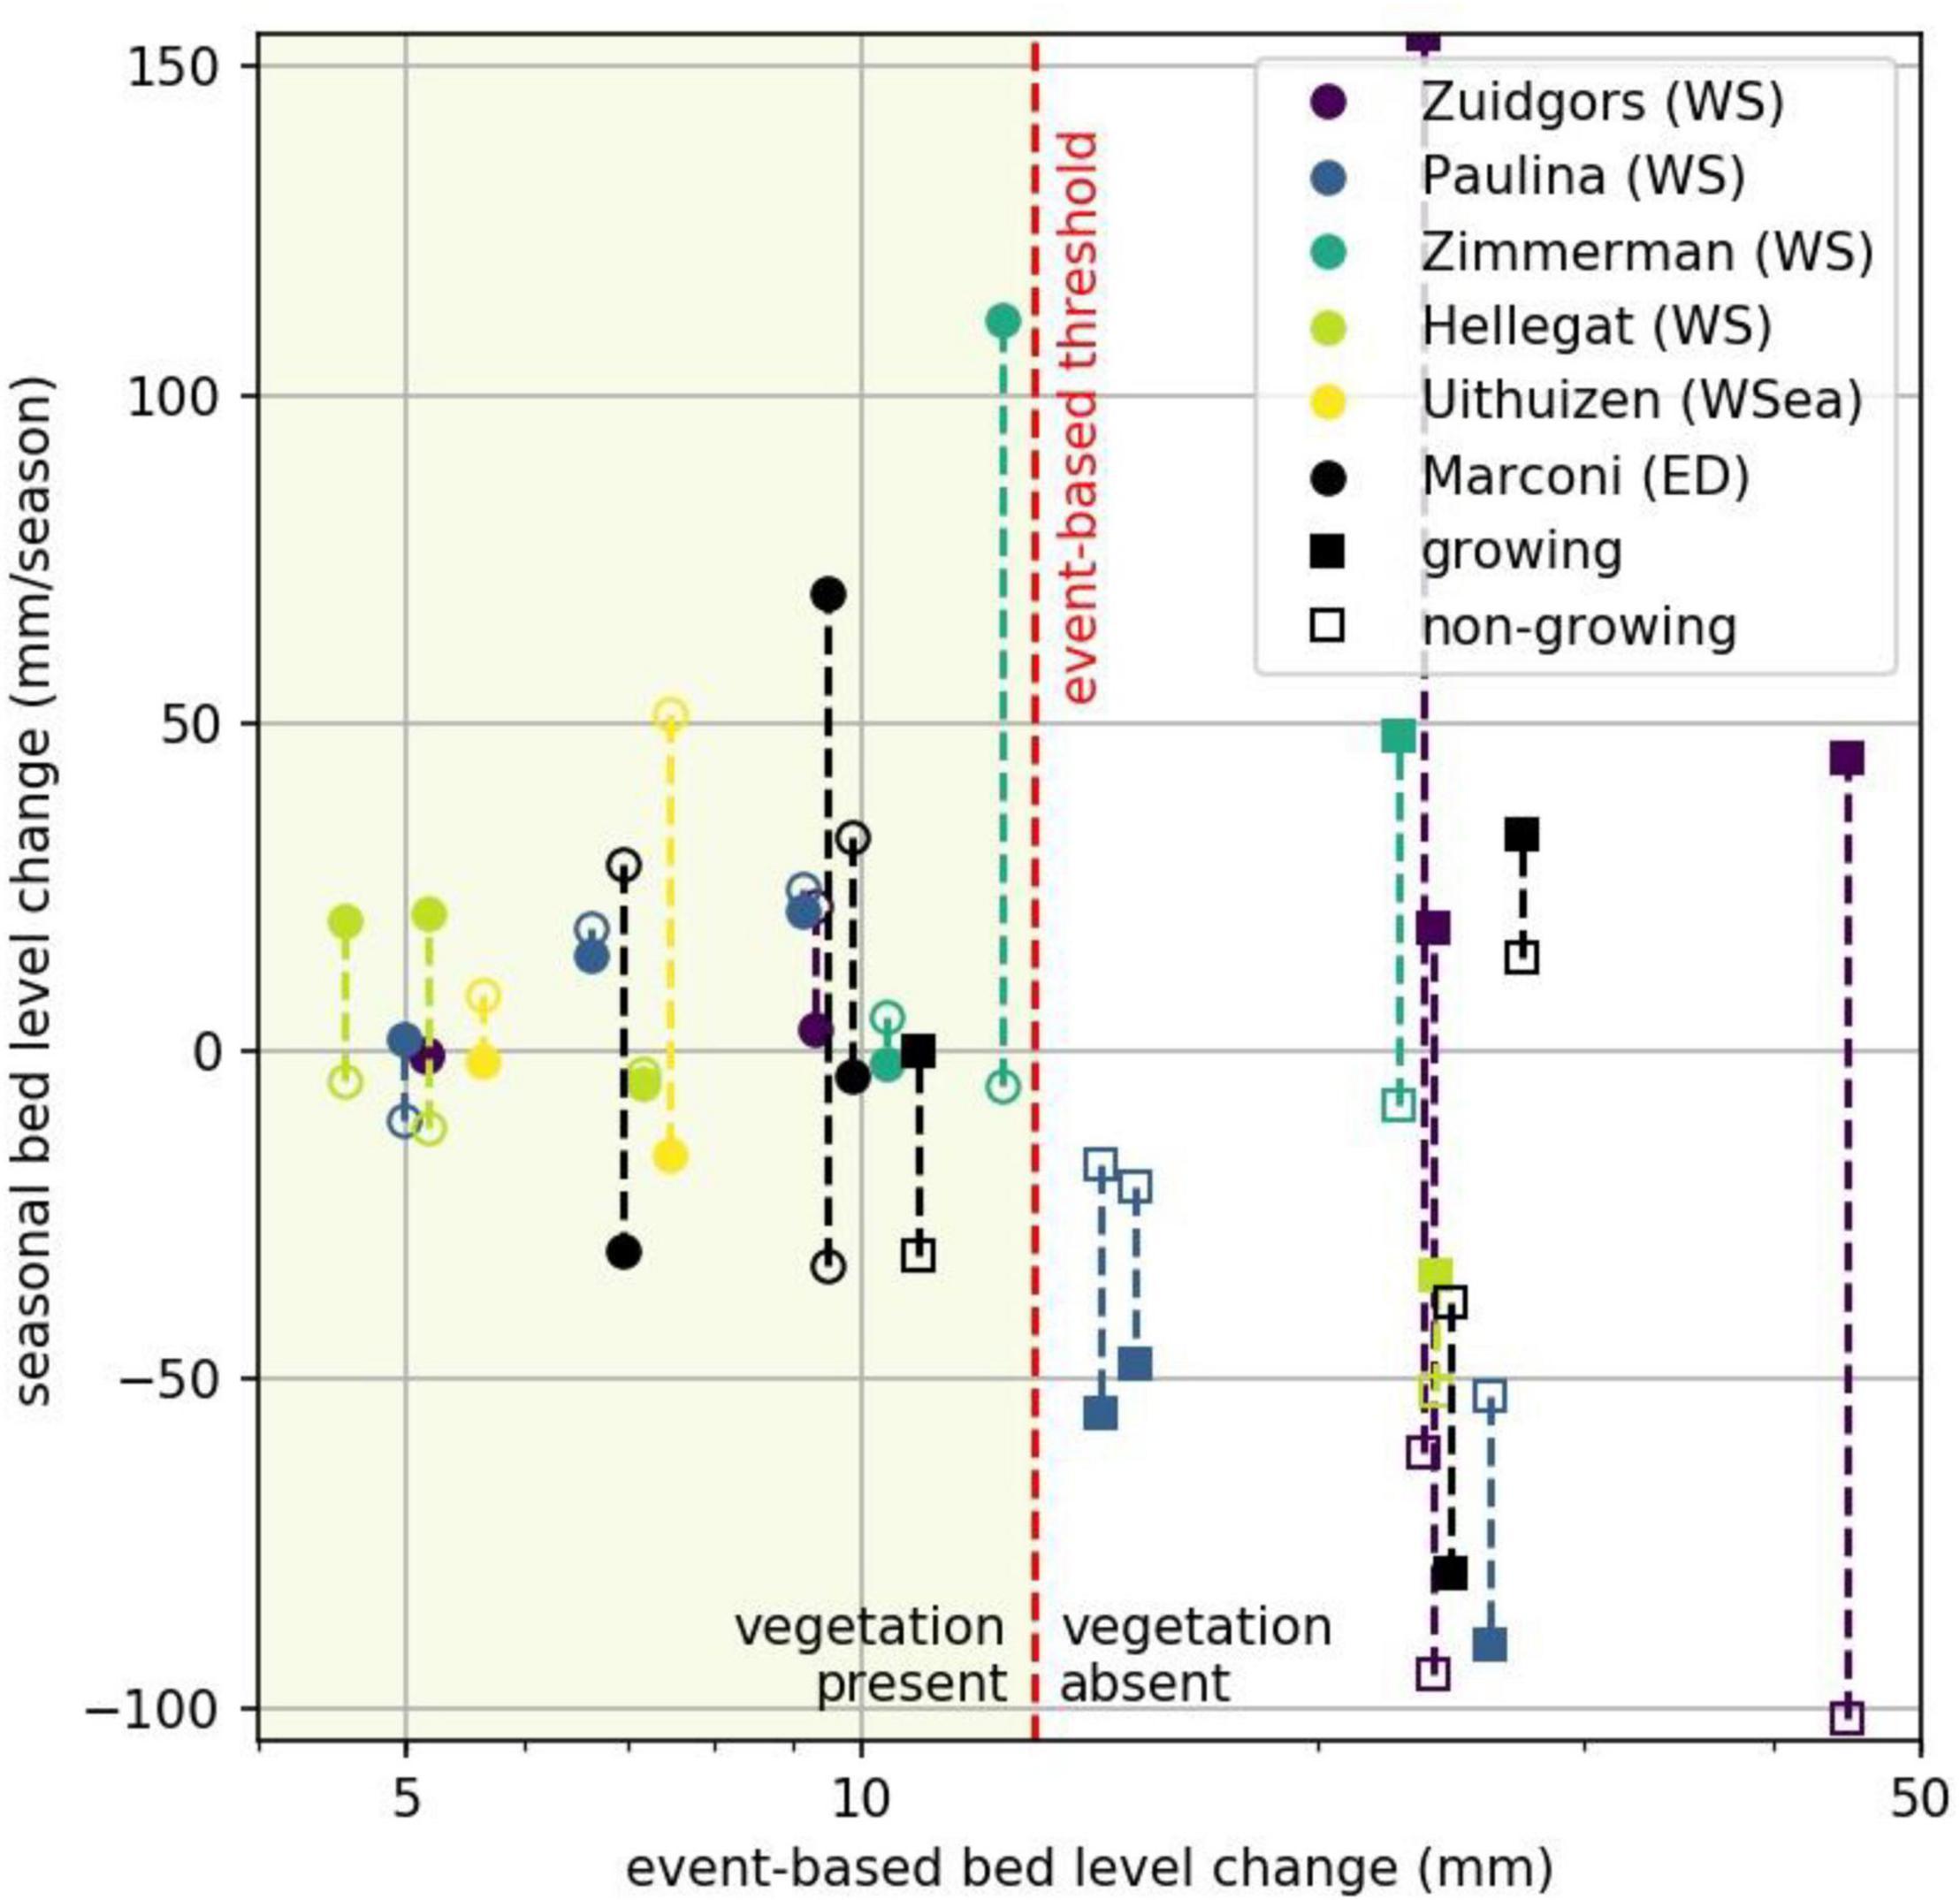
Figure 11. Short-term event-based bed level change represented by the standard deviation (x-axis; log-scale) and medium-term seasonal rates of bed level change (y-axis) for all measurement stations. The maximum event-based threshold delimits the bed-level dynamics for which vegetation is present (left of graph). Circles: vegetated, squares: non-vegetated, filled: growing season, open: non-growing season.
Discussion
The current study highlights that (1) physical observations of bed level change at different timescales are similar at natural and semi-natural salt marshes including the recently constructed semi-natural Marconi salt marsh. Short-term event-based bed level change (2) was observed to be significantly different at vegetated and unvegetated measurement stations, and (3) limited the presence of vegetation. Although seasonal trends were significantly different between vegetated and unvegetated measurement stations during the non-growing season, seasonal thresholds for vegetation presence were not observed. Hence, the threshold for event-based bed level dynamics was sufficient for explaining vegetation presence.
Monitoring High-Resolution Bed Level Dynamics
A unique dataset of high-resolution bed level dynamics was compiled using state-of-the-art A-SED and O-SED measurement instruments. Bed level dynamics were analyzed at 32 measurement stations distributed across six study sites at the North Sea coast of the Netherlands. Previous studies have highlighted the importance of field observations of bed level dynamics with a high vertical spatial and temporal resolution, for example quantifying the influence of storms and vegetation establishment (Hu et al., 2015a,b, 2020; Willemsen et al., 2018). The current study extends on these previous observations by introducing and validating the A-SED sensor. Unlike manual observations and measurements with other sensors such as the O-SED (e.g., Lawler, 1991; O’Brien et al., 2000; Stokes et al., 2010; Baptist et al., 2019), the A-SED sensors allow for autonomous and continuous measurement of bed level changes when measurement stations are submerged. This allows the new A-SED sensors to monitor bed level change in real-time under hydrodynamic exposure, as opposed to these dynamics being derived from comparing pre- and post- hydrodynamic exposure measurements of the bed level during low-tide manually or with autonomous instruments such as the O-SED. The A-SED sensor is not restricted by light conditions, which is an advantage over previous optical sensors (Lawler, 1991; Hu et al., 2015a). Accuracy of the A-SED (7.6 mm) and O-SED (5.0 mm) was rather similar (Hu et al., 2015a). The A-SED measurements and manual measurements were not taken at exactly the same time, since the A-SED measures when submerged (requiring a water depth of approximately 0.3 m for the measurement head to be submerged) and the manual measurements were obtained when the stations were emerged, which might have caused the small difference between both measurements, thereby decreasing the accuracy. Nevertheless, the rather good agreement between both measurements suggest that the A-SED sensor, similar to the O-SED sensor, is a reliable instrument for continuous and autonomous measurements of bed level change.
Morphodynamic Disturbances for Vegetation Presence
In general, event-based bed level dynamics and seasonal rates of change were greater at the unvegetated locations at each site individually. The stabilizing effect of vegetation on bed level dynamics (Gacia and Duarte, 2001; Möller et al., 2014), was present in the well-established marshes in the Western Scheldt and Wadden Sea, since established annual and perennial vegetation species were present at the start of the measurements. However, vegetation was not yet present at the pioneer semi-natural Marconi salt marsh at the start of the measurements. So at this site, there was only an effect of the bed level dynamics on the presence of vegetation whereas there was no or negligible feedback of the vegetation on bed level dynamics. Despite the different feedback mechanisms in well-established versus pioneer marshes, both event-based and seasonal-based bed level dynamics were similar at all study sites. Moreover, vegetated and unvegetated stations at all salt marshes were characterized by a single event-based threshold for vegetation presence. At Marconi a single measurement station where vegetation presence could be expected by its short-term dynamics, was unvegetated (Figure 11). This might be explained by the fact that Marconi was a recently constructed marsh and the marsh profile still is developing toward a dynamic equilibrium, or if exposure is increasing, a persistent erosive trend will prevent for the presence of vegetation (Figure 11). This development and/or trend might be represented in the rate of change during the non-growing season. Still, bed level dynamics along the elevational gradient at the edge zone of well-established (natural) marshes does give insights in maximum dynamics for vegetation presence at semi-natural salt marsh construction and restoration sites.
Previous studies suggest that colonization of the bare tidal flat by pioneer vegetation depends on short-term morphodynamic dynamics (Balke et al., 2011; Hu et al., 2015b; Silinski et al., 2016; Poppema et al., 2019). Short-term bed level dynamics can prevent successful germination and dislodge young seedlings if roots are not anchored sufficiently (Hu et al., 2015b). The current study combines the studies on short-term bed level dynamics with studies suggesting medium-term seasonal and annual bed level change as explanation for vegetation presence (Bouma et al., 2016; van Regteren et al., 2019). For example erosion of the bed in the winter season might remove viable seeds of annual species, thereby limiting vegetation presence in the subsequent growing season (van Regteren et al., 2019). Interestingly, a prohibitive effect of accretion on the presence of vegetation was not observed at our study sites. Our findings show that vegetation presence is mainly driven by short-term event-based bed level dynamics. This might indicate that vegetation presence was not limited by viable seed availability at our study sites. Only a single unvegetated measurement station at the Marconi marsh might be hampered by a medium-term trend at the non-growing season.
Implications for Salt Marsh Construction and Restoration
While the salt marsh edge at natural salt marshes is relatively stable over the period of a year (Allen, 2000; Van der Wal et al., 2008; Singh Chauhan, 2009; Willemsen et al., 2020), the semi-natural constructed Marconi salt marsh was still developing, i.e., vegetation had first appeared only 1 year before starting the measurements. Similarities in variability of bed level dynamics around the marsh edge, both at the natural and semi-natural salt marshes, imply that bed level dynamics around natural salt marshes can be used as a proxy for the outline of salt marsh construction and restoration schemes. Locations where more hydrodynamic energy is present, leading to increasing bed level dynamics, require a higher elevation for vegetation to develop, or need additional protection (Cao et al., 2018, 2019; Willemsen et al., 2018). Similar bed level dynamics at the salt marsh edge suggest that disturbance-decreasing measures at the constructed Marconi salt marsh have been successful in creating sheltered areas to enhance vegetation presence (c.f. Fivash et al., 2021; Gijón Mancheño et al., 2021).
General parameterizations, such as the morphodynamic thresholds for vegetation presence presented in this study, can provide key insights for predictions of vegetation growth in intertidal areas. The current study highlights that local short-term bed level dynamics, that may be altered by local (temporary) management measures, control vegetation presence (c.f. Hu et al., 2021). Balke et al. (2016) introduced a generic hydrodynamic threshold for the presence of vegetation at the salt marsh edge, based on tidal inundation frequency. Combined, these thresholds can be used (1) to predict salt marsh development, and (2) to design nature-based solutions incorporating salt marshes including the requirement of sheltering structures to prevent structural medium-term erosion. Moreover, the use of thresholds instead of process-based modules for vegetation development in biogeomorphological models (Kirwan and Murray, 2007; Temmerman et al., 2007; Tonelli et al., 2010; Hu et al., 2015b; Best et al., 2018; Schwarz et al., 2018; Poppema et al., 2019; Willemsen et al., 2022), provides a simple rule-based approach for the simulation of vegetation development in numerical models (Huang et al., 2008), decreasing their complexity without assuming static vegetation (Horstman et al., 2015; Willemsen et al., 2016). Hence, existing numerical hydro-morphodynamic models for designing nature-based solutions (e.g., Siemes et al., 2020), can include the development of salt marsh vegetation by only assessing whether intertidal environments are suitable for vegetation growth at different timescales, without increasing model complexity and computational cost. Obviously, a second step is to incorporate the feedbacks between the vegetation present and the hydro- and morphodynamics in its surroundings.
When aiming at salt marsh conservation, restoration or construction, e.g., for optimizing ecosystem services such as coastal protection (Möller et al., 2014) and carbon sequestration (Duarte et al., 2013), it is key to monitor the state of the ecosystem. In order to preserve the size of the ecosystem or to allow for its development, bed level dynamics induced by the combined action of tides and waves and modulated by the presence of vegetation should not exceed the event-based threshold that was identified to prevent vegetation from establishment and growth. The quantification of thresholds for bed level dynamics, combined with actively monitoring existing salt marshes and salt marsh restoration projects, provides critical insights on whether salt marsh systems are stable or will be accreting or eroding. Future research on longer-term periods than observed in the current study (years to decade) are essential for assessing the influence of climate change on long-term bed level change potentially hampering vegetation growth. Based on event-based and longer-term thresholds, adaptive management strategies can be developed. Once bed level dynamics come close to thresholds for vegetation presence, additional measures, such as construction of structures reducing physical stress and sediment nourishments, can be applied to protect the ecosystem and its services.
Conclusion
Present results suggest that event-based bed level dynamics can explain vegetation presence in salt marshes distributed across the Western Scheldt estuary, Wadden Sea and Ems-Dollard Estuary along the Dutch North Sea coast. Short-term bed level change is observed to provide a critical threshold for the presence of salt marsh vegetation. Vegetation at the well-established salt marsh was found to be present at event-based bed level variability smaller than or equal to 12 mm. The importance of local short-term dynamics for vegetation presence instead of longer-term dynamics highlights possibilities for developing preferential conditions for vegetation presence. So the limiting role of bed level dynamics on the presence of salt marsh vegetation is key to design and to predict the establishment of both restored and constructed salt marshes. Knowledge of these thresholds is critical for the development of adaptive management strategies for restoration and construction of salt marshes.
Data Availability Statement
Data and scripts in support of this manuscript for the Western Scheldt and Wadden Sea study site and SED data conversion are available via doi: 10.4121/uuid:c0be318c-9858-4a05-a546-782e29b4abef. Data and scripts for the Ems Dollard study site and ASED data conversion are available via doi: 10.4121/16782613.
Author Contributions
PW and MP conducted fieldwork for the study. MB was fieldwork leader of the constructed salt marsh. TB initiated the development of the optical-SED (O-SED) and acoustic-SED (A-SED) sensors used in this research. PW developed the post-processing script for the sensors and wrote the article with input from EH, TB, MB, MP, and BB. PW, EH, and BB designed the outline of the manuscript. All authors reviewed, revised, and approved the manuscript.
Funding
The Marconi field work was supported by the municipality of Delfzijl with funding from the Dutch Waddenfonds under grant number WF223001. Cash and in-kind co-funding was received from the consortium partners of EcoShape. Contributions by EH and PW were supported by the Mangrove-RESCUE project (Grant No. 15899), funded by the Dutch Research Council (NWO).
Conflict of Interest
The authors declare that the research was conducted in the absence of any commercial or financial relationships that could be construed as a potential conflict of interest.
Publisher’s Note
All claims expressed in this article are solely those of the authors and do not necessarily represent those of their affiliated organizations, or those of the publisher, the editors and the reviewers. Any product that may be evaluated in this article, or claim that may be made by its manufacturer, is not guaranteed or endorsed by the publisher.
Acknowledgments
We gratefully acknowledge A. de Vrieze and J. Veldman for their project guidance at the Marconi field site. We would like to thank Bente de Vries, Laura Coumou, Jelmer Cleveringa, Petra Dankers, and Kelly Elschot for collaboration during the EcoShape Marconi project. Furthermore, we would also like to thank A. Mus for extensively testing the A-SED sensors and J. van Dalen, L. van IJzerloo, and F. van Maarseveen for their technical assistance.
References
Allen, J. R. L. (2000). Morphodynamics of Holocene salt marshes: a review sketch from the Atlantic and Southern North Sea coasts of Europe. Quat. Sci. Rev. 19, 1155–1231. doi: 10.1016/S0277-3791(99)00034-7
Andersen, T. J., Pejrup, M., and Nielsen, A. A. (2006). Long-term and high-resolution measurements of bed level changes in a temperate, microtidal coastal lagoon. Mar. Geol. 226, 115–125. doi: 10.1016/j.margeo.2005.09.016
Baeyens, W., van Eck, B., Lambert, C., Wollast, R., and Goeyens, L. (1997). General description of the Scheldt estuary. Hydrobiologia 366, 1–14. doi: 10.1023/a:1003164009031
Balke, T., Bouma, T. J., Horstman, E. M., Webb, E. L., Erftemeijer, P. L. A., and Herman, P. M. J. (2011). Windows of opportunity: thresholds to mangrove seedling establishment on tidal flats. Mar. Ecol. Prog. Ser. 440, 1–9. doi: 10.3354/meps09364
Balke, T., Herman, P. M. J., and Bouma, T. J. (2014). Critical transitions in disturbance-driven ecosystems: identifying windows of opportunity for recovery. J. Ecol. 102, 700–708.1.
Balke, T., Stock, M., Jensen, K., Bouma, T. J., and Kleyer, M. (2016). A global analysis of the seaward salt marsh extent: the importance of tidal range. Water Resour. Res. 52, 3775–3786. doi: 10.1002/2015WR018318
Baptist, M. J., Dankers, P., Cleveringa, J., Sittoni, L., Willemsen, P. W. J. M., Puijenbroek van, M. E. B., et al. (2021). Salt marsh construction as a Nature-based solution in an estuarine social-ecological system, the ems estuary. Nat. Based Solut. 1:100005. doi: 10.1016/j.nbsj.2021.100005
Baptist, M. J., Gerkema, T., van Prooijen, B. C., van Maren, D. S., van Regteren, M., Schulz, K., et al. (2019). Beneficial use of dredged sediment to enhance salt marsh development by applying a ‘Mud Motor’. Ecol. Eng. 127, 312–323. doi: 10.1016/j.ecoleng.2018.11.019
Barbier, E. B., Koch, E. W., Silliman, B. R., Hacker, S. D., Wolanski, E., Primavera, J., et al. (2008). Coastal ecosystem-based management with nonlinear ecological functions and values. Science 319, 321–323. doi: 10.1126/science.1150349
Best, ÜS. N., Van der Wegen, M., Dijkstra, J., Willemsen, P. W. J. M., Borsje, B. W., and Roelvink, D. J. A. (2018). Do salt marshes survive sea level rise? Modelling wave action, morphodynamics and vegetation dynamics. Environ. Modelling Softw. 109, 152–166. doi: 10.1016/j.envsoft.2018.08.004
Borsje, B. W., van Wesenbeeck, B. K., Dekker, F., Paalvast, P., Bouma, T. J., van Katwijk, M. M., et al. (2011). How ecological engineering can serve in coastal protection. Ecol. Eng. 37, 113–122. doi: 10.1016/j.ecoleng.2010.11.027
Bouma, T. J., van Belzen, J., Balke, T., van Dalen, J., Klaassen, P., Hartog, A. M., et al. (2016). Short-term mudflat dynamics drive long-term cyclic salt marsh dynamics. Limnol. Oceanogr. 61, 2261–2275. doi: 10.1002/lno.10374
Bouma, T. J., van Belzen, J., Balke, T., Zhu, Z., Airoldi, L., Blight, A. J., et al. (2014). Identifying knowledge gaps hampering application of intertidal habitats in coastal protection: opportunities & steps to take. Coast. Eng. 87, 147–157. doi: 10.1016/j.coastaleng.2013.11.014
Callaghan, D. P., Bouma, T. J., Klaassen, P., van der Wal, D., Stive, M. J. F., and Herman, P. M. J. (2010). Hydrodynamic forcing on salt-marsh development: distinguishing the relative importance of waves and tidal flows. Estuar. Coast. Shelf Sci. 89, 73–88. doi: 10.1016/j.ecss.2010.05.013
Cao, H., Zhu, Z., Balke, T., Zhang, L., and Bouma, T. J. (2018). Effects of sediment disturbance regimes on Spartina seedling establishment: Implications for salt marsh creation and restoration. Limnol. Oceanogr. 63, 647–659. doi: 10.1002/lno.10657
Cao, H., Zhu, Z., James, R., Herman, P. M. J., Zhang, L., Yuan, L., et al. (2019). Wave effects on seedling establishment of three pioneer marsh species: survival, morphology and biomechanics. Ann. Bot. 125, 345–352. doi: 10.1093/aob/mcz136
Cox, R., Wadsworth, R. A., and Thomson, A. G. (2003). Long-term changes in salt marsh extent affected by channel deepening in a modified estuary. Cont. Shelf Res. 23, 1833–1846. doi: 10.1016/j.csr.2003.08.002
Damme, S. V., Struyf, E., Maris, T., Ysebaert, T., Dehairs, F., Tackx, M., et al. (2005). Spatial and temporal patterns of water quality along the estuarine salinity gradient of the Scheldt estuary (Belgium and The Netherlands): results of an integrated monitoring approach. Hydrobiologia 540, 29–45. doi: 10.1007/s10750-004-7102-2
De Vries, B., Willemsen, P., Van Puijenbroek, M., Coumou, L., Baptist, M., Cleveringa, J., et al. (2021). Salt Marsh Pilot Marconi Monitoring Results (Report). Dordrecht: Ecoshape.
Dieckmann, R., Osterthun, M., and Partenscky, H. W. (1987). Influence of water-level elevation and tidal range on the sedimentation in a German tidal flat area. Prog. Oceanogr. 18, 151–166. doi: 10.1016/0079-6611(87)90031-0
Duarte, C. M., Losada, I. J., Hendriks, I. E., Mazarrasa, I., and Marbà, N. (2013). The role of coastal plant communities for climate change mitigation and adaptation. Nat. Clim. Change 3:961. doi: 10.1038/nclimate1970
Esselink, P., Dijkema, K. S., Sabine, R., and Geert, H. (1998). Vertical accretion and profile changes in abandoned man-made tidal marshes in the dollard estuary, the Netherlands. J. Coast. Res. 14, 570–582.
Fivash, G. S., Temmink, R. J. M., D’Angelo, M., van Dalen, J., Lengkeek, W., Didderen, K., et al. (2021). Restoration of biogeomorphic systems by creating windows of opportunity to support natural establishment processes. Ecol. Appl. 31:e2333. doi: 10.1002/eap.2333
Folmer, E., Dekinga, A., Holthuijsen, S., Van der Meer, J., Mosk, D., Piersma, T., et al. (2017). Species Distribution Models Intertidal Benthos: Tools For Assessing The Impact Of Physical And Morphological Drivers O Benthos And Birds In The Wadden Sea (Report).
Ford, M. A., Cahoon, D. R., and Lynch, J. C. (1999). Restoring marsh elevation in a rapidly subsiding salt marsh by thin-layer deposition of dredged material1Mention of trade names or commercial products does not constitute an endorsement or recommendation for use by the US Government.1. Ecol. Eng. 12, 189–205. doi: 10.1016/s0925-8574(98)00061-5
Gacia, E., and Duarte, C. M. (2001). Sediment retention by a mediterranean posidonia oceanica meadow: the balance between deposition and resuspension. Estuar. Coast. Shelf Sci. 52, 505–514. doi: 10.1006/ecss.2000.0753
Gijón Mancheño, A., Jansen, W., Uijttewaal, W. S. J., Reniers, A. J. H. M., van Rooijen, A. A., Suzuki, T., et al. (2021). Wave transmission and drag coefficients through dense cylinder arrays: implications for designing structures for mangrove restoration. Ecol. Eng. 165:106231. doi: 10.1016/j.ecoleng.2021.106231
Harmsworth, G. C., and Long, S. P. (1986). An assessment of saltmarsh erosion in Essex, England, with reference to the dengie peninsula. Biol. Conserv. 35, 377–387. doi: 10.1016/0006-3207(86)90095-9
Horstman, E. M., Dohmen-Janssen, C. M., Bouma, T. J., and Hulscher, S. J. M. H. (2015). Tidal-scale flow routing and sedimentation in mangrove forests: combining field data and numerical modelling. Geomorphology 228, 244–262. doi: 10.1016/j.geomorph.2014.08.011
Hu, Z., Borsje, B. W., van Belzen, J., Willemsen, P. W. J. M., Wang, H., Peng, Y., et al. (2021). Mechanistic modeling of marsh seedling establishment provides a positive outlook for coastal wetland restoration under global climate change. Geophys. Res. Lett. 48:e2021GL095596.
Hu, Z., van Belzen, J., van der Wal, D., Balke, T., Wang, Z. B., Stive, M., et al. (2015b). Windows of opportunity for salt marsh vegetation establishment on bare tidal flats: the importance of temporal and spatial variability in hydrodynamic forcing. J. Geophys. Res. 120, 1450–1469. doi: 10.1002/2014JG002870
Hu, Z., Lenting, W., van der Wal, D., and Bouma, T. J. (2015a). Continuous monitoring bed-level dynamics on an intertidal flat: introducing novel, stand-alone high-resolution SED-sensors. Geomorphology 245, 223–230. doi: 10.1016/j.geomorph.2015.05.027
Hu, Z., Willemsen, P. W. J. M., Borsje, B. W., Wang, C., Wang, H., van der Wal, D., et al. (2020). High resolution bed level change and synchronized biophysical data from 10 tidal flats in northwestern Europe. Earth Syst. Sci. Data Discuss. 2020, 1–19. doi: 10.5194/essd-2020-78
Hu, Z., Yao, P., van der Wal, D., and Bouma, T. J. (2017). Patterns and drivers of daily bed-level dynamics on two tidal flats with contrasting wave exposure. Sci. Rep. 7:7088. doi: 10.1038/s41598-017-07515-y
Huang, H.-M., Zhang, L.-Q., Guan, Y.-J., and Wang, D.-H. (2008). A cellular automata model for population expansion of Spartina alterniflora at Jiuduansha Shoals, Shanghai, China. Estuar. Coast. Shelf Sci. 77, 47–55. doi: 10.1016/j.ecss.2007.09.003
Kirwan, M. L., and Murray, A. B. (2007). A coupled geomorphic and ecological model of tidal marsh evolution. Proc. Natl. Acad. Sci. U.S.A. 104, 6118–6122. doi: 10.1073/pnas.0700958104
Ladd, C. J. T., Duggan-Edwards, M. F., Bouma, T. J., Pagès, J. F., and Skov, M. W. (2019). Sediment supply explains long-term and large-scale patterns in salt marsh lateral expansion and erosion. Geophys. Res. Lett. 46, 11178–11187. doi: 10.1029/2019gl083315
Lawler, D. M. (1991). A new technique for the automatic monitoring of erosion and deposition rates. Water Resour. Res. 27, 2125–2128. doi: 10.1029/91wr01191
Lawler, D. M. (2008). Advances in the continuous monitoring of erosion and deposition dynamics: developments and applications of the new PEEP-3T system. Geomorphology 93, 17–39. doi: 10.1016/j.geomorph.2006.12.016
Londo, G. (1976). The decimal scale for releves of permanent quadrats. Vegetatio 33, 61–64. doi: 10.1007/BF00055300
Maris, T., Cox, T., Temmerman, S., De Vleeschauwer, P., Van Damme, S., De Mulder, T., et al. (2007). Tuning the tide: creating ecological conditions for tidal marsh development in a flood control area. Hydrobiologia 588, 31–43. doi: 10.1007/s10750-007-0650-5
Mazik, K., Smith, J. E., Leighton, A., and Elliott, M. (2007). Physical and biological development of a newly breached managed realignment site, Humber estuary, UK. Mar. Pollut. Bull. 55, 564–578. doi: 10.1016/j.marpolbul.2007.09.017
Möller, I., Kudella, M., Rupprecht, F., Spencer, T., Paul, M., van Wesenbeeck, B. K., et al. (2014). Wave attenuation over coastal salt marshes under storm surge conditions. Nat. Geosci. 7, 727–731. doi: 10.1038/ngeo2251
Moskalski, S. M., and Sommerfield, C. K. (2012). Suspended sediment deposition and trapping efficiency in a Delaware salt marsh. Geomorphology 139-140, 195–204. doi: 10.1016/j.geomorph.2011.10.018
O’Brien, D. J., Whitehouse, R. J. S., and Cramp, A. (2000). The cyclic development of a macrotidal mudflat on varying timescales. Cont. Shelf Res. 20, 1593–1619. doi: 10.1016/S0278-4343(00)00039-X
Poppema, D. W., Willemsen, P. W. J. M., de Vries, M. B., Zhu, Z., Borsje, B. W., and Hulscher, S. J. M. H. (2019). Experiment-supported modelling of salt marsh establishment. Ocean Coast. Manag. 168, 238–250. doi: 10.1016/j.ocecoaman.2018.10.039
Pringle, A. W. (1995). Erosion of a cyclic saltmarsh in Morecambe Bay, North-West England. Earth Surf. Process. Landf. 20, 387–405. doi: 10.1002/esp.3290200502
Pye, K. (1995). Controls on long-term saltmarsh accretion and erosion in the wash, Eastern England. J. Coast. Res. 11, 337–356.
Rahman, H., Sherren, K., and van Proosdij, D. (2019). Institutional innovation for nature-based coastal adaptation: lessons from salt marsh restoration in nova scotia Canada. Sustainability 11:6735.
Rand, T. A. (2000). Seed dispersal, habitat suitability and the distribution of halophytes across a salt marsh tidal gradient. J. Ecol. 88, 608–621. doi: 10.1046/j.1365-2745.2000.00484.x
Schrift, A. M., Mendelssohn, I. A., and Materne, M. D. (2008). Salt marsh restoration with sediment-slurry amendments following a drought-induced large-scale disturbance. Wetlands 28, 1071–1085. doi: 10.1672/07-78.1
Schwarz, C., Gourgue, O., van Belzen, J., Zhu, Z., Bouma, T. J., van de Koppel, J., et al. (2018). Self-organization of a biogeomorphic landscape controlled by plant life-history traits. Nat. Geosci. 11, 672–677. doi: 10.1038/s41561-018-0180-y
Schwimmer, R. (2001). Rates and processes of marsh shoreline erosion in rehoboth bay, delaware, U.S.A. J. Coast. Res. 17, 672–683. doi: 10.2307/4300218
Siemes, R., Borsje, B. W., Daggenvoorde, R., and Hulscher, S. (2020). Artificial structures steer morphological development of salt marshes: a model study. J. Mar. Sci. Eng. 8:326. doi: 10.3390/jmse8050326
Silinski, A., van Belzen, J., Fransen, E., Bouma, T. J., Troch, P., Meire, P., et al. (2016). Quantifying critical conditions for seaward expansion of tidal marshes: a transplantation experiment. Estuar. Coast. Shelf Sci. 169, 227–237. doi: 10.1016/j.ecss.2015.12.012
Singh Chauhan, P. P. (2009). Autocyclic erosion in tidal marshes. Geomorphology 110, 45–57. doi: 10.1016/j.geomorph.2009.03.016
Stokes, D. J., Healy, T. R., and Cooke, P. J. (2010). Expansion dynamics of monospecific, temperate mangroves and sedimentation in two embayments of a barrier-enclosed lagoon, tauranga harbour, New Zealand. J. Coast. Res. 26, 113–122. doi: 10.2112/08-1043.1
Temmerman, S., Bouma, T. J., Van de Koppel, J., Van der Wal, D., De Vries, M. B., and Herman, P. M. J. (2007). Vegetation causes channel erosion in a tidal landscape. Geology 35, 631–634. doi: 10.1130/g23502a.1
Temmerman, S., Meire, P., Bouma, T. J., Herman, P. M. J., Ysebaert, T., and De Vriend, H. J. (2013). Ecosystem-based coastal defence in the face of global change. Nature 504, 79–83. doi: 10.1038/nature12859
Tonelli, M., Fagherazzi, S., and Petti, M. (2010). Modeling wave impact on salt marsh boundaries. J. Geophys. Res. 115:C09028.
van der Wal, D., and Pye, K. (2004). Patterns, rates and possible causes of saltmarsh erosion in the Greater Thames area (UK). Geomorphology 61, 373–391. doi: 10.1016/j.geomorph.2004.02.005
van der Wal, D., Pye, K., and Neal, A. (2002). Long-term morphological change in the Ribble Estuary, northwest England. Mar. Geol. 189, 249–266.
Van der Wal, D., Wielemaker-Van den Dool, A., and Herman, P. M. J. (2008). Spatial patterns, rates and mechanisms of saltmarsh cycles (Westerschelde, The Netherlands). Estuar. Coast. Shelf Sci. 76, 357–368. doi: 10.1016/j.ecss.2007.07.017
van Loon-Steensma, J. M. (2015). Salt marshes to adapt the flood defences along the Dutch Wadden Sea coast. Mitig. Adapt. Strateg. Glob. Change 20, 929–948. doi: 10.1007/s11027-015-9640-5
van Regteren, M., Colosimo, I., de Vries, P., van Puijenbroek, M. E. B., Freij, V. S., Baptist, M. J., et al. (2019). Limited seed retention during winter inhibits vegetation establishment in spring, affecting lateral marsh expansion capacity. Ecol. Evol. 9, 13294–13308. doi: 10.1002/ece3.5781
van Regteren, M., Meesters, E. H., Baptist, M. J., de Groot, A. V., Bouma, T. J., and Elschot, K. (2020b). Multiple environmental variables affect germination and mortality of an annual salt marsh pioneer: Salicornia procumbens. Estuar. Coasts 43, 1489–1501. doi: 10.1007/s12237-020-00735-y
van Regteren, M., Amptmeijer, D., de Groot, A. V., Baptist, M. J., and Elschot, K. (2020a). Where does the salt marsh start? Field-based evidence for the lack of a transitional area between a gradually sloping intertidal flat and salt marsh. Estuar. Coast. Shelf Sci. 243:106909.
van Regteren, M., ten Boer, R., Meesters, E. H., and de Groot, A. V. (2017). Biogeomorphic impact of oligochaetes (Annelida) on sediment properties and Salicornia spp. seedling establishment. Ecosphere 8:e01872.
Vuik, V., Borsje, B. W., Willemsen, P. W. J. M., and Jonkman, S. N. (2019). Salt marshes for flood risk reduction: quantifying long-term effectiveness and life-cycle costs. Ocean Coast. Manag. 171, 96–110. doi: 10.1016/j.ocecoaman.2019.01.010
Willemsen, P. W. J. M., Borsje, B. W., Hulscher, S. J. M. H., Van der Wal, D., Zhu, Z., Oteman, B., et al. (2018). Quantifying bed level change at the transition of tidal flat and salt marsh: can we understand the lateral location of the marsh edge? J. Geophys. Res. 123, 2509–2524. doi: 10.1029/2018JF004742
Willemsen, P. W. J. M., Borsje, B. W., Vuik, V., Bouma, T. J., and Hulscher, S. J. M. H. (2020). Field-based decadal wave attenuating capacity of combined tidal flats and salt marshes. Coast. Eng. 156:103628. doi: 10.1016/j.coastaleng.2019.103628
Willemsen, P. W. J. M., Horstman, E. M., Borsje, B. W., Friess, D. A., and Dohmen-Janssen, C. M. (2016). Sensitivity of the sediment trapping capacity of an estuarine mangrove forest. Geomorphology 273, 189–201.
Willemsen, P. W. J. M., Smits, B. P., Borsje, B. W., Herman, P. M. J., Dijkstra, J. T., Bouma, T. J., et al. (2022). Modelling decadal salt marsh development: variability of the salt marsh extent under influence of waves and sediment availability. Water Resour. Res. 58:e2020WR028962. doi: 10.1029/2020WR028962
Wolters, M., and Bakker, J. P. (2002). Soil seed bank and driftline composition along a successional gradient on a temperate salt marsh. Appl. Veg. Sci. 5, 55–62.
Ysebaert, T. J. W., Tjalling van der Wal, J., Tangelder, M., De Groot, A. V., and Baptist, M. J. (2016). Ecotopenkaart Voor Het Eems-Dollard Estuarium (C095/15) (Report). IJmuiden: IMARES Wageningen UR.
Zhu, Z., Vuik, V., Visser, P. J., Soens, T., van Wesenbeeck, B., van de Koppel, J., et al. (2020). Historic storms and the hidden value of coastal wetlands for nature-based flood defence. Nat. Sustain. 3, 853–862. doi: 10.1038/s41893-020-0556-z
Zimmerman, J. T. F. (1976). Mixing and flushing of tidal embayments in the western Dutch Wadden Sea part I: distribution of salinity and calculation of mixing time scales. Netherlands J. Sea Res. 10, 149–191.
Appendix 1
A-SED data conversion
The A-SED sensor is a stand-alone monitoring device for the measurement of bed level changes in submerged intertidal areas. The device consists of a vacuum housing containing a battery pack (eight alkaline AA batteries), circuit board and measurement head (Appendix Figure A1). The transparent housing is waterproof, with an airlock on top. Multiple LEDs are mounted on the circuit board, indicating the status of the device. Moreover, a magnet switch is installed on the circuit board to activate the instrument to establish a WiFi signal that is used to connect with a computer or mobile device. Once connected, A-SED settings and deployment settings can be adapted using a web browser. The measurement head at the bottom of the instrument consists of (1) two transducers for transmitting and receiving an acoustic signal for monitoring the distance between the instrument head and the bed, (2) a pressure gauge protected with a tube, and (3) a temperature sensor (Appendix Figure A1). The pressure is measured with increments of 0.1 mbar, both when the instrument is emergent and submerged. The temperature is monitored in degrees Celsius with a 2-decimal accuracy.
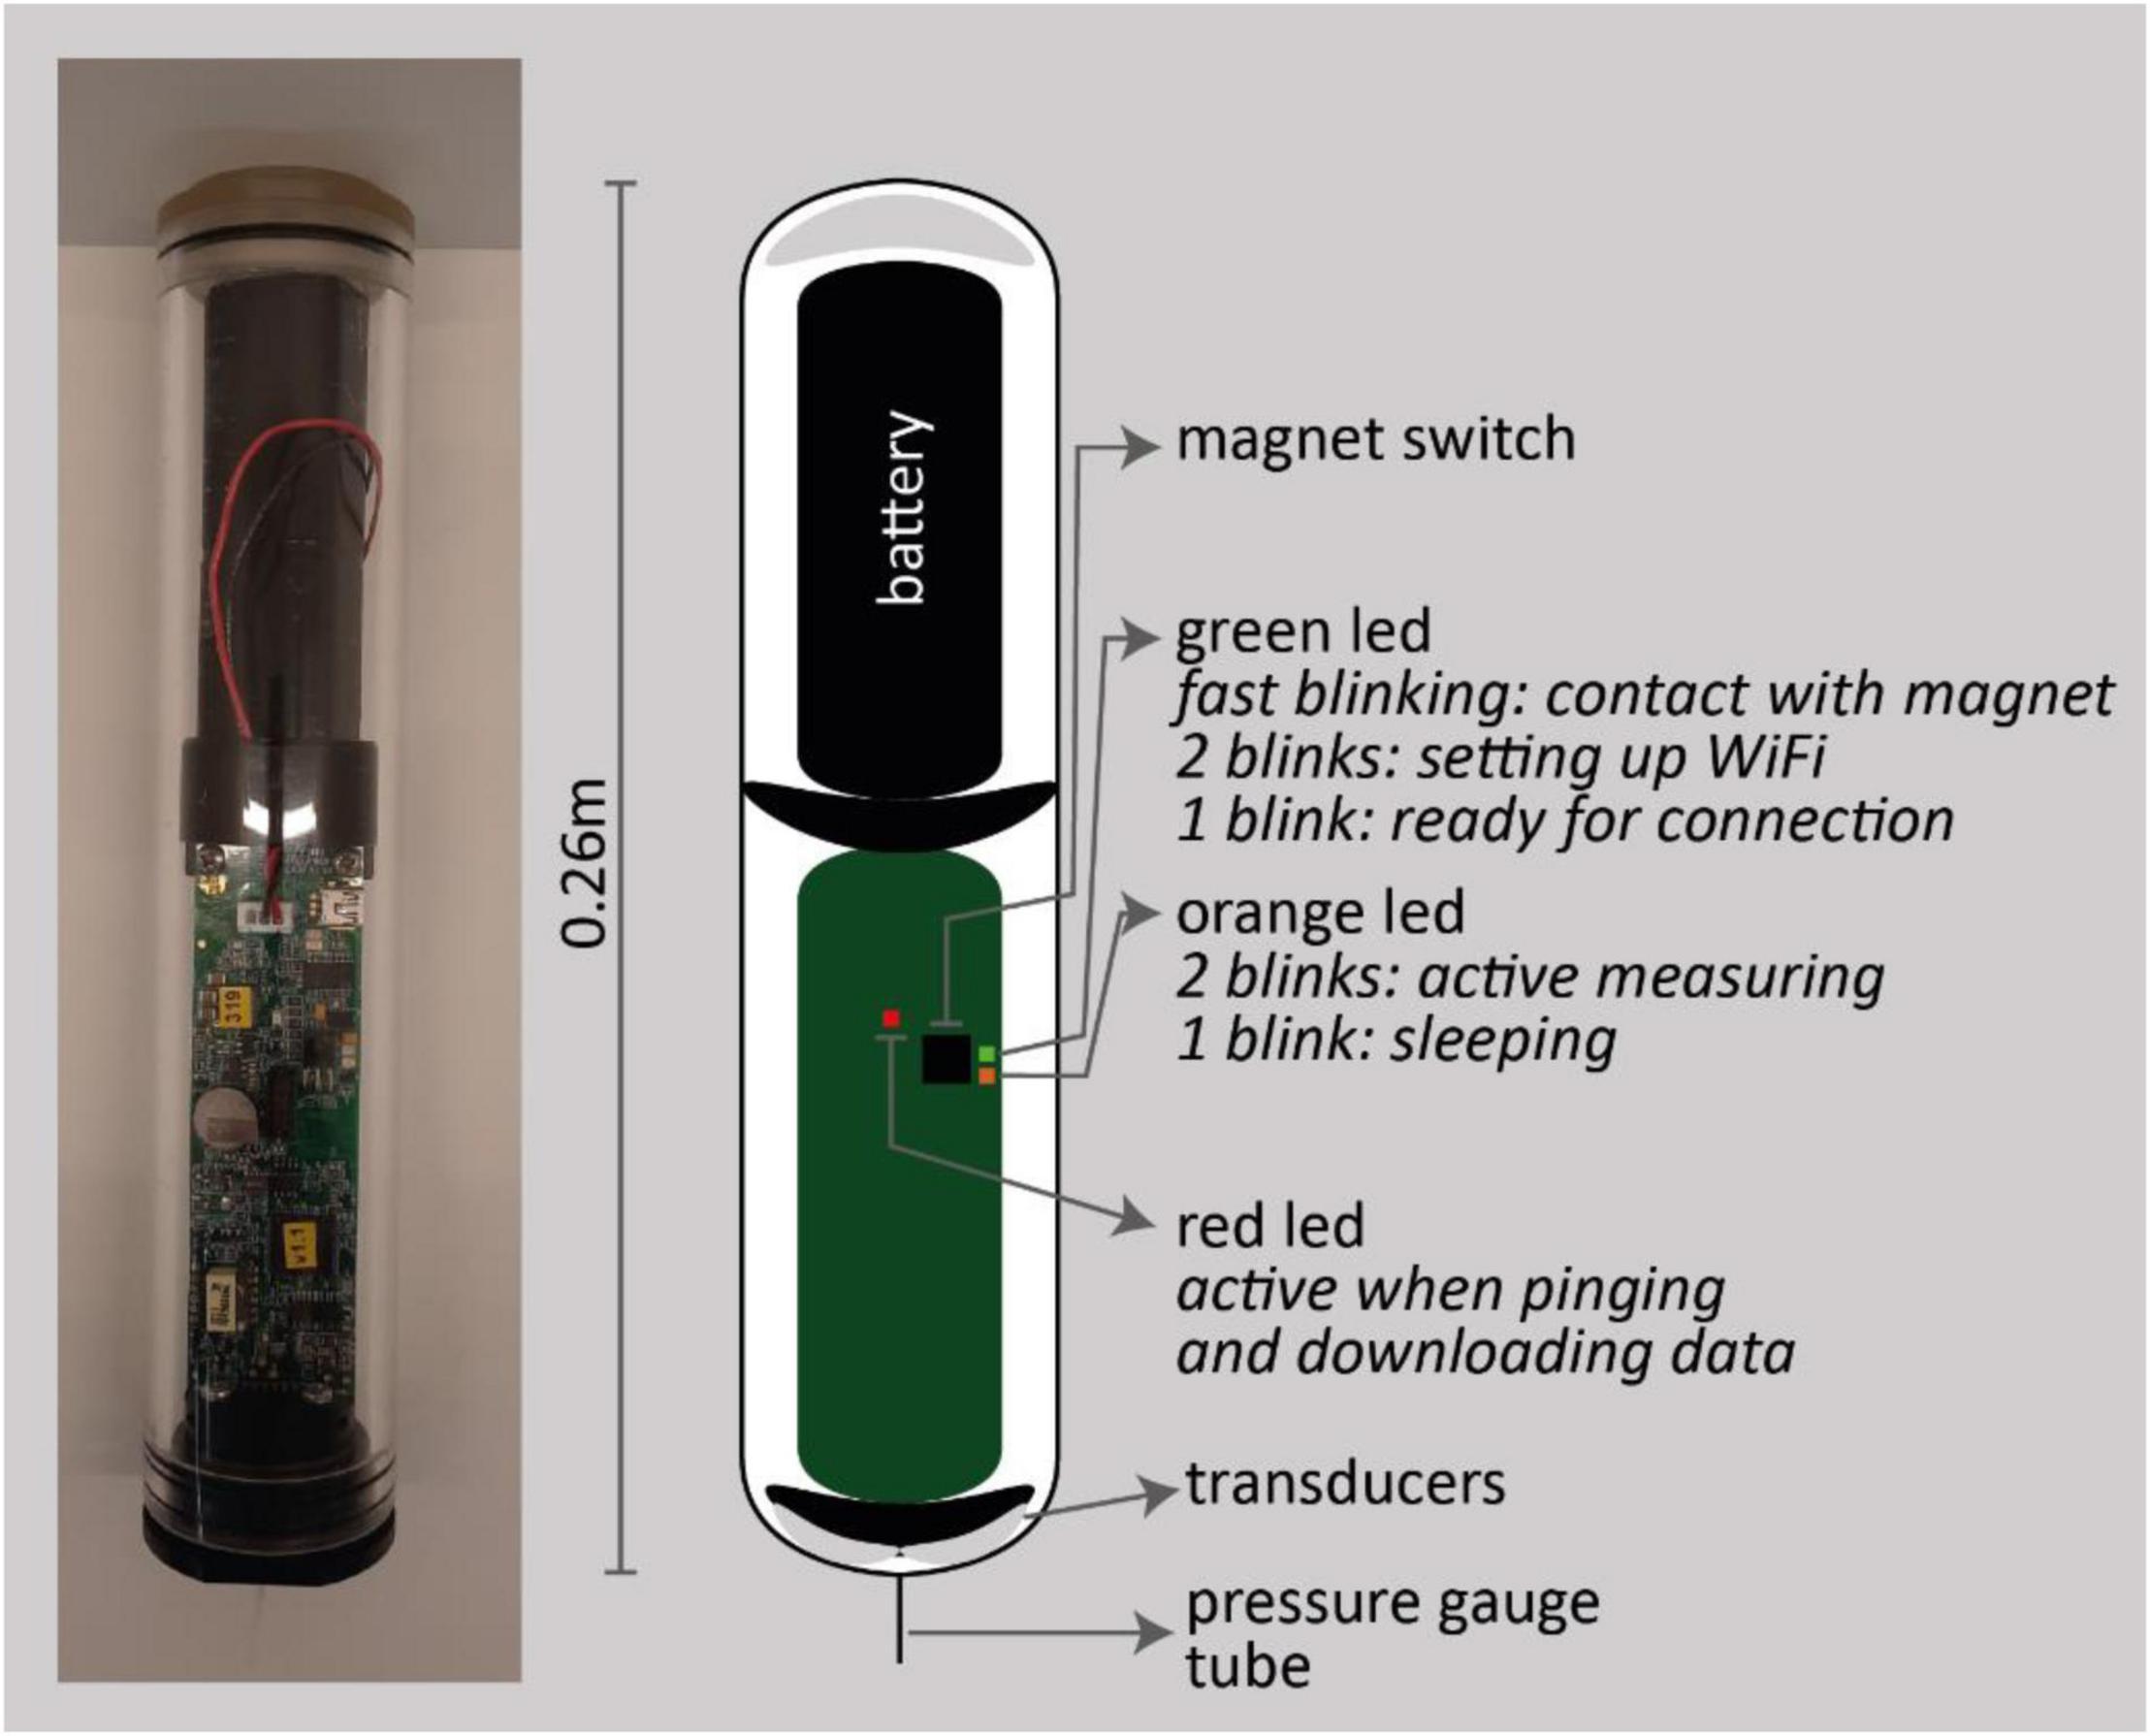
Appendix Figure A1. Picture (left) and schematization (right) of A-SED instrument.
Bed level dynamics can be monitored with a number of samples at a fixed burst interval. In the current study a burst of 8 measurements (burst frequency is 5 Hz) was applied with an interval of 5–15 min. Since the A-SED instrument only collects data when inundated, the burst interval can be larger when the inundation period is relatively large at a measurement station and needs to be smaller when the inundation period is relatively shorter, in order to collect sufficient data during instrument submergence. Bed level dynamics are obtained with an acoustic signal of 300 kHz. The raw signal is transmitted by one transducer (emitter) and, after being reflected by the bed, received by the second transducer (receiver). The signal is received and stored every 250 ns over a domain of 4,000 timesteps (Appendix Figure A2). Due to initial contamination (initial noise) of the received signal due to the preceding signal emission (approximately first 500 timesteps in Appendix Figure A2), the optimal height above the bed of the instrument is 20–50 cm. After this initial noise dies out, a peak can be observed in the received signal which is induced by the reflection of the acoustic signal at the bed (Appendix Figure A2).
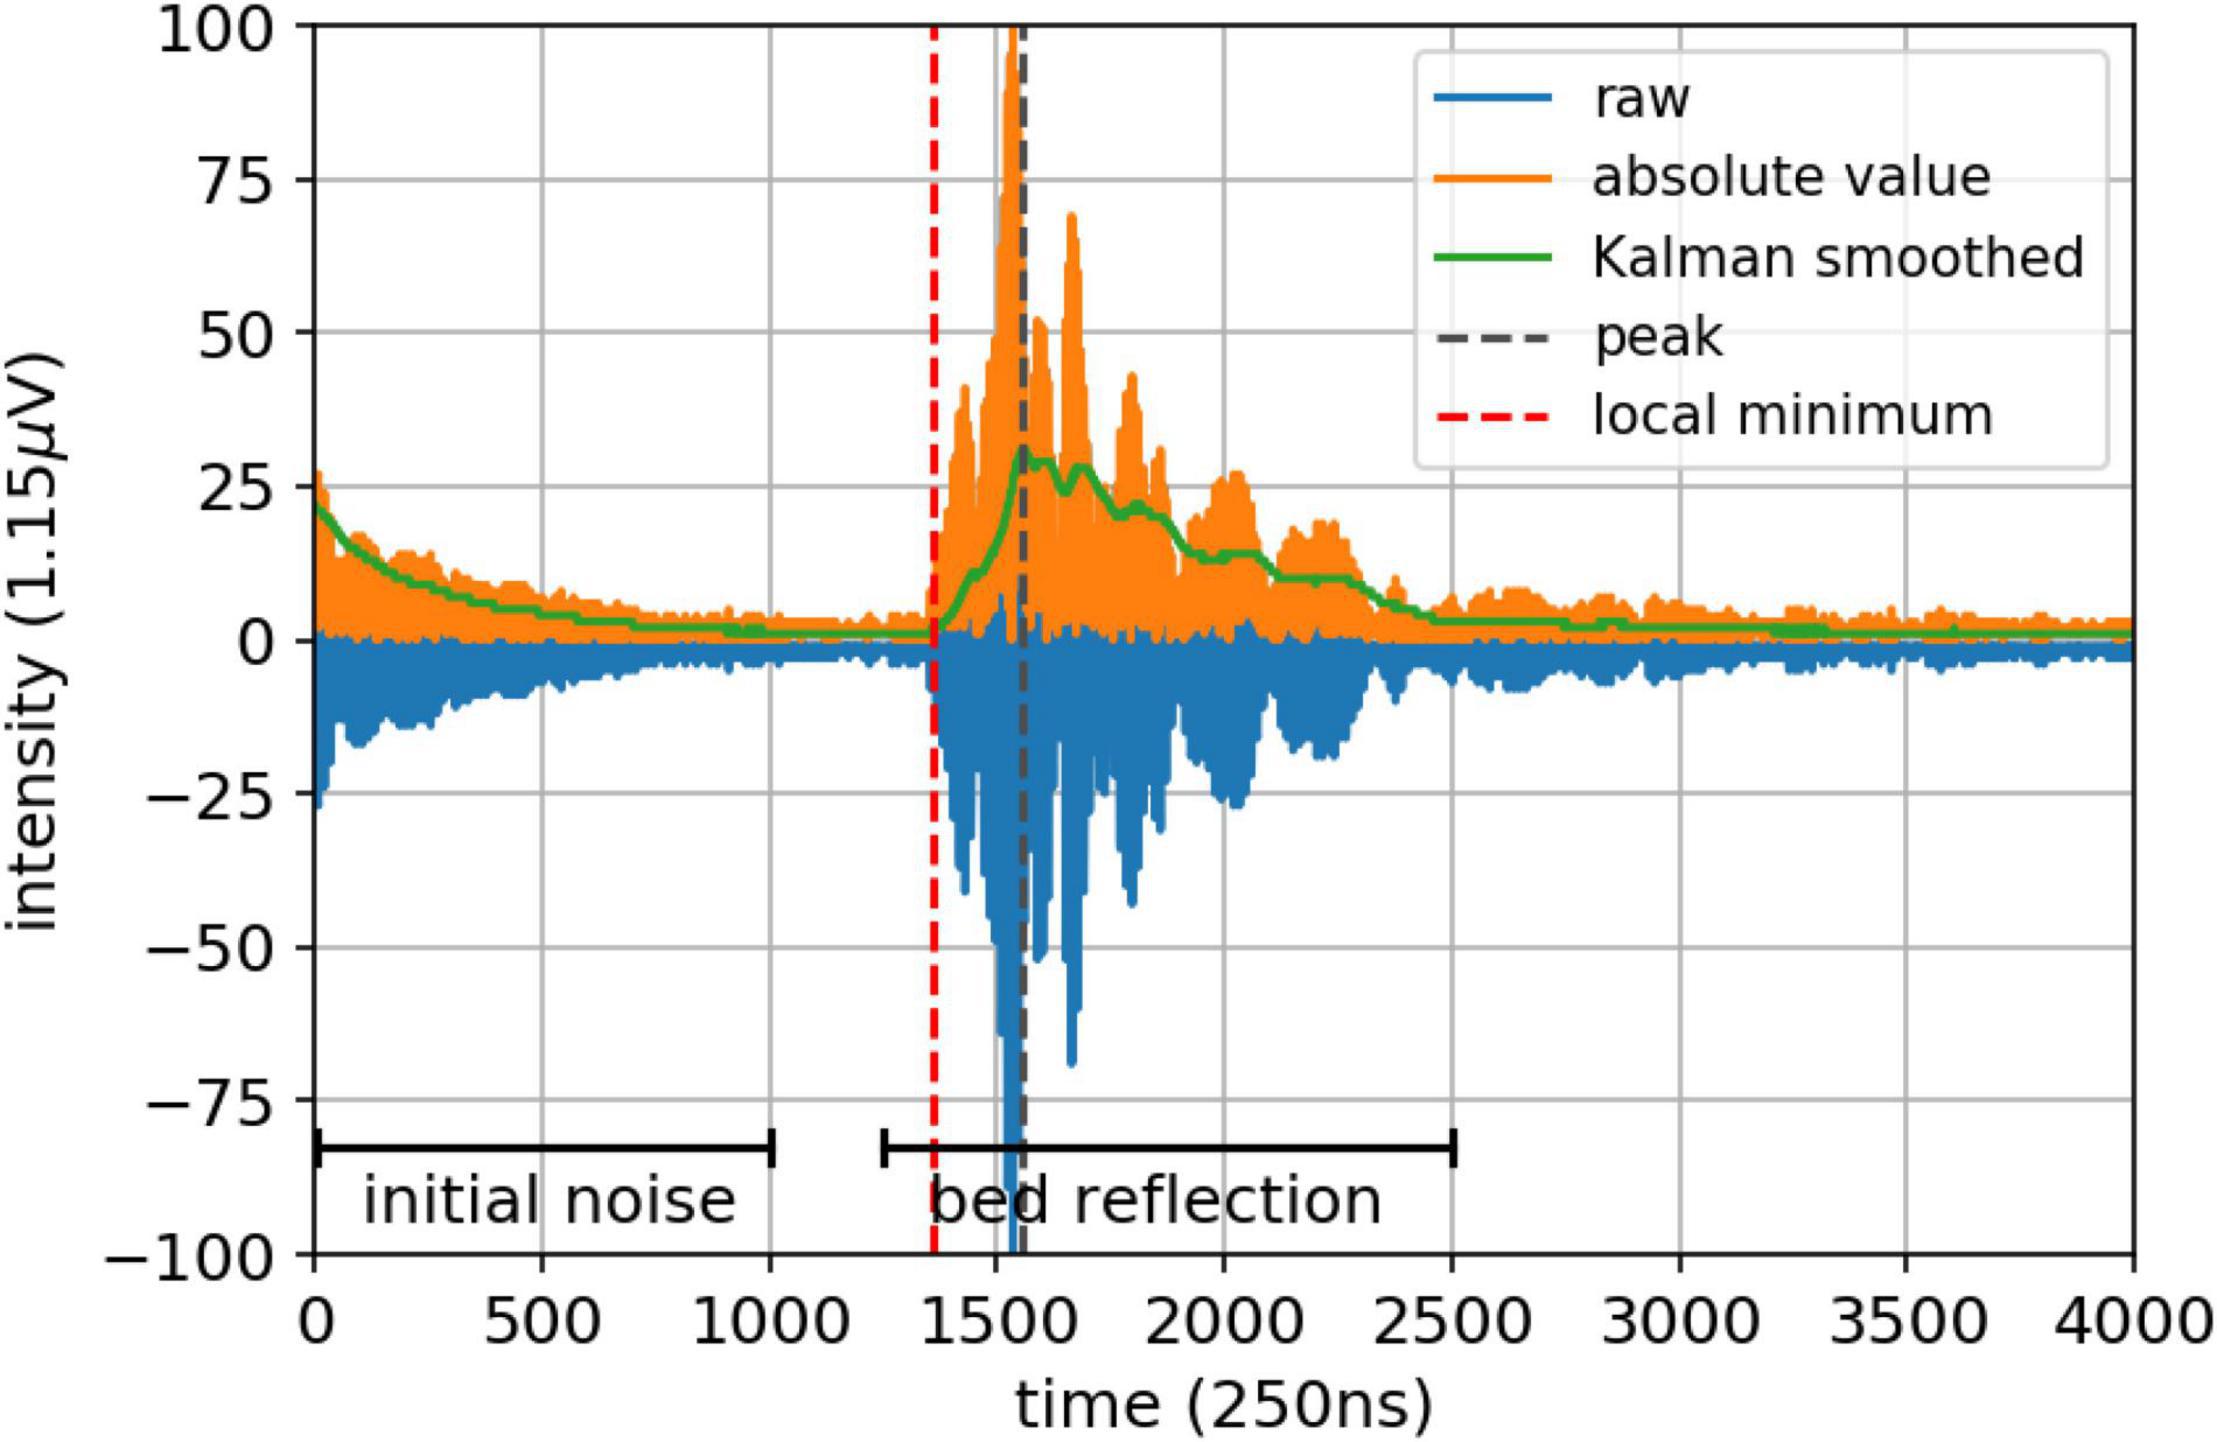
Appendix Figure A2. Post-processing the raw signal to capture the HAB of the A-SED sensor.
The raw data of the instrument is specified as intensity of the return signal. To obtain readable data, i.e., convert binary instrument output to real data values, the raw data are parsed. Subsequently, the readable data are post-processed to obtain the height above the bottom of the instrument. In the post-processing of the received signal, the first reflection of the bed is assumed to identify the distance to the bed, hence the minimum value of the reflected signal in front of the signal’s peak, i.e., the moment were the first reflection of the bed is received by the transducer, determines the time it took the acoustic signal to travel to the bed and back. Post-processing consists of multiple steps (Appendix Figure A2 and Appendix Table TA1):
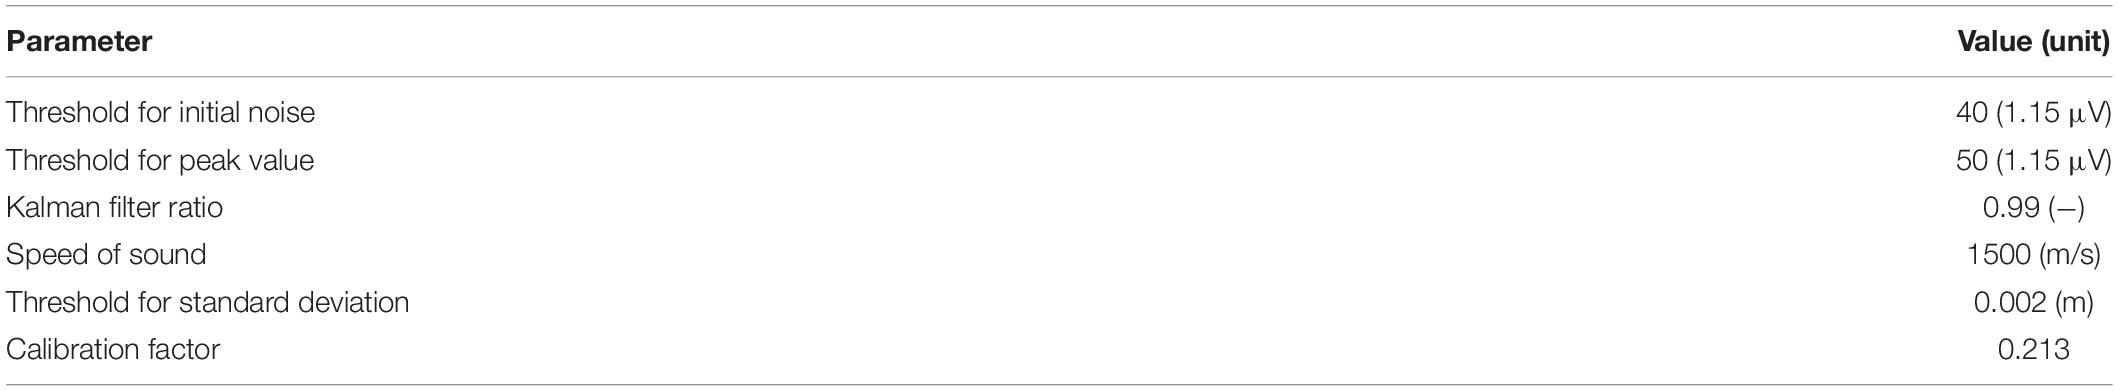 .
.Appendix Table TA1. Parameter values for post-processing raw data.
1. Absolute values of signal are calculated.
2. Check whether thresholds for initial noise in the first part of the return signal (window 1; to be manually specified) are exceeded.
3. Check whether thresholds for the peak value in the second part of the signal, where reflection of the bed can be expected (window 2; to be manually specified) are exceeded.
4. Absolute values of signal are smoothed using a Kalman filter.
5. Find location of peak value in window 1.
6. Find local minimum in the through in front of the peak.
7. Check whether a local minimum is obtained for all unique measurements in a single burst.
8. Calculate the distance to the bed for all unique measurements using a fixed speed of sound through (saline) water.
9. Apply a median filter per burst to calculate a burst averaged distance to the bed.
10. Calculate a standard deviation and remove burst averaged bed levels from data when a threshold is exceeded.
11. Convert the distance to the bed into a bed level with the (known) elevation of the instrument and apply calibration constant.
Parameters for calculating the HAB (Appendix Table TA1), can be adapted when the A-SED is deployed in a different environment. The Python script for parsing and post-processing data is available via doi: 10.4121/16782613.
Keywords: salt marsh dynamics, field monitoring, nature-based solutions, biogeomorphology, bed level dynamics, vegetation presence, thresholds
Citation: Willemsen PWJM, Horstman EM, Bouma TJ, Baptist MJ, van Puijenbroek MEB and Borsje BW (2022) Facilitating Salt Marsh Restoration: The Importance of Event-Based Bed Level Dynamics and Seasonal Trends in Bed Level Change. Front. Mar. Sci. 8:793235. doi: 10.3389/fmars.2021.793235
Received: 11 October 2021; Accepted: 27 December 2021;
Published: 07 February 2022.
Edited by:
Simon Marius Mudd, University of Edinburgh, United KingdomReviewed by:
Ya Ping Wang, Nanjing University, ChinaMark Schuerch, University of Lincoln, United Kingdom
Copyright © 2022 Willemsen, Horstman, Bouma, Baptist, van Puijenbroek and Borsje. This is an open-access article distributed under the terms of the Creative Commons Attribution License (CC BY). The use, distribution or reproduction in other forums is permitted, provided the original author(s) and the copyright owner(s) are credited and that the original publication in this journal is cited, in accordance with accepted academic practice. No use, distribution or reproduction is permitted which does not comply with these terms.
*Correspondence: Pim W. J. M. Willemsen, p.willemsen@utwente.nl