Influence of Natural Processes and Bottom Trawling in the Nepheloid Layer Structure Off Vancouver Island (British Columbia, Canada, NE Pacific)
 Marta Arjona-Camas1,2*
  Pere Puig1
  Fabio C. De Leo3,4
  Grant Garner3,4
  Sarah Paradis5
  Ruth Durán6
  Albert Palanques1
- 1Institute of Marine Sciences (CSIC), Barcelona, Spain
- 2Department of Earth and Ocean Dynamics, University of Barcelona, Barcelona, Spain
- 3Ocean Networks Canada, University of Victoria, Victoria, BC, Canada
- 4Department of Biology, University of Victoria, Victoria, BC, Canada
- 5Geological Institute, ETH Zürich, Zurich, Switzerland
- 6Marine Geology & Seafloor Surveying, Department of Geosciences, University of Malta, Msida, Malta
Continental margins are transitional areas between the land and the deep ocean where large amounts of particulate matter are supplied, transported, and ultimately deposited in the deep sea. High-energy hydrodynamic processes such as storms, ocean currents, or internal waves and tides, as well as bottom trawling activities contribute to the resuspension and remobilization of these particles. These mechanisms favor their transference from the continental shelf to the continental slope and maintain high concentrations of particulate matter in the water column forming nepheloid layers. The temporal evolution of the hydrographic and nepheloid structure in the upper slope off Vancouver Island (British Columbia, Canada, NE Pacific) was assessed by analyzing 4 months (from mid-August to late-November 2018) of sensor data from Ocean Networks Canada (ONC) NEPTUNE cabled seafloor observatory. The distribution of particulate matter during the study period illustrated a well-defined turbidity structure consisting of surface nepheloid layers (SNLs) at <100 m depth associated to primary and secondary productivity, intermediate nepheloid layers (INLs) between 150 and 300 m depth at the shelf-break and upper slope domain, and bottom nepheloid layers (BNLs) developed at >400 m depth. Moderate storm events occurred during fall when the more intense INLs were recorded at shelf-break depths. However, not all the INLs recorded during this period occurred in coincidence with these storms, indicating that these INL detachments were modulated by a different sediment resuspension mechanism. Analyses of fishing vessel activity during the study period revealed that trawlers operated over the same depth range as these INLs. Our results suggest that, in combination with the regional currents, the presence of continuous fishing along the continental slope off Vancouver Island contributes to the advection of suspended sediment particles, playing a major role in their transfer as nepheloid layers.
Introduction
Continental margins are the continuum between the markedly different domains of land masses and deep-ocean basins, and form a transitional area where the oceanic, continental, and atmospheric processes interact (Levin and Sibuet, 2012). Large amounts of organic and inorganic particulate material from both terrestrial and highly productive coastal waters are supplied to continental margins (Blair and Aller, 2012; Milliman and Farnsworth, 2013; Liu et al., 2016; Kwon et al., 2021). However, much of these particles do not accumulate on continental shelf regions, where intense hydrodynamic processes (i.e., storms, ocean currents, internal waves, and tides) contribute to the resuspension and remobilization of ephemerally deposited sediments, favoring their transference to the continental slope and deeper areas of the ocean (Walsh and Nittrouer, 2009). Anthropogenic disturbances, such as bottom trawling (Churchill, 1989; Dellapenna et al., 2006; Mengual et al., 2016) or dredging operations (Smith and Friedrichs, 2011) also contribute substantially to the resuspension of bottom sediments, often interfering with natural sediment transport processes (Martín et al., 2014). Moreover, the presence of topographic structures incising the continental margins such as submarine canyons can promote complex hydrographic and hydrodynamic conditions, and also favor the transport of suspended particulate matter toward deeper areas (Gardner, 1989; Puig et al., 2001, 2014; Canals et al., 2013).
Sediment resuspension by natural and human-induced processes play a major role in the shaping of continental margins and maintain high concentrations of material in the water column in the so-called nepheloid layers (NLs) (i.e., cloudy layers within the water column containing higher concentrations of suspended particulate material (SPM) compared to the surrounding clear waters). These cloudlike layers are recognized as important contributors to the shelf-slope exchanges of sediment, serving as a path and link from shallow productive environments to the abyss (Gardner et al., 2018). In general, three types of nepheloid layers have been described: (1) surface nepheloid layers (SNLs) are generally associated with the biologically active surface mixed layer (e.g., Gardner et al., 1993; Oliveira et al., 2002), (2) bottom nepheloid layers (BNLs) are normally associated with elevated SPM near the seabed and maintained by turbulent mixing in the bottom boundary layer (McCave, 1986), and (3) intermediate nepheloid layers (INLs) are the result of the accumulation of particles and/or detachments of BNLs along isopycnal surfaces in association with strong density gradients in the water column (Cacchione and Drake, 1986; Dickson and McCave, 1986; Puig and Palanques, 1998; Lorenzoni et al., 2009). Nepheloid layers can vary spatially and temporally (they can be permanent or transitory) and their intensity and thickness depend on local conditions (McPhee-Shaw et al., 2004; Inthorn et al., 2006). One of the most effective ways to rapidly observe nepheloid layer characteristics and distribution in the water column is the use of optical techniques (Gardner et al., 2018). Many studies dealing with particulate matter dispersal in the oceans have noted the presence of NLs at continental margins worldwide (Gardner et al., 2018), including upwelling areas off California (Cacchione et al., 1999) and off Namibia (Inthorn et al., 2006), as well as associated with the presence of submarine canyons, for example in the NW Mediterranean (Puig and Palanques, 1998), Portuguese margin (Oliveira et al., 2002; Quaresma et al., 2007), NE Atlantic (Wilson et al., 2015a,b; Hall et al., 2017), and the US margin (Carson et al., 1986; Gardner, 1989).
In the Cascadia Margin (NE Pacific; Figure 1), very little information exists on particulate matter dispersion and sediment dynamics within and around submarine canyons, despite the fact that there are at least 40 canyons incising this margin, between the Juan de Fuca Strait (48 °N) and the northern tip of the Queen Charlotte Islands (54 °N) (Harris et al., 2014a,b). The mechanisms responsible for the off-shelf sediment transport and the role that submarine canyons play at present are still under study due to the complexity of the sedimentary dynamics that characterize this region. Several studies recently conducted in Barkley Canyon using the NEPTUNE cabled seafloor observatory have addressed topics such as the methane release from gas hydrate outcrops (Thomsen et al., 2012), the role of phytoplankton blooms in the export of organic matter (Thomsen et al., 2017), the surface-sediment bioturbation (Robert and Juniper, 2012), the population dynamics of benthic organisms (Juniper et al., 2013; Doya et al., 2014; Matabos et al., 2014), and the deep ontogenetic migrations of zooplankton (De Leo et al., 2018). However, up to date, no specific research using this cabled observatory has addressed the study of contemporary mechanisms that control the suspended sediment dynamics in this submarine canyon environment and its adjacent continental slope. Previous studies in the NE Pacific margin during the 80s in the neighbor Quinault Canyon (off Olympic Peninsula; Figure 1) suggested that most of the off-shelf sediment transport in this margin occurs during storm events (Carson et al., 1986), and that resuspended sediment is advected over the upper slope and canyon forming a shelf-break INL (Carson et al., 1986; Hickey et al., 1986), increasing particle fluxes at intermediate depths in the upper canyon region and near the bottom (Baker and Hickey, 1986). In addition, resuspended fine-grained sediments preferentially accumulate in the canyon head thalweg due to constrained circulation within the canyon (Thorbjarnarson et al., 1986). The same dispersion/accumulation pattern is likely occurring in Barkley Canyon, although no study has yet been conducted to verify it.
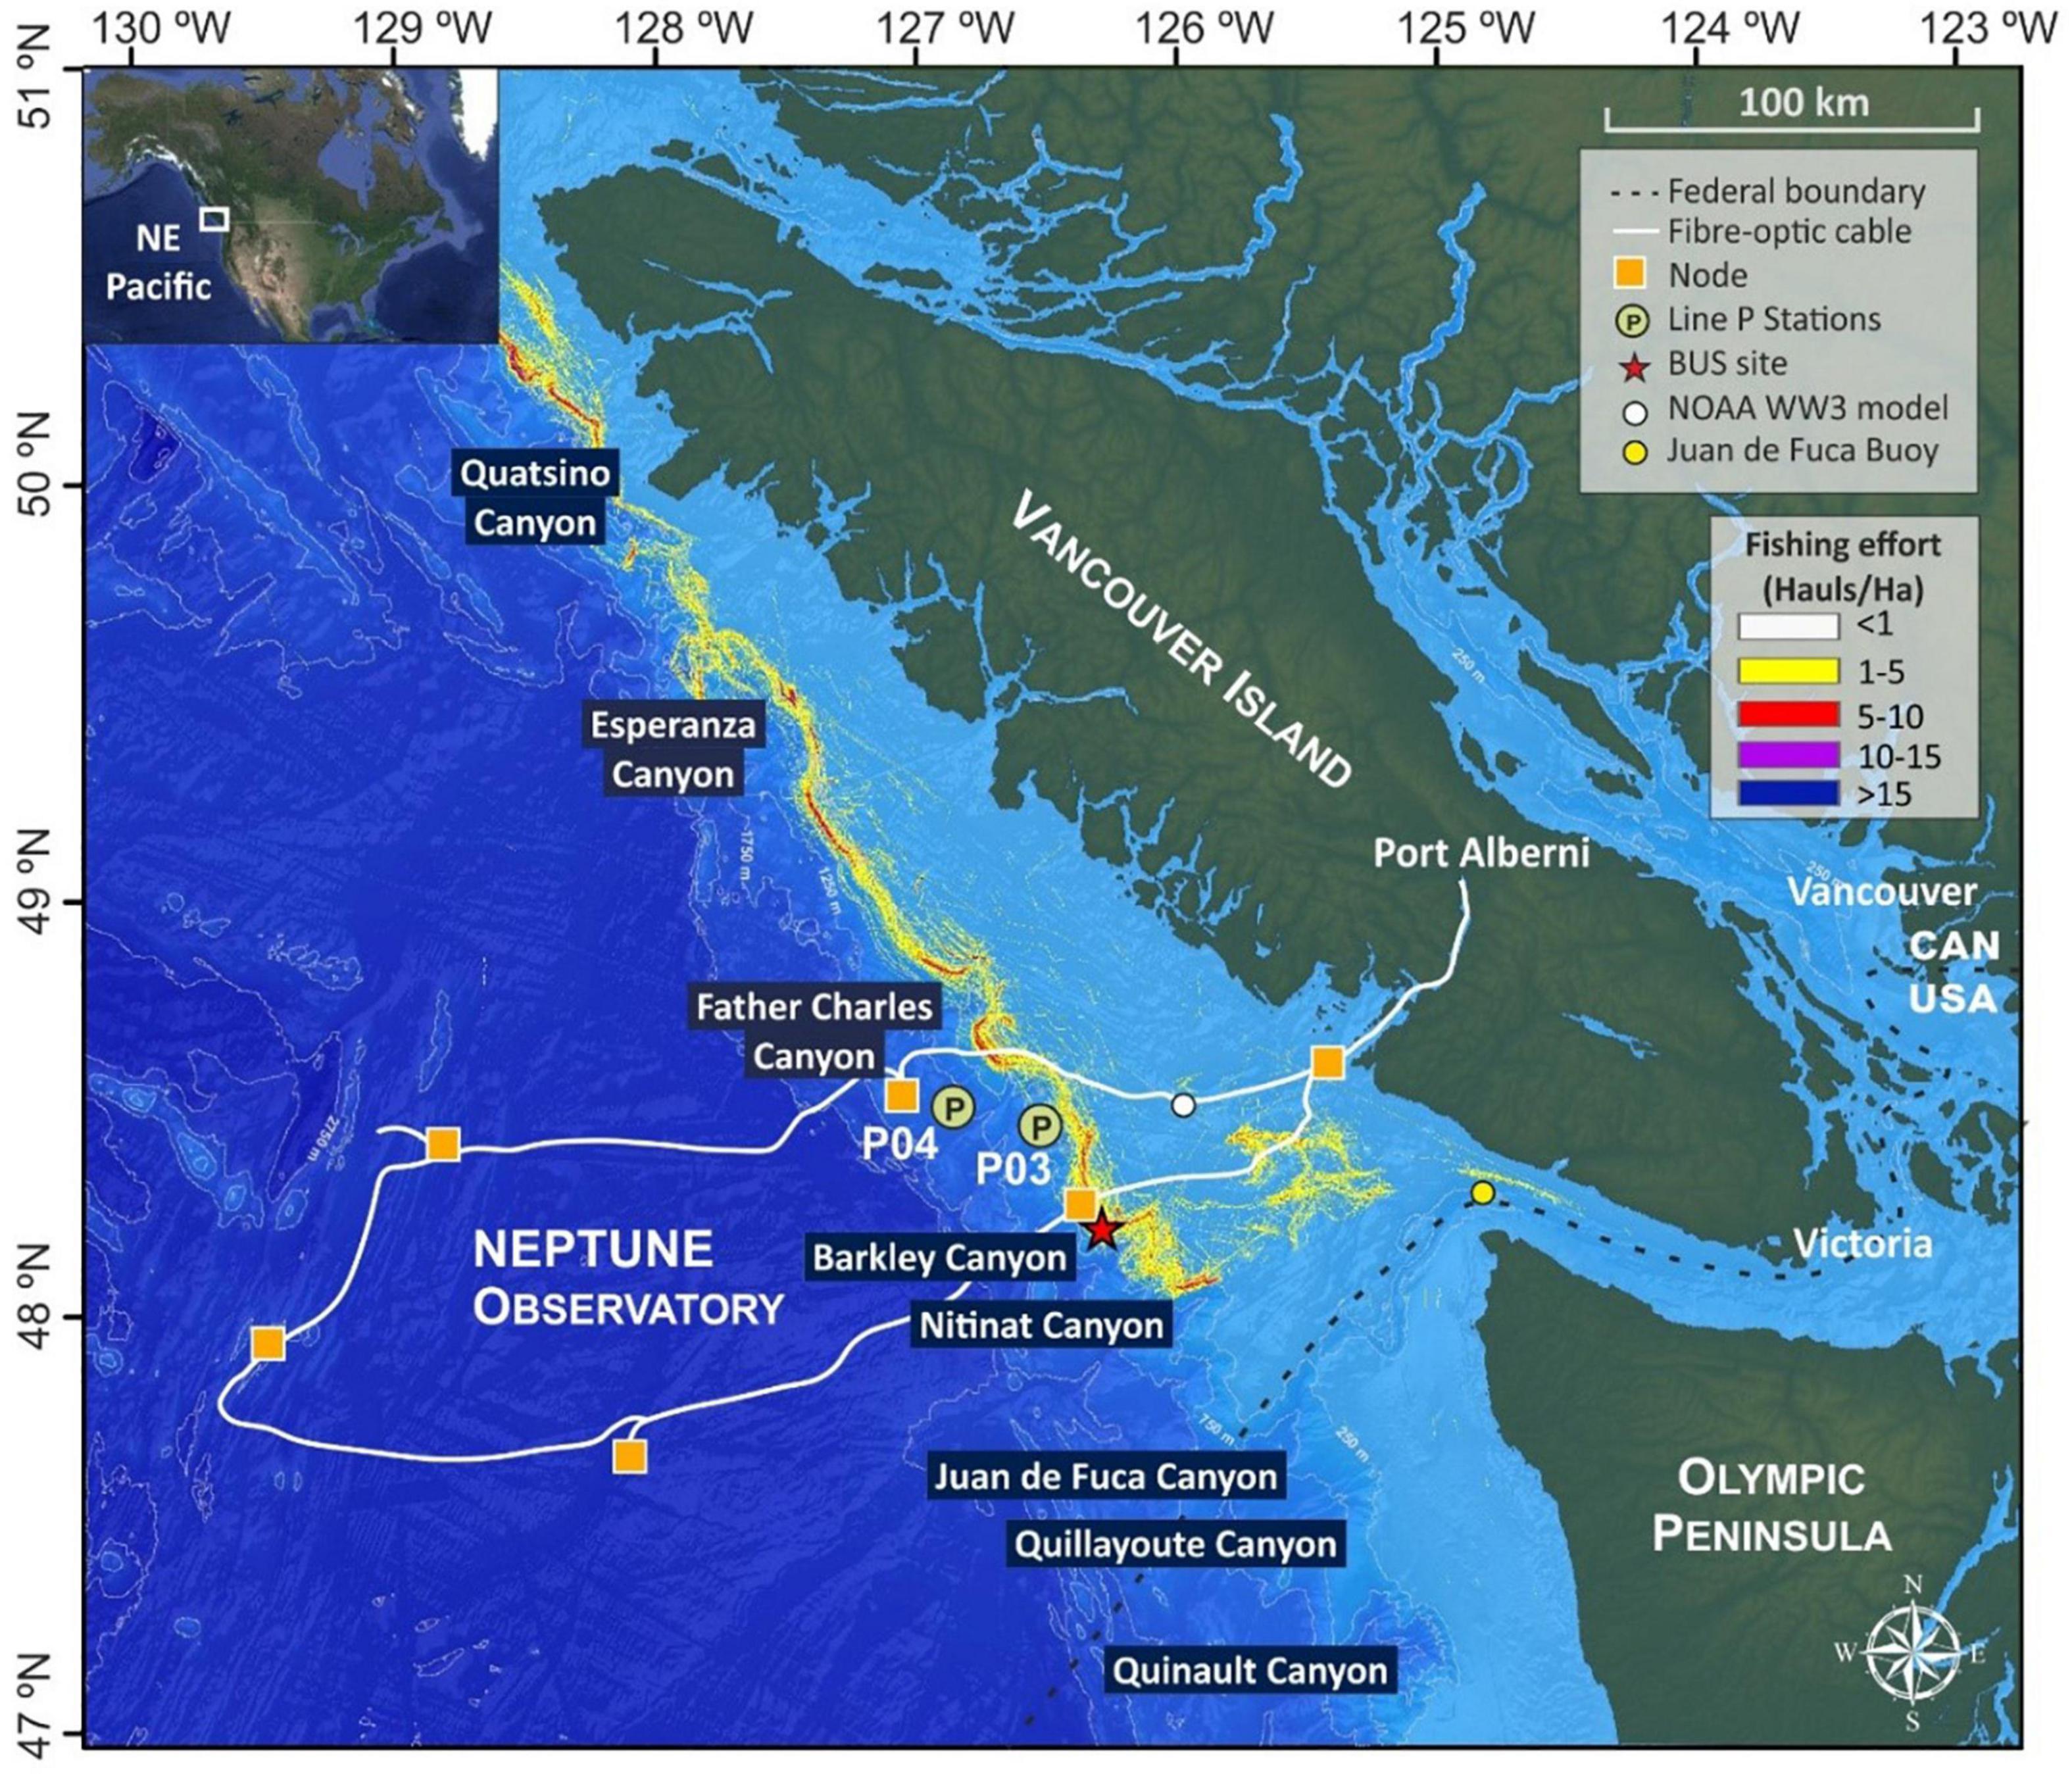
Figure 1. Bathymetric map of the study area highlighting Ocean Networks Canada’s NEPTUNE cabled seafloor observatory (white line) and nodes (orange squares) and the submarine canyons incising the Cascadia margin. The location of the instrumented platform used in this study (BUS site) is illustrated with a red star and the long-term monitoring stations from Line P (P03 and P04) monitoring program are indicated in green circles. The location of the Juan de Fuca Buoy (yellow dot) and the NOAA WW3 model (white dot) are also shown, from which meteorological (wave and wind conditions) data were retrieved. The overlying density raster represents an estimate of the trawling effort on the Canadian territorial slope waters based on the number of hauls per hectare obtained from Automatic Identification System (AIS) data of 2018, which includes the monitoring period from the 14th of August to the 23rd of November (note that the map does not include trawling data from the United States territorial waters). For interpretation of the references in color in this figure legend, the reader is referred to the web version of this article.
Moreover, this margin is exploited by an active bottom trawling fishing fleet since the 1990s (Kulka and Pitcher, 2001; Haigh and Schnute, 2003). Bottom trawling data from Canada’s Department of Fisheries and Oceans (DFO) from 1996 to 2005 have shown that this fishery’s footprint extends over ∼38,000 km2 along Canada’s Pacific coast from 115 to 1,100 m depth (Sinclair, 2007). Therefore, the contemporary sedimentary dynamics on the continental slope could also be affected by this human activity, as it has been observed in other margins (Puig et al., 2012; Martín et al., 2014; Arjona-Camas et al., 2019, 2021).
The aim of the present study is to investigate the hydrographic and nepheloid layer distribution through the water column in the upper slope region of Vancouver Island (British Columbia, Canada, NE Pacific), as well as to assess and discuss the potential resuspension mechanisms -natural and anthropogenic- that contribute to present-day sedimentary dynamics in this region. To do so, ∼4 months of time series of hydrographic vertical profiles (temperature, salinity, pressure, turbidity, fluorescence, and oxygen) combined with low frequency Acoustic Doppler Current Profiler (ADCP) data from Barkley Canyon’s node of Ocean Networks Canada (ONC) NEPTUNE cabled seafloor observatory have been analyzed.
Materials and Methods
Study Area
The study area is located in the NE Pacific at the Cascadia Margin and continental slope off Vancouver Island (Figure 1). The Cascadia continental margin is found along the convergent boundary between the Explorer and Juan de Fuca Plates and the America Plate. Sediment trends from gravelly to boulder sediments inshore to sand and gravel on the mid-shelf and to muddy sands (10–40% mud) on the outer shelf (Bornhold and Yorath, 1984; Bornhold and Barrie, 1991). The shelf-edge varies in depth from 180 and 225 m and is defined by an abrupt change in slope from the nearly horizontal outer shelf (<0.2°) to the steep upper continental slope (7–15°) (Bornhold and Barrie, 1991), and presents a narrow band of well-sorted sands. This discontinuous zone is thought to be a result of high-energy levels due to breaking of internal waves or currents along the upper slope and outer shelf related to tidal and surface swell (up to 40 cm⋅s–1), or winter storms and associated bottom currents (up to 60 cm⋅s–1) (Bornhold and Yorath, 1984; Crawford and Thomson, 1991). Fine-grained terrigenous material from the Columbia River can also be transported by regional surface and bottom currents, bypassing the shelf and depositing on the continental slope (Chase et al., 2002). The continental slope mainly presents glaciomarine (i.e., ice-rafted dropstones and clay components) sediments derived from the ice sheet activity during late Quaternary and early Holocene (Cosma and Hendy, 2008).
Sediments at the continental slope, particularly at the deeper locations in Barkley Canyon (Figure 1) can be also affected by benthic fauna bioturbation. The sablefish (Anoploma fimbria) is an active contributor to surface sediment bioturbation at Barkley Canyon axis and flanks, at 870–890 m water depth (De Leo et al., 2018). Outside the canyon confinement, in upper slope depths, sediment bioturbation is rarely generated by the sablefish, as it occurs in low densities, but conversely, flatfish (e.g., Dover sole, Microstomus pacificus, and Pacific halibut, Hipoglosus stenolepsis) and pink sea urchins (Allocentrotus fragilis) represent the major megafaunal contributors to surface bioturbation (Robert and Juniper, 2012).
The hydrographic structure in this area is composed of several water masses. The Pacific Subarctic Upper Water (PSUW) is generally found in the upper layer (0–500 m depth) of the water column and is characterized by temperatures between 3.0 and 33.6. Below (500–1,500 m depth), intermediate waters include the Pacific Subarctic Intermediate Water (PSIW), with temperatures of 5.0–12.0°C and salinities of 33.8–34.3. The Eastern North Pacific Transition Water (ENPTW) is found between the PSUW and the PSIW and is characterized by temperatures of 11.0–20.0°C and salinities of 33.8–34.3. The Circumpolar Deep Water (CDW) occupies the entire basin below 1,500 m depth and is formed by the mixing of waters from the Indian, Pacific and Atlantic oceans entering the Antarctic region at mid-depths, with Weddell Sea bottom water (Broecker and Takashi, 1985). It is characterized by temperature and salinity values of 0.1–2°C and 34.62–34.73, respectively (Emery and Meincke, 1986).
Oceanographically, this region is influenced by the California Current System, which results from the bifurcation of the eastward flowing Subarctic and North Pacific currents into the northward flowing Alaska Current and the southward flowing California Current (CC), as a result of a divergence in prevailing wind directions (Hickey, 1979; Lynn and Simpson, 1987; Checkley and Barth, 2009). The CC reaches depths of approximately 500 m and can be intensified at the surface by wind-stress (Checkley and Barth, 2009). Winter conditions at the CC start with a gradual completion of summer conditions after the contraction of the North Pacific high-pressure system, while the Aleutian low-pressure system intensifies (Wooster and Hollowed, 1995). Downwelling-favorable winds result in wind-driven mixing that forces oxygen rich surface waters toward the ocean interior at shelf-break depths (Whitney et al., 2007; Cannolly and Hickey, 2014). During the spring transition, the CC is forced by southward winds that generate southward transport along the coast (Hollowed, 1992). The CC is strongest during summer, when the relaxation of Aleutian low-pressure system occurs and the North Pacific high-pressure system intensifies, causing upwelling-favorable winds and southeastward flow (Lluch-Belda et al., 2001, 2003). The upwelling favorable wind stress peaks during summer, although downwelling and relaxation events still occur during this season (Hickey, 1979; Hickey and Banas, 2008; Saldívar-Lucio et al., 2016). Subsurface pressure gradients cause the California Undercurrent (CUC) to flow northward along this margin during the late summer to early fall, despite that the source mechanism is not completely understood. The CUC develops below the shelf-break depth over the slope (125–325 m depth, with core speeds between 200 and 275 m depth; Pierce et al., 2000), also reaching its maximum strength in late summer (Hickey, 1979). During summer months, low oxygen and nutrient-enriched waters are upwelled onto the shelf, leading to sustained productivity along the west coast of Vancouver Island (up to 425 g C m–2 yr–1; Antoine et al., 1996).
Waves and tides are of great significance for the transport of sediments, particularly on the shelf. Long-period swell waves from the southwest, west, or northwest accounts for most of the wave energy on the shelf in this region (Bornhold and Yorath, 1984). Waves with swell periods up to 20 s exceed significant wave heights of 4 m between 20 and 40% of the time during winter, and between 5 and 15% during summer (Bornhold and Yorath, 1984). The tide floods along the shelf with near-bottom velocities on the shelf and open slope rarely exceed 50 cm s–1, whereas in coastal constricted passages, tidal currents are intense and can exceed velocities of 150 cm s–1 (Barber, 1957; Bornhold and Yorath, 1984). The flood tides, reinforced by southeasterly storms, appears to be a dominant sediment transport process in the region (Crawford and Thomson, 1991; Barrie et al., 2009).
In addition to the natural oceanographic and sedimentary processes described above, long-term and widespread bottom trawling activity affecting the study area may contribute as an anthropogenic control process. Off Vancouver Island, deep-sea bottom trawling began in the 1990s in response to growing market demand for two groundfish species: the short spine thornyhead (Sebastolobus alascanus) and the long spine thornyhead (Sebastolobus altivelis). The depth distribution of the long spine thornyhead ranges from 500 to 1,600 m, while the short spine thornyhead occurs over a broader depth range, from 90 to 1,460 m (Haigh and Schnute, 2003; De Leo et al., 2017). Other commercial species targeted by the bottom trawl fleet include shrimp and prawn (Department of Fisheries and Oceans Canada [DFO], 2019). According to recent data, commercial fish landings for mixed groundfish in British Columbia have reached 138,723 metric tons (Department of Fisheries and Oceans Canada [DFO], 2019). Bottom trawling represents an important fishery in British Columbia despite public concerns and scientific evidence from other locations about the potential physical disturbance of seafloor habitats and associated benthic communities (Ardron et al., 2007; Finney, 2009; De Leo et al., 2017), as well as its high by-catch rates (Haigh and Schnute, 2003). The disturbance of bottom trawling on the seafloor on the continental slope off Vancouver Island is confirmed by continuous video and sonar records from ROV surveys, with maximum occurrence between 500 and 1,100 m depth (De Leo et al., 2017).
The NEPTUNE Observatory
The North East Pacific Time-series Undersea Networked Experiments (NEPTUNE) observatory,1 operated and maintained by ONC,2 is located off the west coast of Vancouver Island in the NE Pacific (Figure 1). The NEPTUNE infrastructure is an 840 km optic cable with five active nodes, and ranges from 23 to 2,660 m depth providing high-resolution, multiparameter platforms for the multidisciplinary study of deep-sea ecosystems of the NE Pacific, including hydrothermal vents, methane seeps, and submarine canyons (Barnes et al., 2011). The cable runs from Vancouver Island across the continental shelf into the deep Cascadia Basin, along the Endeavour segment of the Juan de Fuca ridge and back, forming a loop. The NEPTUNE shore station at Port Alberni on Vancouver Island provides power and communication to the five nodes and sends the collected data from the NEPTUNE observatory via fiber-optic cable to the University of Victoria Data Management and Archive Station (Figure 1).
Data Collection
The Barkley Canyon node provides power and connects several instrument platforms (pods) through a series of branching fiber-optic cables (Figure 2). For the purpose of this study, data time-series were acquired from instruments on the Barkley Upper Slope (BUS) Instrument platform (latitude: 48° 25.6457′ N, longitude: 126° 10.4799′ W, depth: 390 m), spanning from the 14th of August to the 23rd of November 2018.
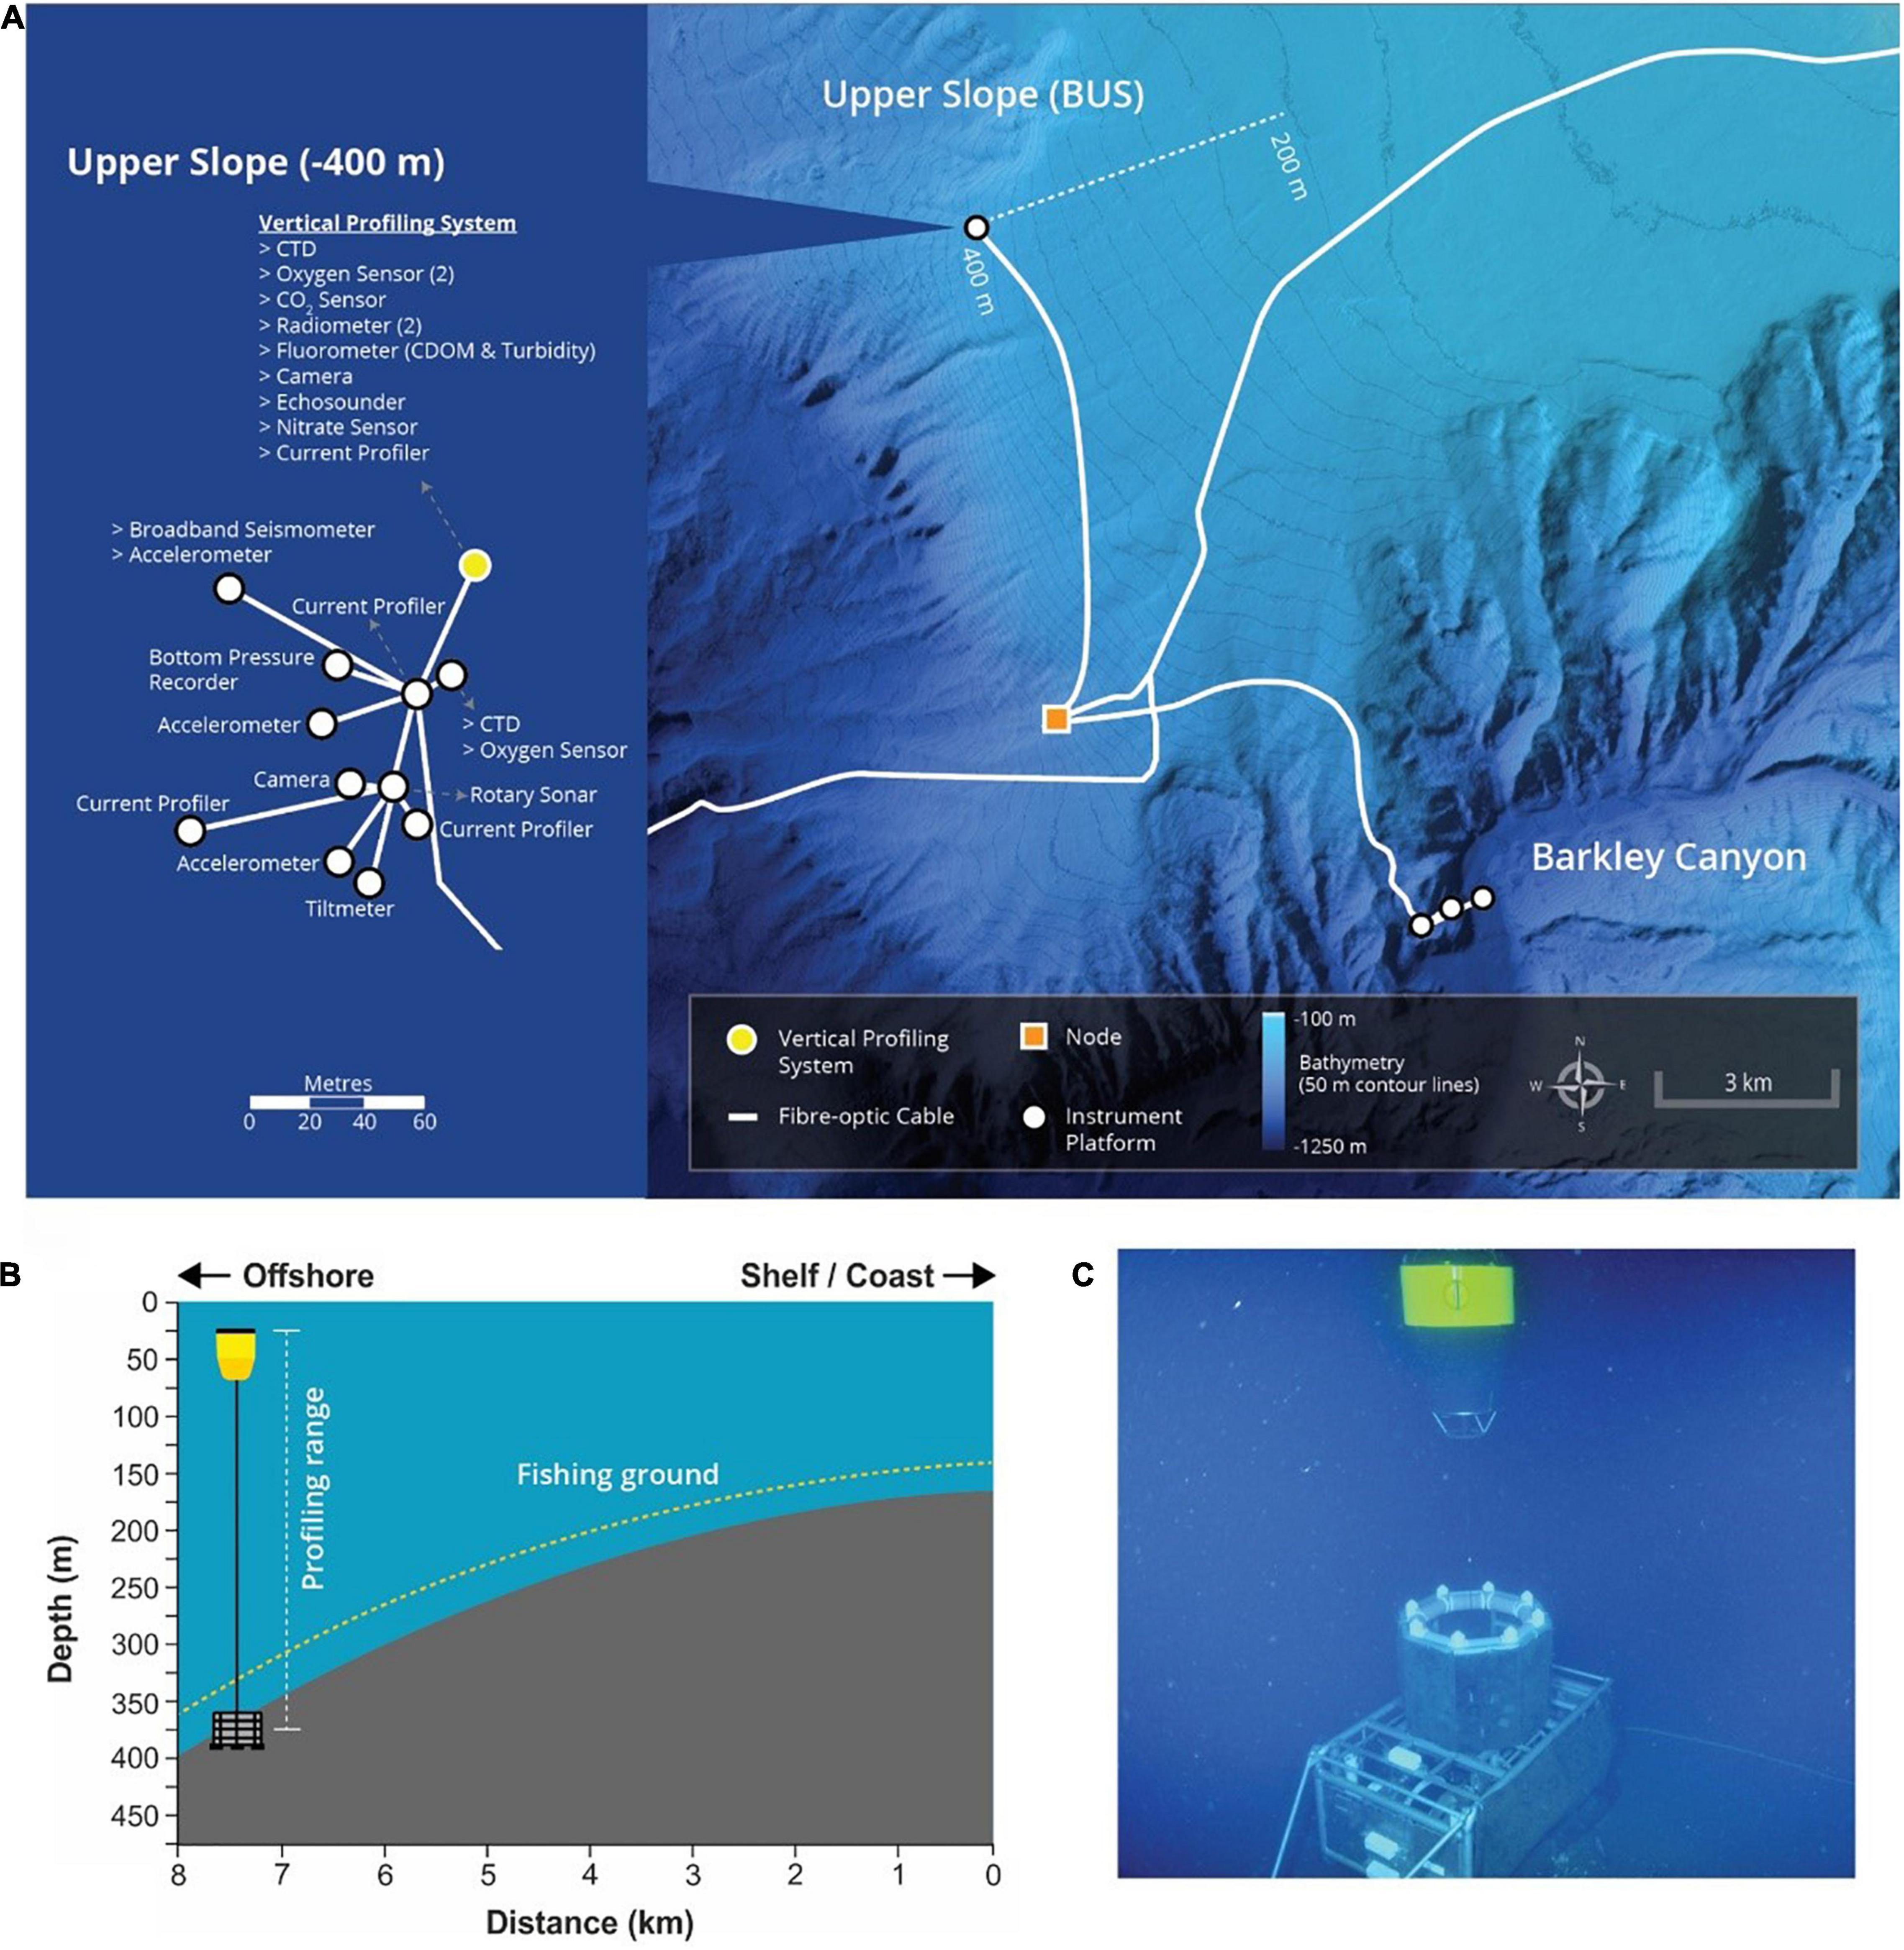
Figure 2. (A) Detailed bathymetric map of the Barkley Canyon and its upper slope, and the instrument platforms/pods (white dots) that are connected to the Barkley Canyon node (orange square) as part of the Ocean Networks Canada’s NEPTUNE cabled seafloor observatory. A detailed description of the different sensors and instruments installed in the Vertical Profiling System (VPS) is also provided in this figure. (B) Bathymetric cross-section of the white dotted line in panel (A), and the location of the VPS at the upper slope region off Vancouver Island. (C) Underwater photography of the VPS and its cage. For interpretation of the references to color in this figure legend, the reader is referred to the web version of this article.
Data from all the instruments are archived and publicly available online in near-real time via ONC’s Oceans 2.0 Data Management System.3
Environmental Characterization
A Vertical Profiling System (VPS), connected to the BUS Instrument Platform (Figures 1, 2), obtained the hydrographic data during the study period. The VPS is fixed to the seafloor at 390 m depth with a bottom-mounted winch that controls a buoyant platform to which oceanographic instruments are mounted. The VPS starts profiling at 375 m depth, although is docked at 390 m depth because the first 19 m are reserved for a “docking procedure” that ensures the entire package of floats and instruments to return to its cage on the bottom safely. During this docking procedure, the VPS does not acquire data and automatically slows its speed down to 1/10 of the normal speed, and fully stops on its cage after a few minutes. During the study period, the profiler performed ∼ 4 profiles per day from 374 m depth to almost the surface (25 m depth), giving a temporal evolution of water masses, their dynamics and characteristics. The VPS is equipped with a SeaBird SeaCAT SBE 19 plus v2 CTD probe to measure temperature, salinity, pressure and density at 0.25 s intervals. The profiler is also equipped with a WET Labs ECO FLNTU sensor, programmed to measure fluorescence (μg L–1) and backscatter turbidity (expressed in Nephelometric Turbidity Units, NTU) at 1 s interval. Additionally, dissolved oxygen data was recorded by an Aandera Oxygen Optode 3830 sensor that sampled at 3 s intervals (Table 1).
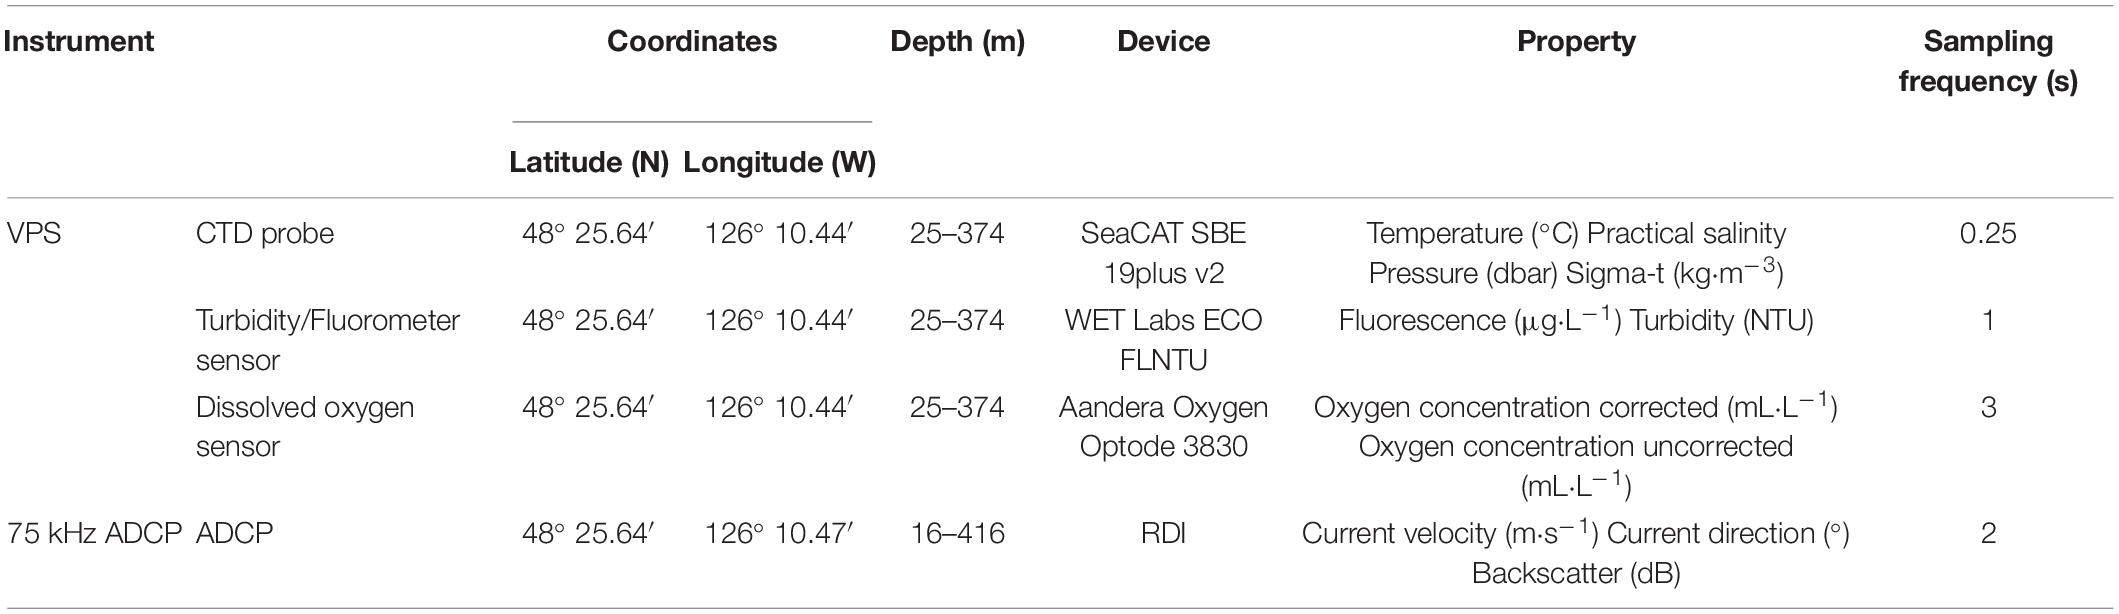
Table 1. Summary of all instruments used from the Barkley Upper Slope (BUS) Instrument platform, including the Vertical Profiling System (VPS) and the low-frequency 75 kHz Acoustic Doppler Current Profiler (ADCP) used in this study, spanning from the 14th of August to the 23rd of November 2018.
In addition, an upward-looking 75 kHz RDI Workhorse Long Ranger Acoustic Doppler Current Profiler (ADCP), connected to the BUS Instrument platform, was used to measure current velocity and direction. The ADCP is configured with vertically stacked measurement cells of 8 m in thickness, with the center of the first valid cell at 16 m above the bottom (Figure 2). These settings allowed current velocity and direction estimates up to about 400 m above the bottom (Table 1).
CTD, Turbidity, and Current Data Analyses
Data collected with the VPS were first pre-processed to remove outliers. In an attempt to standardize all the data pre- and post-processing steps for all data strings from all different instruments and sensors, a MATLAB script was developed to automatically identify and remove negative values marked as “bad quality data,” flagged by ONC’s data quality and assurance (QA/QC) process. Afterward, MATLAB’s function SpikeRemoval (Solomon et al., 2001) was run over the entire dataset to delete undesired transients and spikes exceeding a threshold value. The threshold is defined as mean ± a number of standard deviations (std) of windowed data centered at spike locations. In our case, the most suitable threshold was defined as 1 std and 3 passes for spike detection and replacement. Finally, data was interpolated to 1 m bins of vertical resolution, obtaining a matrix for the whole sampling period composed of 765 up- and down-casts.
Moreover, the data pre-processing for the low-frequency 75 kHz ADCP included the down-sampling of the raw data to a 1-min average ensemble. The data was filtered using a correlation threshold of 64 counts and an error velocity screening applied to a threshold of 2 m⋅s–1. Within each vertical bin, only pings that were within these thresholds were used in the ensemble averaging. Additionally, post-processing of the data included the rotation of the currents dataset to estimate across- and along-slope current components with respect to geographic coordinates. The applied angle of rotation was 30°, which corresponded to the main orientation of the isobaths at the sampling site.
Ancillary Hydrographic Data
Complementary to hydrographic data from the VPS, CTD and turbidity profiles from the long-term Line P monitoring program (Boyd et al., 1999)4 were analyzed. In this study, stations P03 and P04 were considered, which are both located over the upper continental slope at 25–40 km to the northwest from the BUS Instrument platform (Figure 1). Data from these stations were obtained during the summer (5th to 19th of June) and fall (11th to 28th of September 2018) cruises, which took place during the monitoring period. At each station, a SeaBird 9 plus CTD was mounted in a rosette attached with a WET Labs CSTAR transmissometer, a SBE 43 DO sensor, a SeaPoint Fluorometer, a Biospherical QSP-400 PAR sensor and an altimeter. During the summer cruise, CTD casts were hauled from the surface down to 784 and 1,307 m at station P03 and P04, respectively, whereas during the fall cruise they were hauled down to 798 and 1,300 m, respectively.
Sea Surface Meteorological Data
The Strait of Juan de Fuca Traffic Separation Lighted Buoy (hereafter referred to as “Juan de Fuca Buoy”) (station 46087; latitude: 48° 29, 58′ N and longitude: 124° 43.58′ W), which is owned and maintained by the U.S. National Data Buoy Center,5 provided the wave and wind data during the study period. This buoy is located 123.2 km E from the BUS Instrument platform, over the 260 m isobath, and was the closest operative meteorological buoy to the study site during the monitoring period (Figure 1). Significant wave height (Hs, m), primary mean wave period (Tp, s), and mean wave direction (θ, °), as well as wind speed (m s–1) and direction (°) were recorded every 30 min.
Buoy measurements were compared and crosschecked against model data from the NOAA WAVEWATCH III model (hereafter referred to as “NOAA WW3”). NOAA WW3 has a global coverage and temporal resolution of 0.5° and 3 h, respectively, and the data are available from https://polar.ncep.noaa.gov/waves. This model is forced with wind data from the Global Forecast System (GFS) that have a resolution of 0.5 degrees at 1-h intervals. In this study, data from the model was selected for the U.S. West Coast region from 25° to 55° North and from 110° and 140° West, with a spatial resolution of 10 min in both x and y directions (Figure 1). For the purpose of this study, data were only plotted for a particular grid point (latitude: 48° 45′ N and longitude: 125° 42′ W) at the outer shelf, inshore of the BUS Instrument platform, which is a representative location to assess the potential for wave resuspension at the study site. Model results included wave (Hs, Tp, and θ) and wind (U and V components of the wind) parameters stored every 3 h.
Regression coefficients between the NOAA WW3 model grid point output and the data from the Juan de Fuca Buoy were calculated for the entire period of measurements. The buoy data was extracted at the same time intervals as the NOAA WW3 model data.
Bottom Trawling Effort Derived From Automatic Identification System Data
Trawling activity along Vancouver Island’s slope region was derived from vessel Automatic Identification System (AIS) obtained from the SiiTech web platform,6 which allows for real time and historical tracking of vessels with AIS positional data. Vessels equipped with AIS transceivers transmit their position omni-directionally in near-real time to nearby AIS-bearing ships, as well as to coastal stations and satellites. This data is transmitted at high frequency, varying from 2 s to 3 min, enabling the monitoring of fine-scale vessel behaviors and movement patterns (Natale et al., 2015). Access to archived AIS data was possible through a data sharing agreement between ONC and the Canadian Coast Guard, which allows distribution and publication for research purposes of only vessel positional data without disclosure of vessel identity (e.g., contained as MMSI strings).
The spatial fishing effort was estimated using AIS data from August to November 2018, and consisted in static data (vessel identifier, dimensions, ship type) and dynamic data (vessel position, speed over ground, course over ground), as well as voyage information (destination, draught, and current activity status). Since the total volume of the AIS dataset exceeded our computational capacity, a filter was applied to select and keep only “fishing” class vessels with the Canadian flag. The AIS dataset was further reduced by excluding signals received within a 5-km buffer zone surrounding the Vancouver Island coastline to account for vessels slowing while entering the harbor, or those anchored inshore. A final classification of AIS signals was carried out for vessels that held commercial “trawling” licenses by conducting a cross-check of the AIS dataset with data extracted from the Fisheries and Oceans Canada Department (Department of Fisheries and Oceans Canada [DFO], 2019), extracting vessels that held pelagic trawling licenses, vessels that held demersal trawling licenses, and vessels that held “mixed” trawling licenses (i.e., the same vessel holds both types of licenses).
AIS data were then filtered according to speed to infer whether an AIS message corresponded to fishing activity, following similar criteria used in previous studies (e.g., Natale et al., 2015; Oberle et al., 2016; Arjona-Camas et al., 2021; Paradis et al., 2021). Speed over ground (SOG) histograms were created for all vessels, from which a multi-modal distribution was obtained that portrayed travel speeds (high speeds), trawling speeds (mid-speeds) and an unknown third distribution that was hypothesized to be related to fishing gear retrieval or non-power drifting (low speeds) (Supplementary Figure 1). The Expectation-Maximization (EM) algorithm (Hartley, 1958; Dempster et al., 1977) was used to obtain the statistically upper and lower limits of the mid-speed fishing speed distribution, at 2 standard deviations from the mean, obtaining trawling speed of 1.5–4.0 knots. However, simply filtering according to this trawling speed range may lead to false-positives, when a trawler is navigating or drifting at the specified trawling speeds, and false-negatives, when a trawler is hauling at anomalous speeds due to piloting reasons (i.e., gear adjustments). Such interruptions were solved by considering a minimum length of 20 min per haul to correct for false-positives, whereas a maximum length of 5 min of anomalous trawling speeds between hauls was considered to correct for false-negatives. Hauls per vessel were finally identified as consecutive entries that met the trawling criteria for at least 100 min. Bottom trawling effort was obtained from the number of fishing hauls that overlapped within a given area. Although metrics used to calculate door’s spread were not available during the present study, a grid of one hectare (100 × 100 m) was used to calculate bottom trawling intensity, which accounts for the maximum ∼100 m spread of the trawler’s doors reported in other continental margins (e.g., NW Mediterranean, Palanques et al., 2006). Trawling effort was finally represented and plotted using ArcGIS©10.4 software (Figure 1).
Results
Temporal Meteorological Variability
The predicted wind and wave parameters show that the NOAA WW3 follows the buoy measurements quite accurately indicating an overall good agreement with the Strait of Juan de Fuca Buoy dataset (Supplementary Figure 2). Therefore, for the purpose of this study, wind and wave time-series from the NOAA WW3 model are used, which is also closer to the BUS Instrument Platform, to describe the temporal meteorological variability within the study area (Figure 1).
Sea-surface time-series, as well as wind and wave conditions (Figure 3) provided the climatological context and allowed us to characterize both “late-summer” (August and September) and “fall” (October and November) months. During late-summer months, sea surface atmospheric pressures were high (≥1,013 hPa) with warm sea surface temperatures (SST) >10°C, often reaching ∼15°C (Figure 3A). During fall months, sea surface atmospheric pressure fluctuated between high and low pressures, with lower SST (10–12°C) than during late-summer months (Figure 3A).
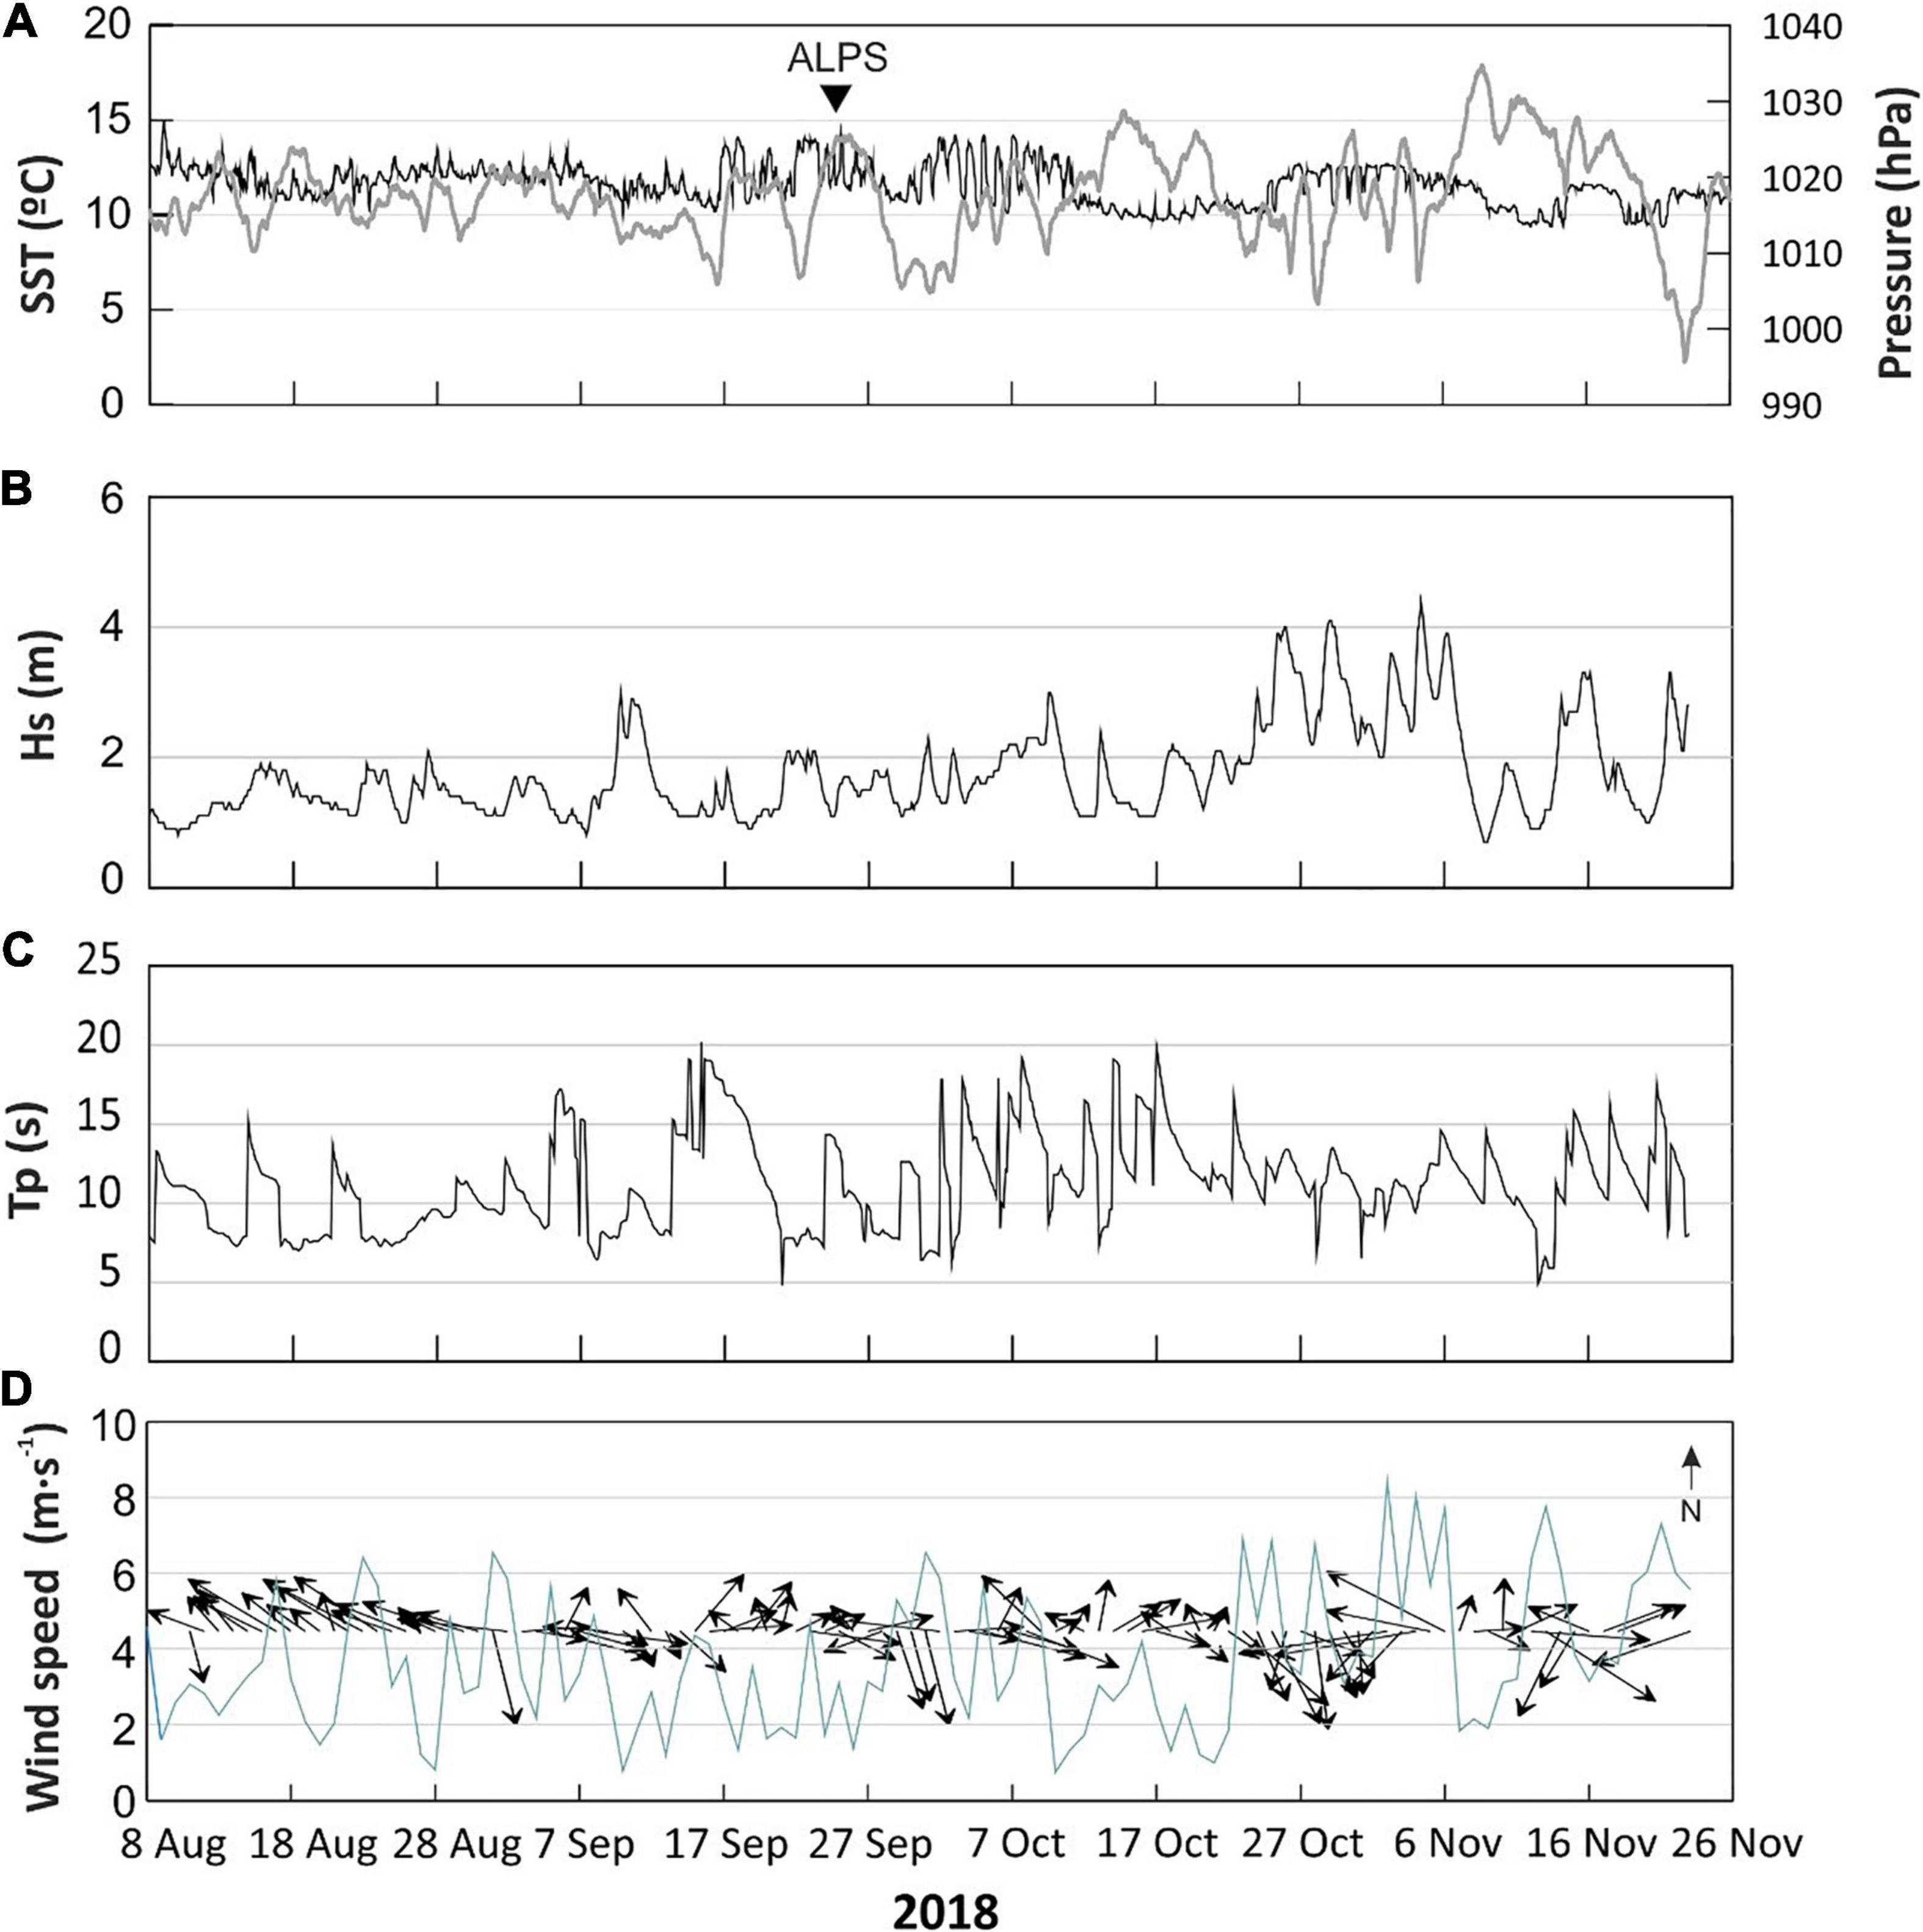
Figure 3. Time series of meteorological (wave and wind) conditions measured by the NOAA WW3 model during the study period, spanning from the 14th of August to the 23rd of November 2018. Atmospheric conditions are based on (A) sea surface temperature (SST, °C) (black line) and sea level atmospheric pressure (hPa) (gray line). The presence of the Aleutian low-pressure system (ALPS), which intensified during fall months over the region, is indicated with a black triangle. Wave conditions are (B) significant wave height (Hs, m), and (C) primary wave period (Tp, s). Wind parameters are (D) speed and direction. Wind speed is represented by a light blue line, whereas wind direction is represented by the black arrows. For interpretation of the references to color in this figure legend, the reader is referred to the web version of this article.
Significant wave heights (Hs) ranged between 0.8 and 2.6 m during the more quiescent late-summer months, and between 2.1 and 4.5 m during the fall months (Figure 3B). From late October to early November several storms were recorded, with Hs of 3–4.4 m and wave periods (Tp) of 10.5–13.4 s (Figures 3B,C). Wave direction (θ) was variable during both late-summer and fall months, although the change in direction was more pronounced in fall months due to the passage of storms (not shown). These events were generally caused by southern/southeastern winds and rapid fluctuations in atmospheric pressure. Wind speeds were relatively weak and showed almost constant values (<4 m⋅s–1) in August and beginning of September, and then they started to increase reaching up to 7.8 m⋅s–1 (Figure 3D). Wind direction varied from NW-SE during this period (Figure 3D). During the fall months, wind speeds were normally higher than 3.5 m⋅s–1, eventually reaching 9 m⋅s–1 (Figure 3D).
Trawling Activity
Trawling effort estimated from AIS data from August to November 2018 indicates that fishing vessels followed the bathymetric contours, and most of the trawling activity along the west coast of Vancouver Island took place between 250 and 800 m depth (Figure 1). Based on the spatial distribution of fishing hauls determined from the AIS data, it is possible to identify fishing hotspots around Quatsino, Father Charles, and Barkley submarine canyons (Figure 1), where the predominating trawling frequency between August and November was 5–15 hauls per hectare, higher than the average trawling effort (1–5 hauls per hectare) observed along the entire coast of Vancouver Island (Figure 1).
The position of fishing vessels operating near the study area was also plotted in detail, in 10 consecutive periods (Figure 4). Table 2 summarizes the main characteristics of each period in terms of number of hauls and trawlers. Time-series observations on AIS data revealed no trawling activity around the study site during mid-August and early September (Figures 4a–c and Table 2). The remaining periods were characterized by the presence of hauls corresponding to demersal and pelagic trawl vessels. During September, fishing hauls were mostly observed between 200 and 600 m depth at Barkley Canyon’s head and were carried out by demersal trawl vessels (Figures 4c,d).
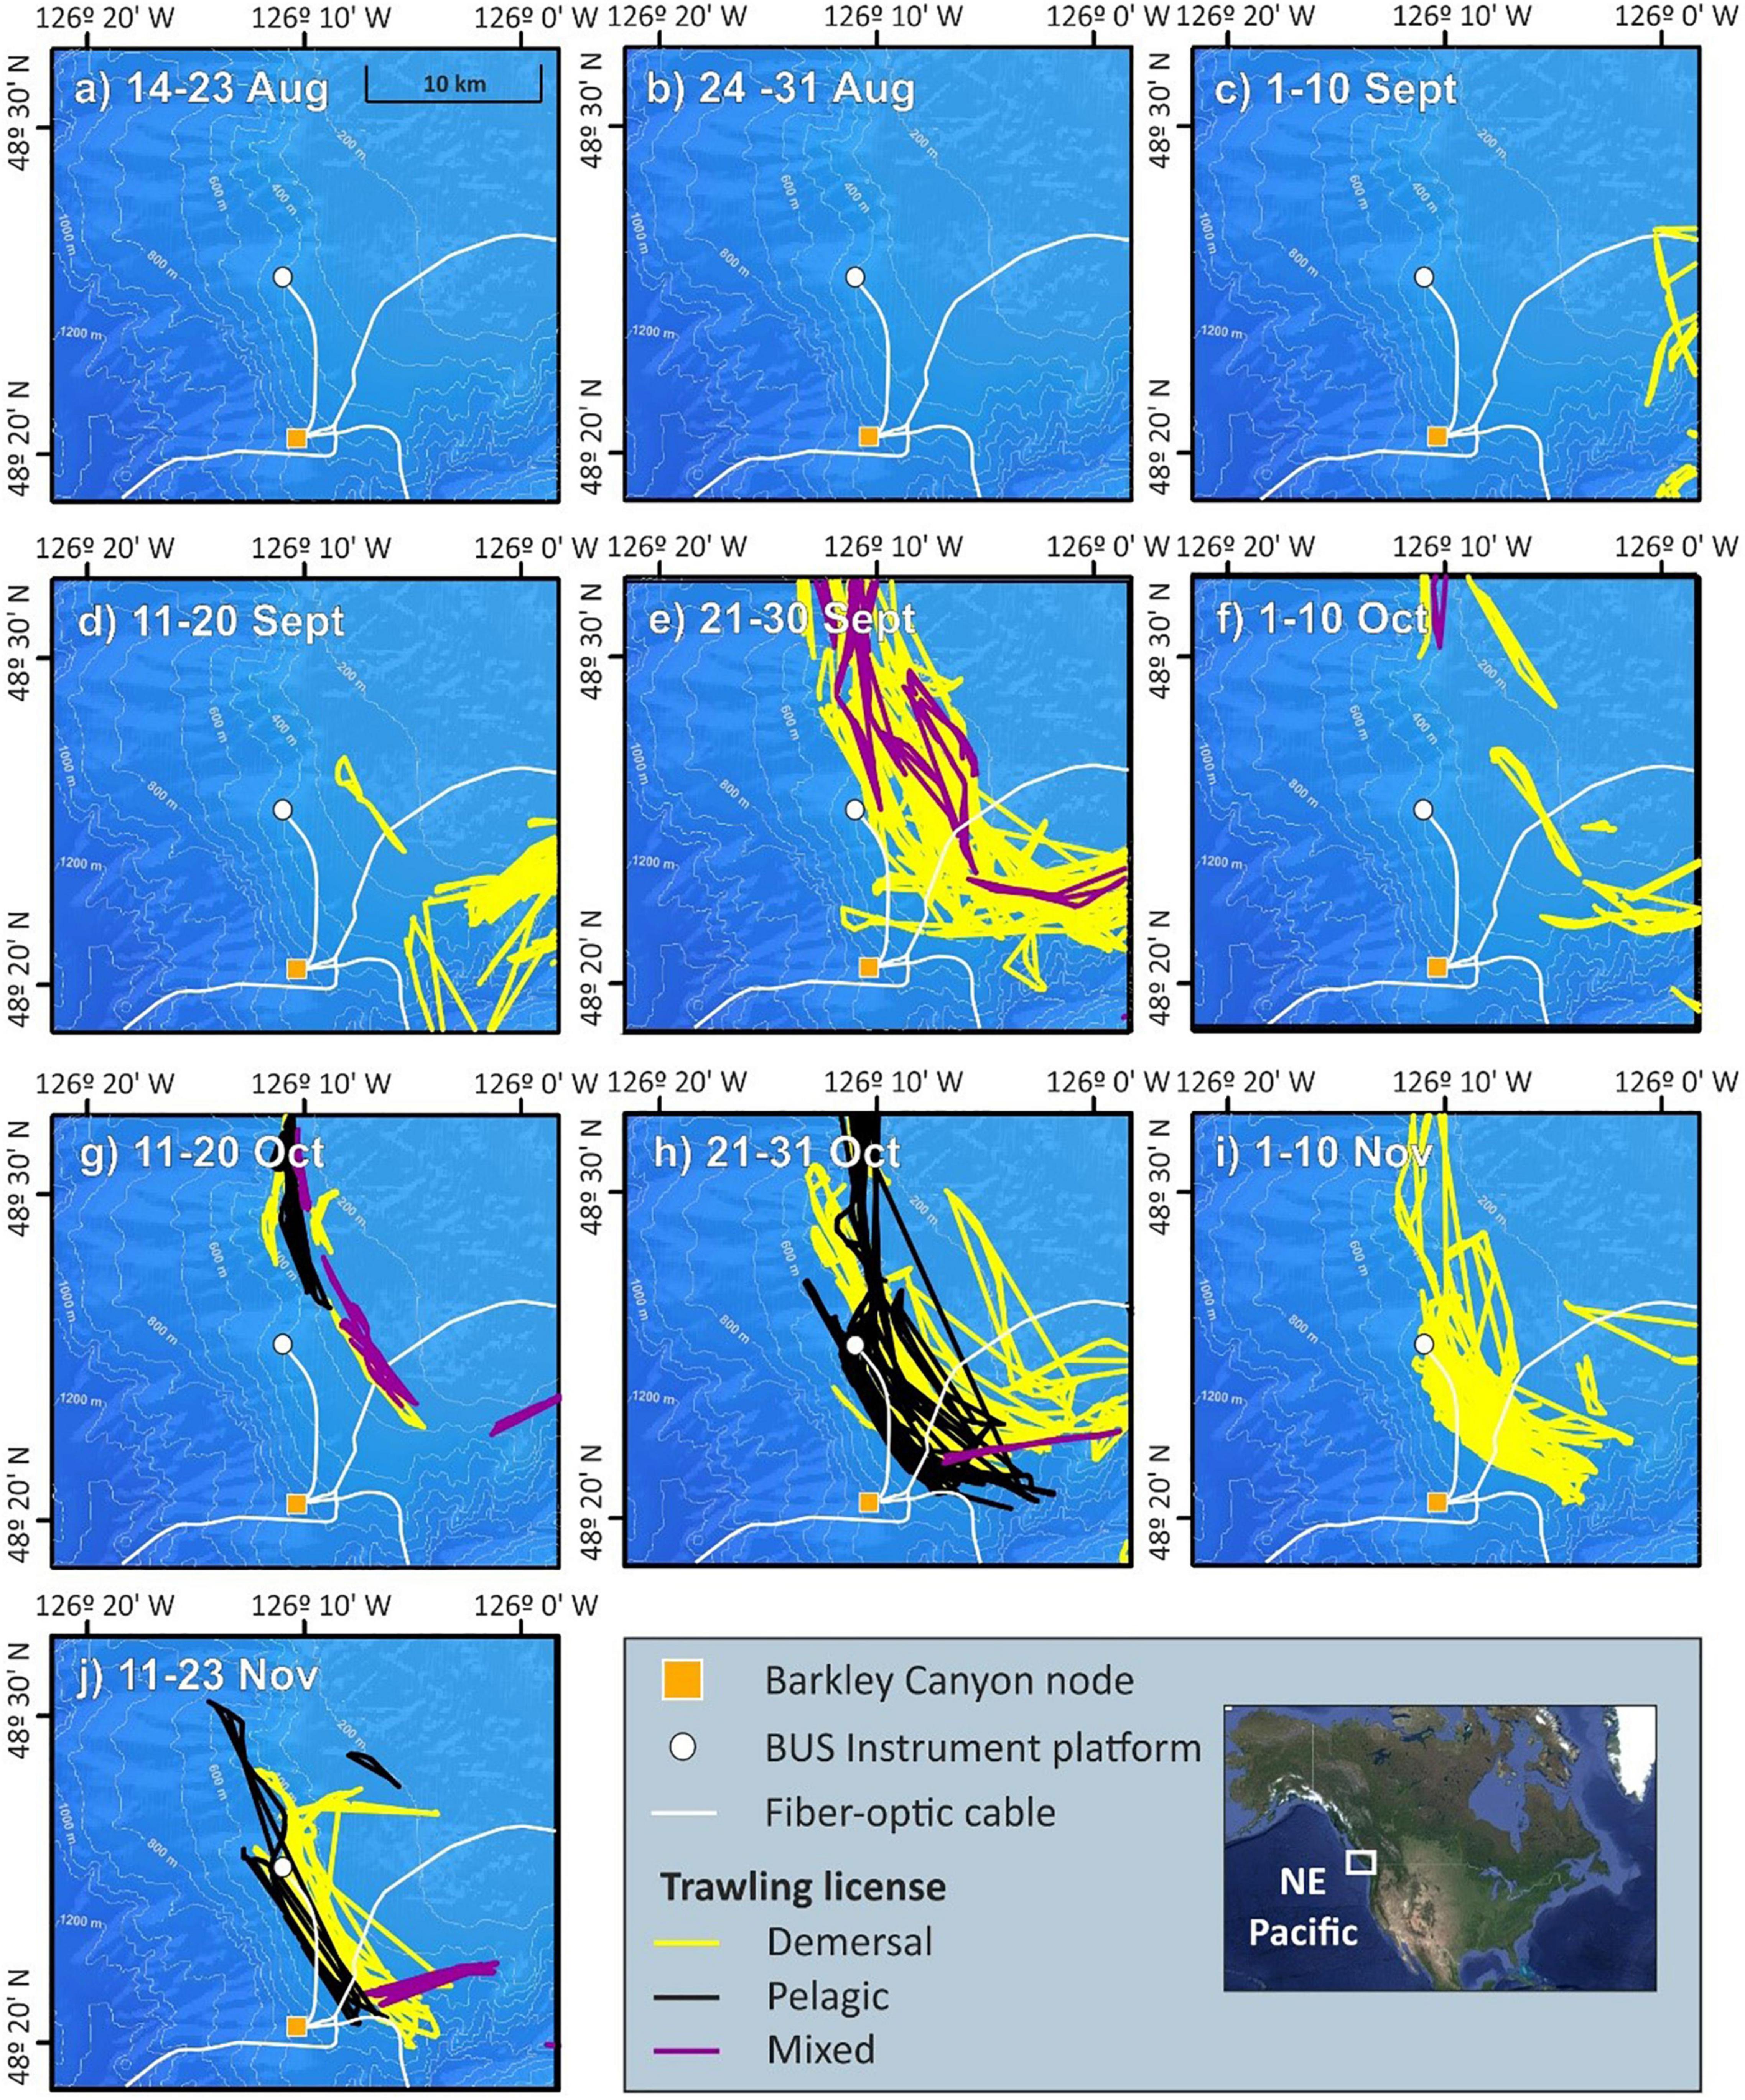
Figure 4. Detailed bathymetric map of the study site showing the variability in the number of hauls for late-summer (a–d) and fall months (e–j). Yellow lines represent fishing hauls by vessels holding demersal trawl licenses, black lines represent fishing hauls by vessels holding pelagic trawl licenses, and magenta lines represent fishing hauls by vessel holding mixed licenses (i.e., the same vessel can hold both demersal and pelagic trawl licenses). For interpretation of the references to color in this figure legend, the reader is referred to the web version of this article.
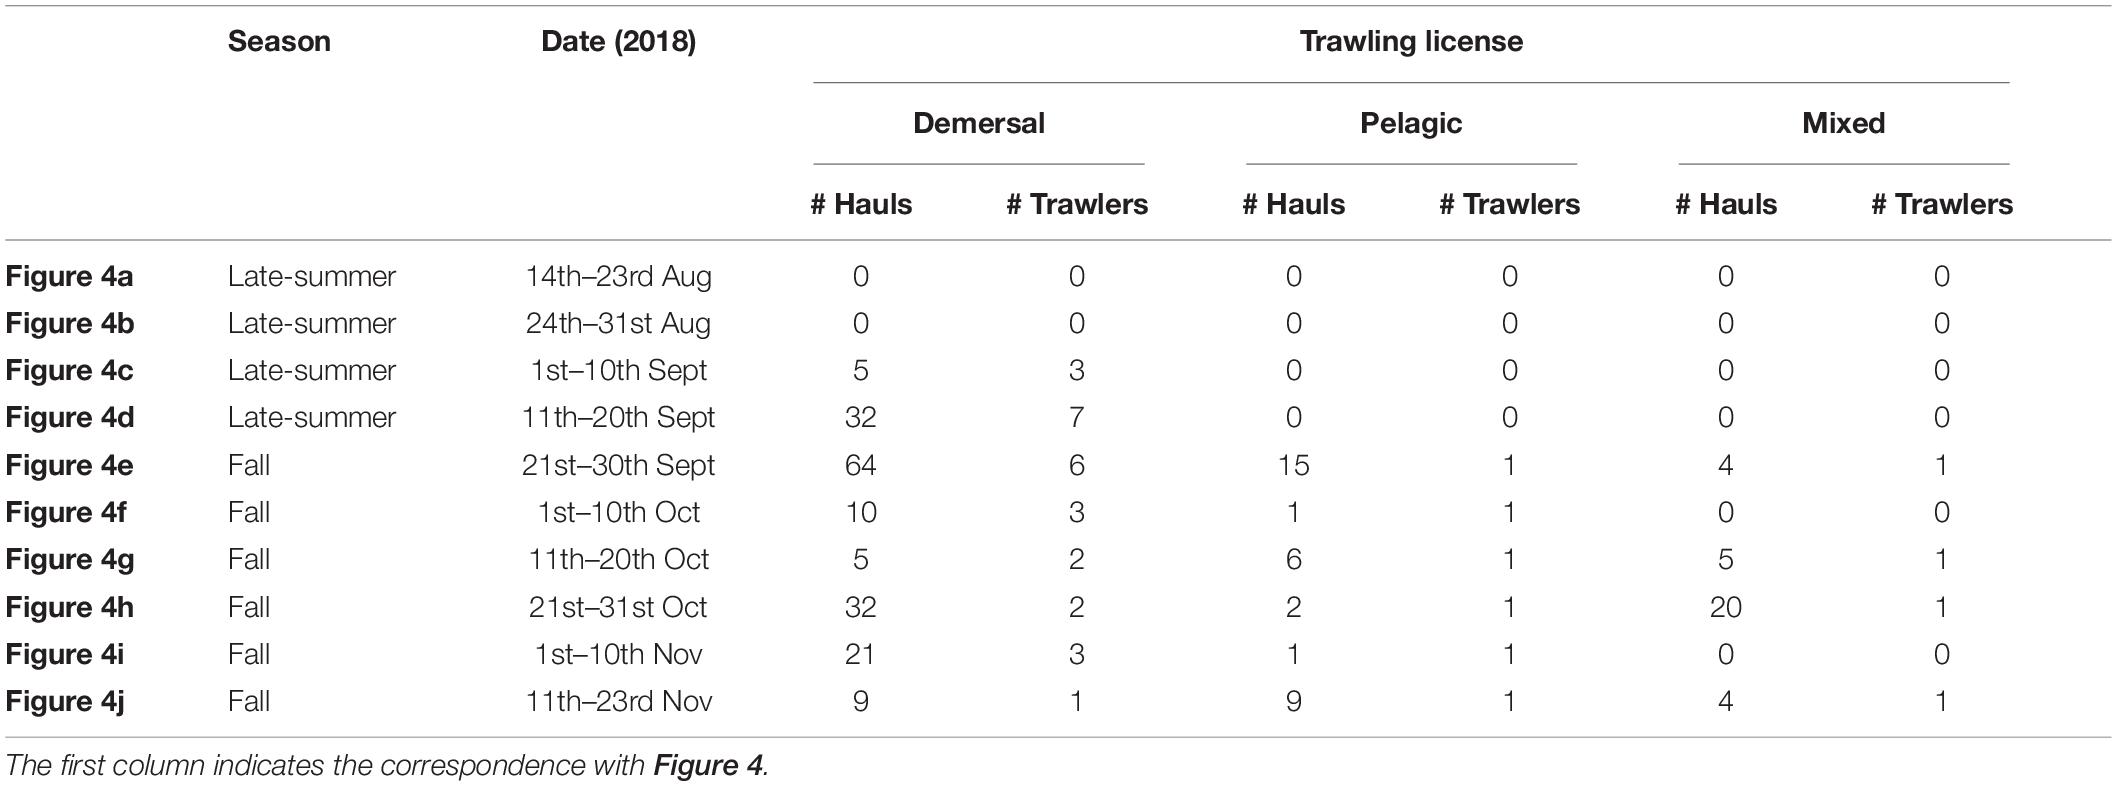
Table 2. Number of hauls and number of trawlers for each trawling method during defined periods.
The highest fishing intensity occurred during fall months (Figures 4e–j), whereas the lowest fishing intensity occurred in early October, when most of the fishing hauls were detected on the upper slope between 200 and 400 m depth (Figures 4f,g). Moreover, the number of fishing hauls carried out by demersal trawl vessels was always higher than those carried out by pelagic trawl vessels (Table 2).
Demersal trawling activity was particularly intense in late September, late October and November, when most fishing hauls were detected on the open slope between 200 and 600 m depth (Figures 4e–j). Pelagic trawling activity was less intense than demersal trawling activity, with an average of 4 hauls per 10-day period vs. Seventeen hauls per 10-day period, respectively, but a large proportion of pelagic hauls were particularly detected in late October and late November (Figures 4h,j). Only one vessel had a mixed trawling license, but we could not discern whether it performed pelagic or demersal hauls. Nevertheless, this vessel accounted for only 13% of all hauls detected, ranging from 1 to 15 hauls per 10-day period (Table 2).
Water Column Properties
Hydrographic Structure, Dissolved Oxygen, Fluorescence, and Turbidity
The hydrographic structure obtained by the CTD measurements from the VPS from 25 to 374 m water depth revealed distinct changes in temperature and salinity throughout the water column. These are ascribed to the different water masses present in the study area (Figure 5). In the upper ∼100 m of the water column, temperatures were between 8 and 12.5°C and salinities ranged between 32.5 and 33.6 (Figure 5 and Supplementary Figure 3), which corresponded to Pacific Subarctic Upper Water (PSUW). Below, the temperature ranged from 7.0 to 9.3°C and salinity ranged from 33.8 to 34.3, associated to the Eastern North Pacific Transition Water (ENPTW) that occupied the water column from 100–150 to ∼300 m depth (Figure 5 and Supplementary Figure 3). Underneath these two water masses, the deepest part of the hydrographic profiles exhibited a temperature minimum of 5.5°C and salinity values that ranged from 33.8 to 34.3, indicative of the Pacific Subarctic Intermediate Water (PSIW) (Figure 5 and Supplementary Figure 3).
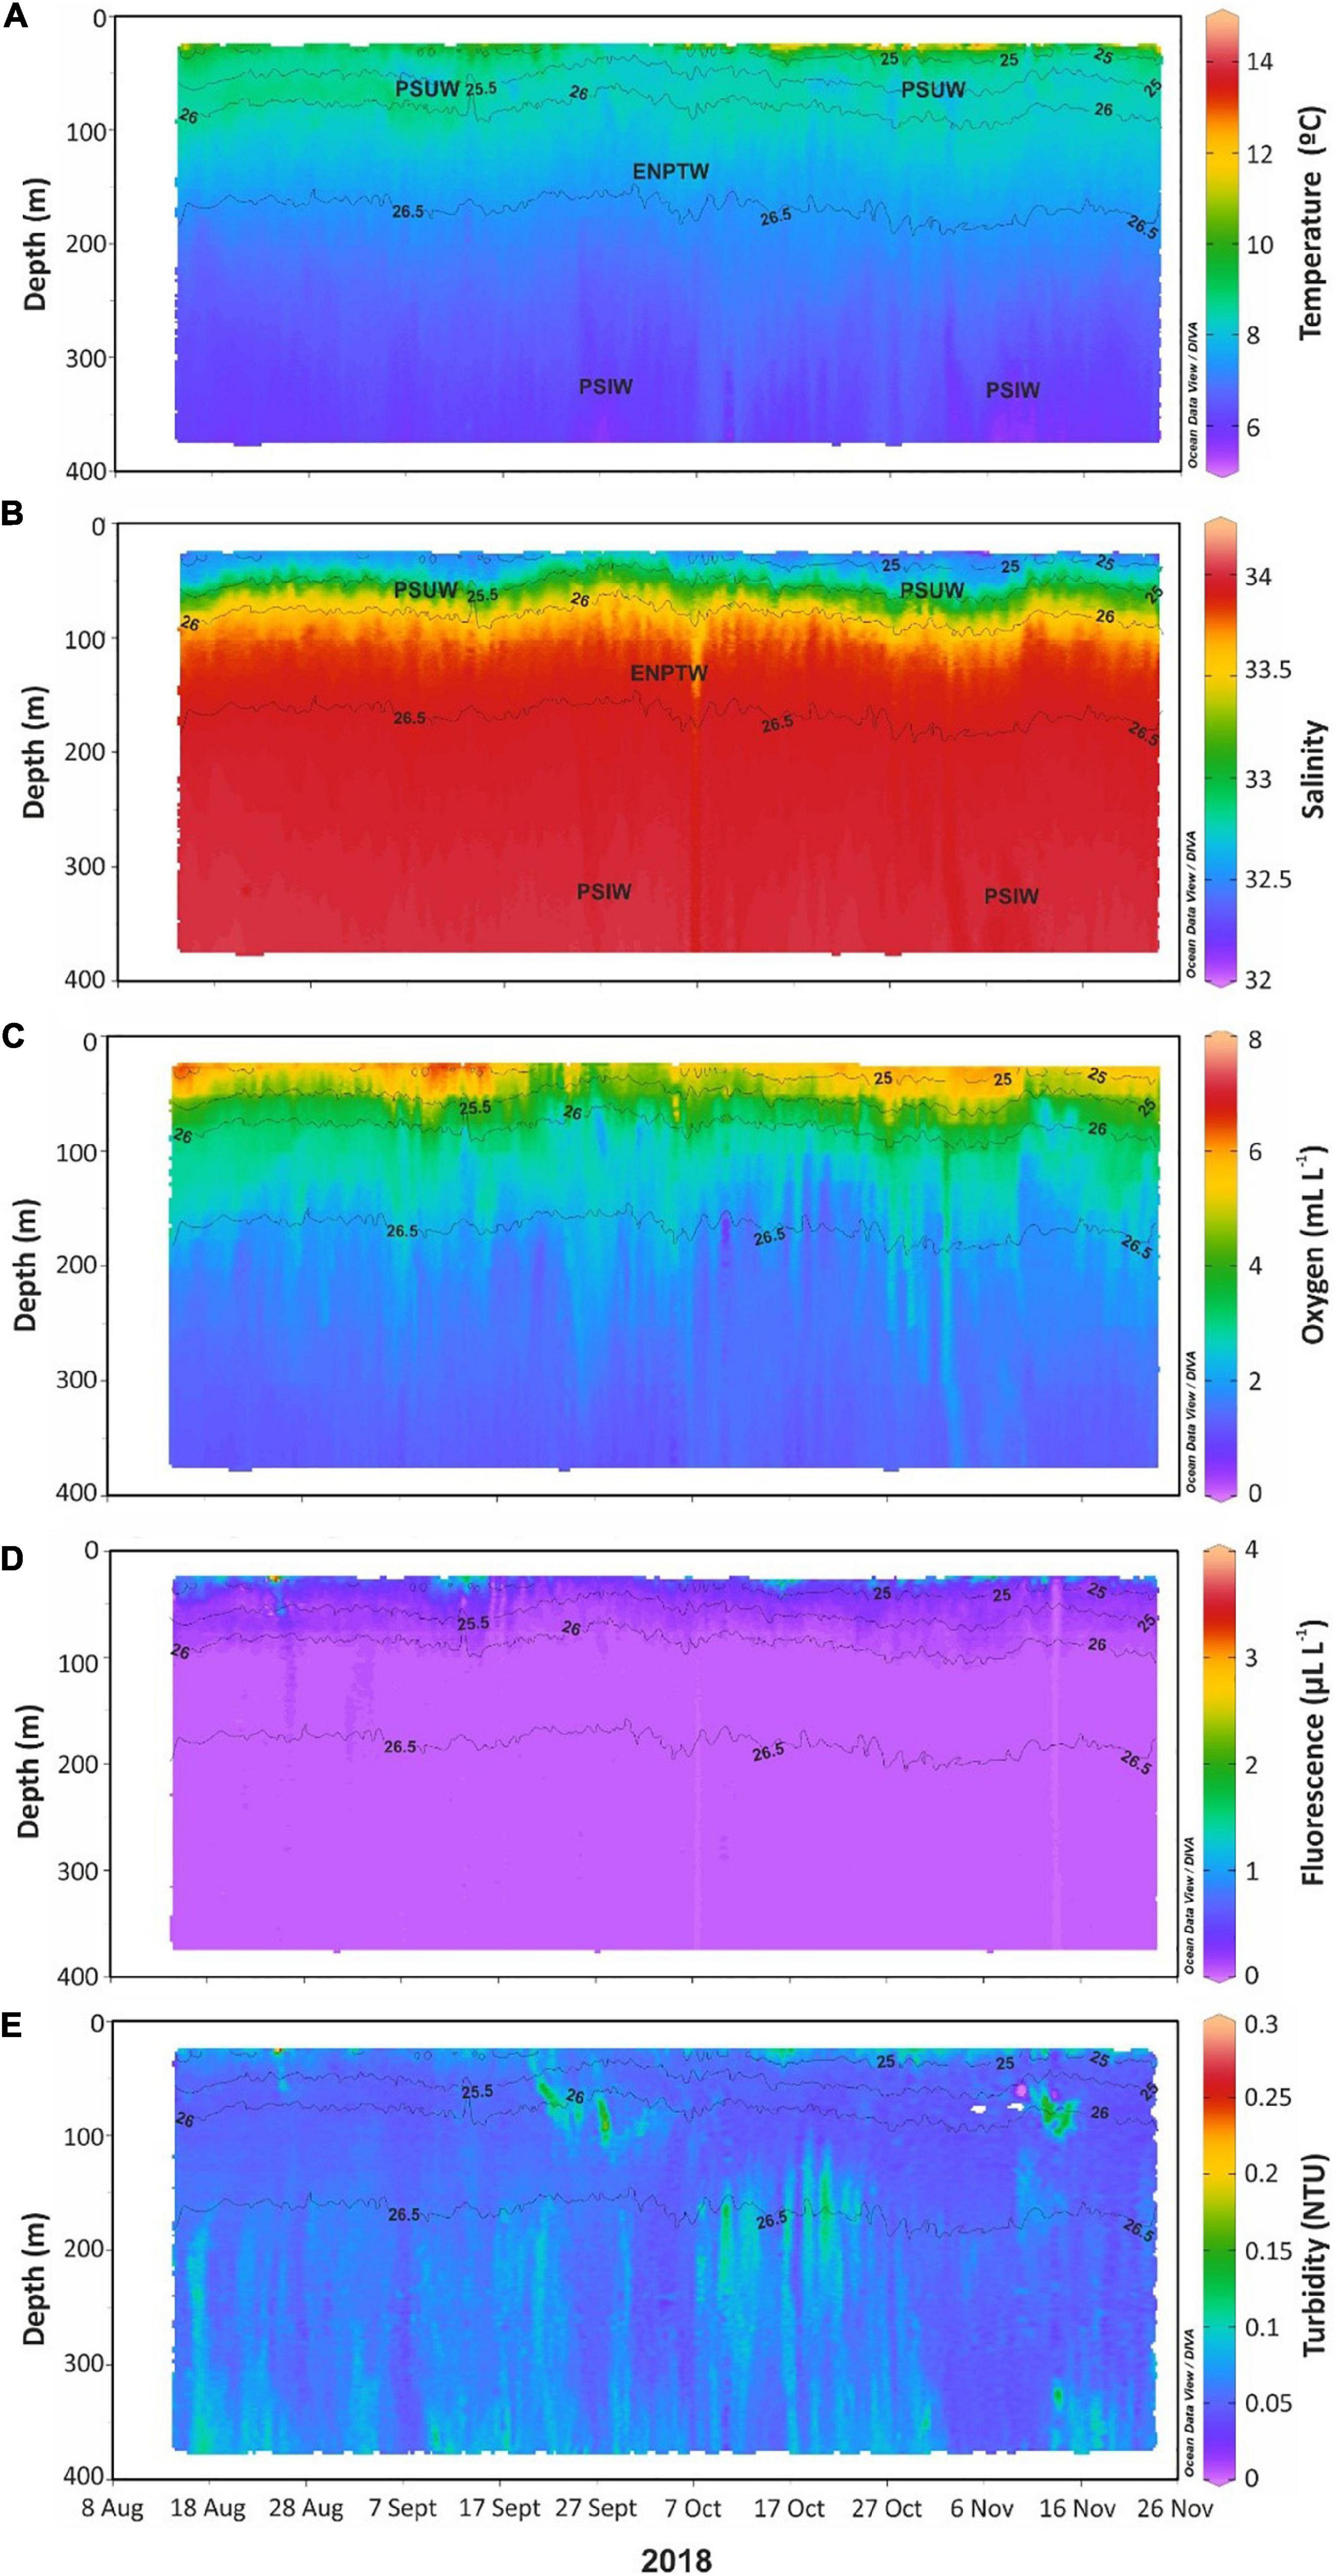
Figure 5. Time series of (A) potential temperature (°C), (B) salinity, (C) dissolved oxygen (mL⋅L– 1), (D) fluorescence (μL⋅L– 1), and (E) turbidity in NTU (Nephelometric Turbidity Units) measured by the Vertical Profiling System (VPS) during the study period, spanning from the 14th of August to the 23rd of November 2018, showing the different water masses present in the study area: Pacific Subarctic Upper Water (PSUW), Eastern North Pacific Transition Water (ENPTW) and Pacific Subarctic Intermediate Water (PSIW) (data plotted using Ocean Data View 4.7.10; http://odv.awi.de; Schlitzer, 2010). For interpretation of the color in this figure legend, the reader is referred to the web version of this article.
The VPS time series showed decreasing dissolved oxygen (DO) concentration from the surface (7 mL⋅L–1) toward the deepest part of the sampled water column, where the lowest DO concentrations were found (<1.2 mL⋅L–1) (Figure 5C). Within the upper water column, between 50 and 150 m depth, there was a sharp change in DO concentrations from 99 to ∼40% that corresponded to the boundary between the PSUW and the ENPTW. Anomalously low DO concentrations (1.8–2.4 mL⋅L–1) were also found at 87 m water depth compared to surrounding higher DO concentrations between the 26th of September and the 2nd of October (Figure 5C). Similarly, lower DO concentrations (2.4–2.8 mL⋅L–1) than those of the surrounding waters were observed between the 11th and the 15th of November at ∼70 m water depth (Figure 5C).
Within the surface layer, highest fluorescence (>1.5 μg⋅L–1) was observed, whereas it was not traceable below the surface layer (>70 m water depth) (Figure 5D).
The temporal distribution of the water column turbidity, measured in NTU, during the study period is shown in Figure 5E. Generally, increases in turbidity were observed near the seafloor and at mid-water depths, generating bottom and intermediate nepheloid layers, BNLs and INLs respectively. INLs were mainly recorded between 150 and 300 m depth, centered at about 200 m water depth. These increases corresponded to ∼150 m thick INLs developed at the shelf-break depth and showed turbidity values of ∼0.1 NTU (Figure 5E). Also, BNLs were recorded at water depths >300 m depth and displayed thicknesses of almost ∼74 m and turbidity values typically ranging between 0.05 and 0.14 NTU (Figure 5E). However, these features (both INLs and BNLs) were not always permanently observed in the turbidity profiles, being interrupted by periods of clear waters of variable duration (from 2 to 10 days) at certain times (Figure 5E).
Moreover, increased turbidity was occasionally observed at water depths <100 m depth distributed in punctual sub-surface nepheloid layers (SNLs), in which turbidity values ranged from 0.05 and 0.15 NTU (Figure 5E). Particularly, the hydrographic profiles showed highest turbidity at these SNLs on the 27th of September and 12th of November, peaking at 0.19 NTU and 0.14 NTU, respectively, at 88 m water depth (Figure 5E). Overall, these SNLs were observed during the entire study period, with no significant differences between late-summer and fall months (Figure 5E).
Line P Water Mass Properties Over the Slope
The hydrographic data obtained from Line P monitoring stations on the adjacent continental slope (P03 and P04) during summer and fall cruises of 2018 showed a close correspondence to the VPS time-series observations. Moreover, it also provided us with confidence in asserting that the different water masses and turbidity structure are characteristic of the study area. Data from stations P03 and P04 during summer and fall cruises (Figure 1) showed the same water mass structure to that observed at the VPS hydrographic profiles (Figures 6A,B).
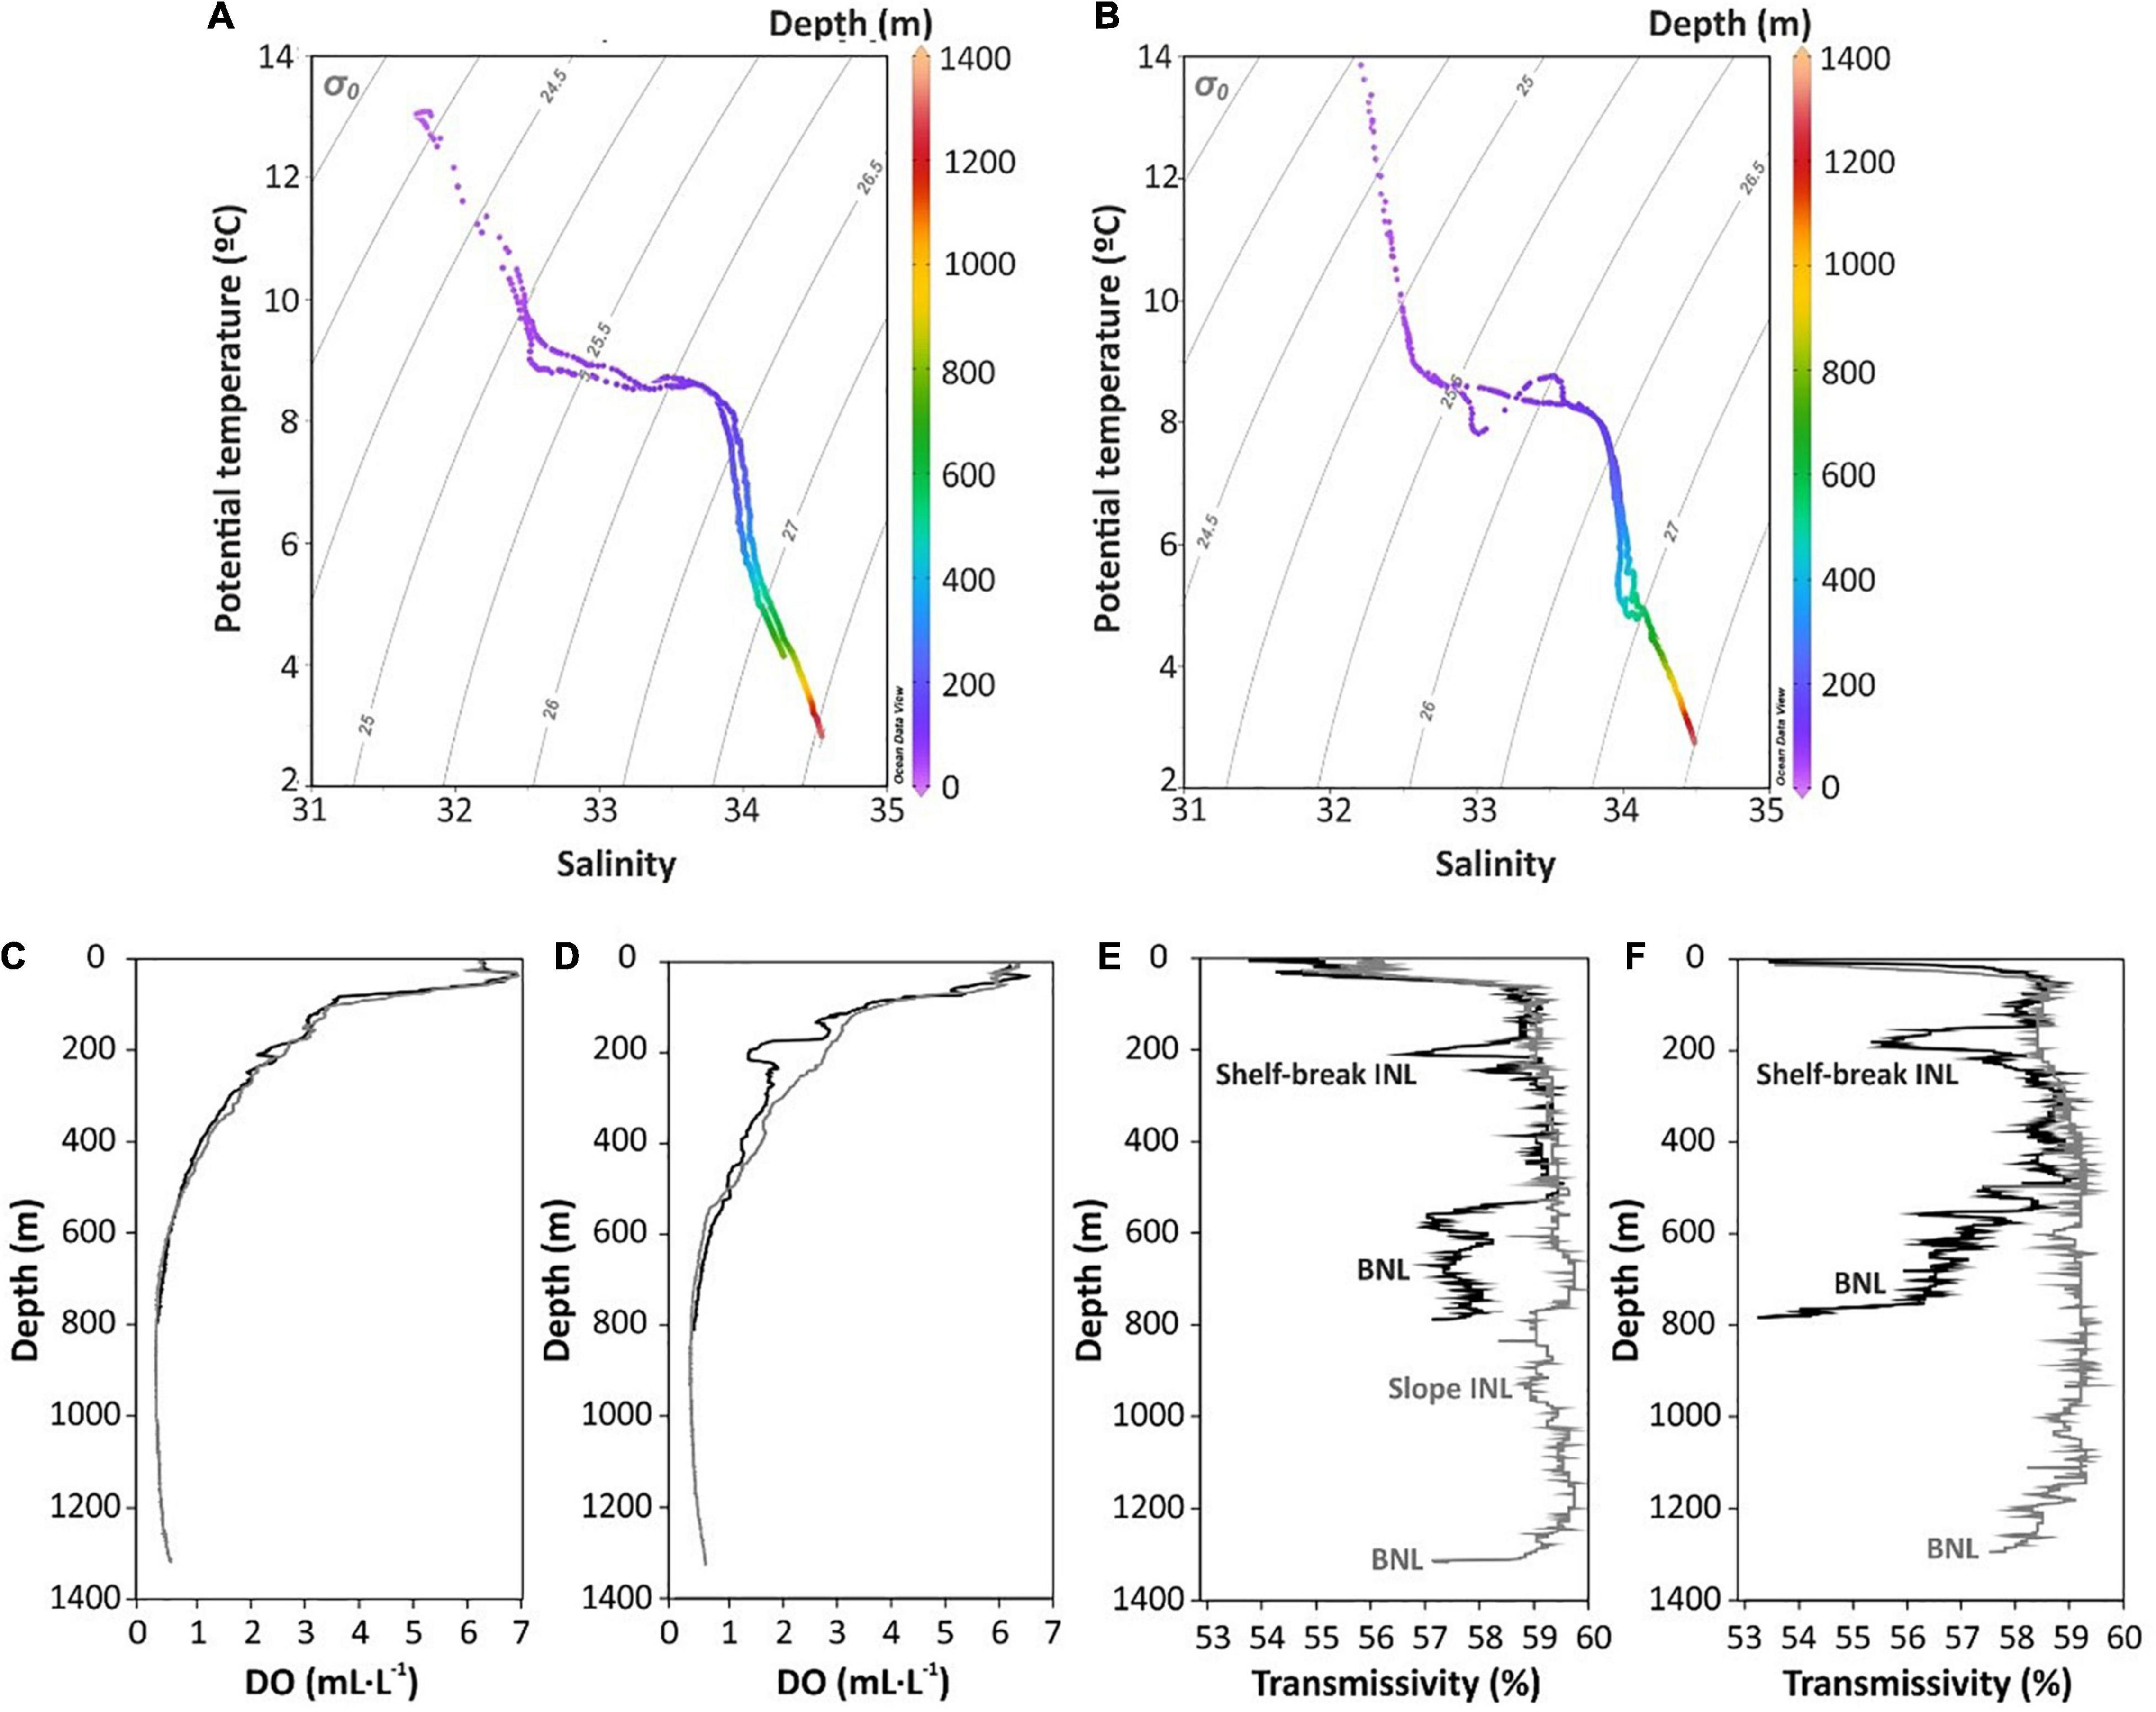
Figure 6. Hydrographic data collected during Line P cruises from year 2018. (A,B) TS diagrams in P03 and P04 stations in summer and fall cruises, respectively. (C,D) Dissolved oxygen (DO, mL⋅L– 1) profiles collected in P03 (black line) and P04 (gray line) stations during summer and fall cruises, respectively. (E,F) Transmissivity (%) profiles collected in P03 (black line) and P04 (gray line) stations during summer and fall cruises, respectively (data plotted using Ocean Data View 4.7.10; http://odv.awi.de; Schlitzer, 2010). For interpretation of the references to color in this figure legend, the reader is referred to the web version of this article.
Additionally, data collected from both cruises showed decreasing DO profiles (Figures 6C,D). The highest concentrations were found at the surface, where DO values were ∼7 mL⋅L–1, whereas lowest values were normally found at the deepest part of the hydrographic profiles (1 mL⋅L–1). During the summer cruise, the DO profile at station P03 showed a relative increase in concentration at 140 m water depth of 3.1 mL⋅L–1. Between 140 and 265 m depth the DO concentrations varied between 1.9 and 3.1 mL⋅L–1, from which DO values decreased until reaching lowest values toward the deepest part of the water column at 800 m water depth (Figure 6C). During the fall cruise, the DO profile of station P03 also presented a sharp drop in DO concentrations from 2.7 to 1.3 mL⋅L–1 from 140 to 210 m water depth (Figure 6D). During the fall cruise, the deeper station P04 did not show such variations in DO concentrations. At the same time, it showed monotonically decreasing DO concentrations down to 0.2 mL⋅L–1 from ∼100 to almost 900 m water depth, from which DO concentrations slightly increased to 0.5 mL⋅L–1 toward the bottom at 1,300 m water depth (Figure 6D).
During both summer and fall cruises, the turbidity profile of station P03 showed an INL at the shelf-break depth (∼200 m water depth) and a BNL at 560 m water depth that extended to the bottom (>780 m in summer, and >790 m in fall, respectively) (Figures 6E,F). The shelf-break INL was more intense during the fall cruise (Figure 6F) than in summer (Figure 6E) and was not observed farther offshore at P04 (Figures 6E,F). Similarly, the BNL observed at P03 was slightly more intense in fall than in summer, whereas it was not observed at the turbidity profiles recorded farther offshore at station P04. Nevertheless, a diluted slope-INL was identified at 780 m depth during summer at P04, most probably generated from the detachment of the BNL observed at station P03. This appeared to be a transient nepheloid layer, as it was not observed during fall (Figure 6F). Finally, a BNL was recorded at 1,300 m water depth during both summer and fall cruises at station P04 (Figures 6E,F).
Dynamics of Water Currents
The speed and directions of water currents measured by the low-frequency ADCP at the BUS Instrument platform during the study period were decomposed in across- and along-margin components (Figure 7). Generally, across-margin currents during the study period were weaker than along-margin currents, with maximum across-margin velocities of 0.07 m⋅s–1 during late-summer months and of 0.1 m⋅s–1 during fall months, particularly in early November (Figure 7A). They were characterized by a high variability in current direction due to the tidal motion (Figure 7A). In late October, across-margin currents displayed a predominant offshore direction that reversed onshore during early November (Figure 7A). Along-margin currents displayed the strongest velocities recorded during the study period, presenting near-constant values of >0.2 m⋅s–1 that were mainly directed toward the northwest. Short periods of southeastward currents of 0.1 m⋅s–1 were also detected in early and late-September, mid-October, and the first 2 weeks of November (Figure 7B).
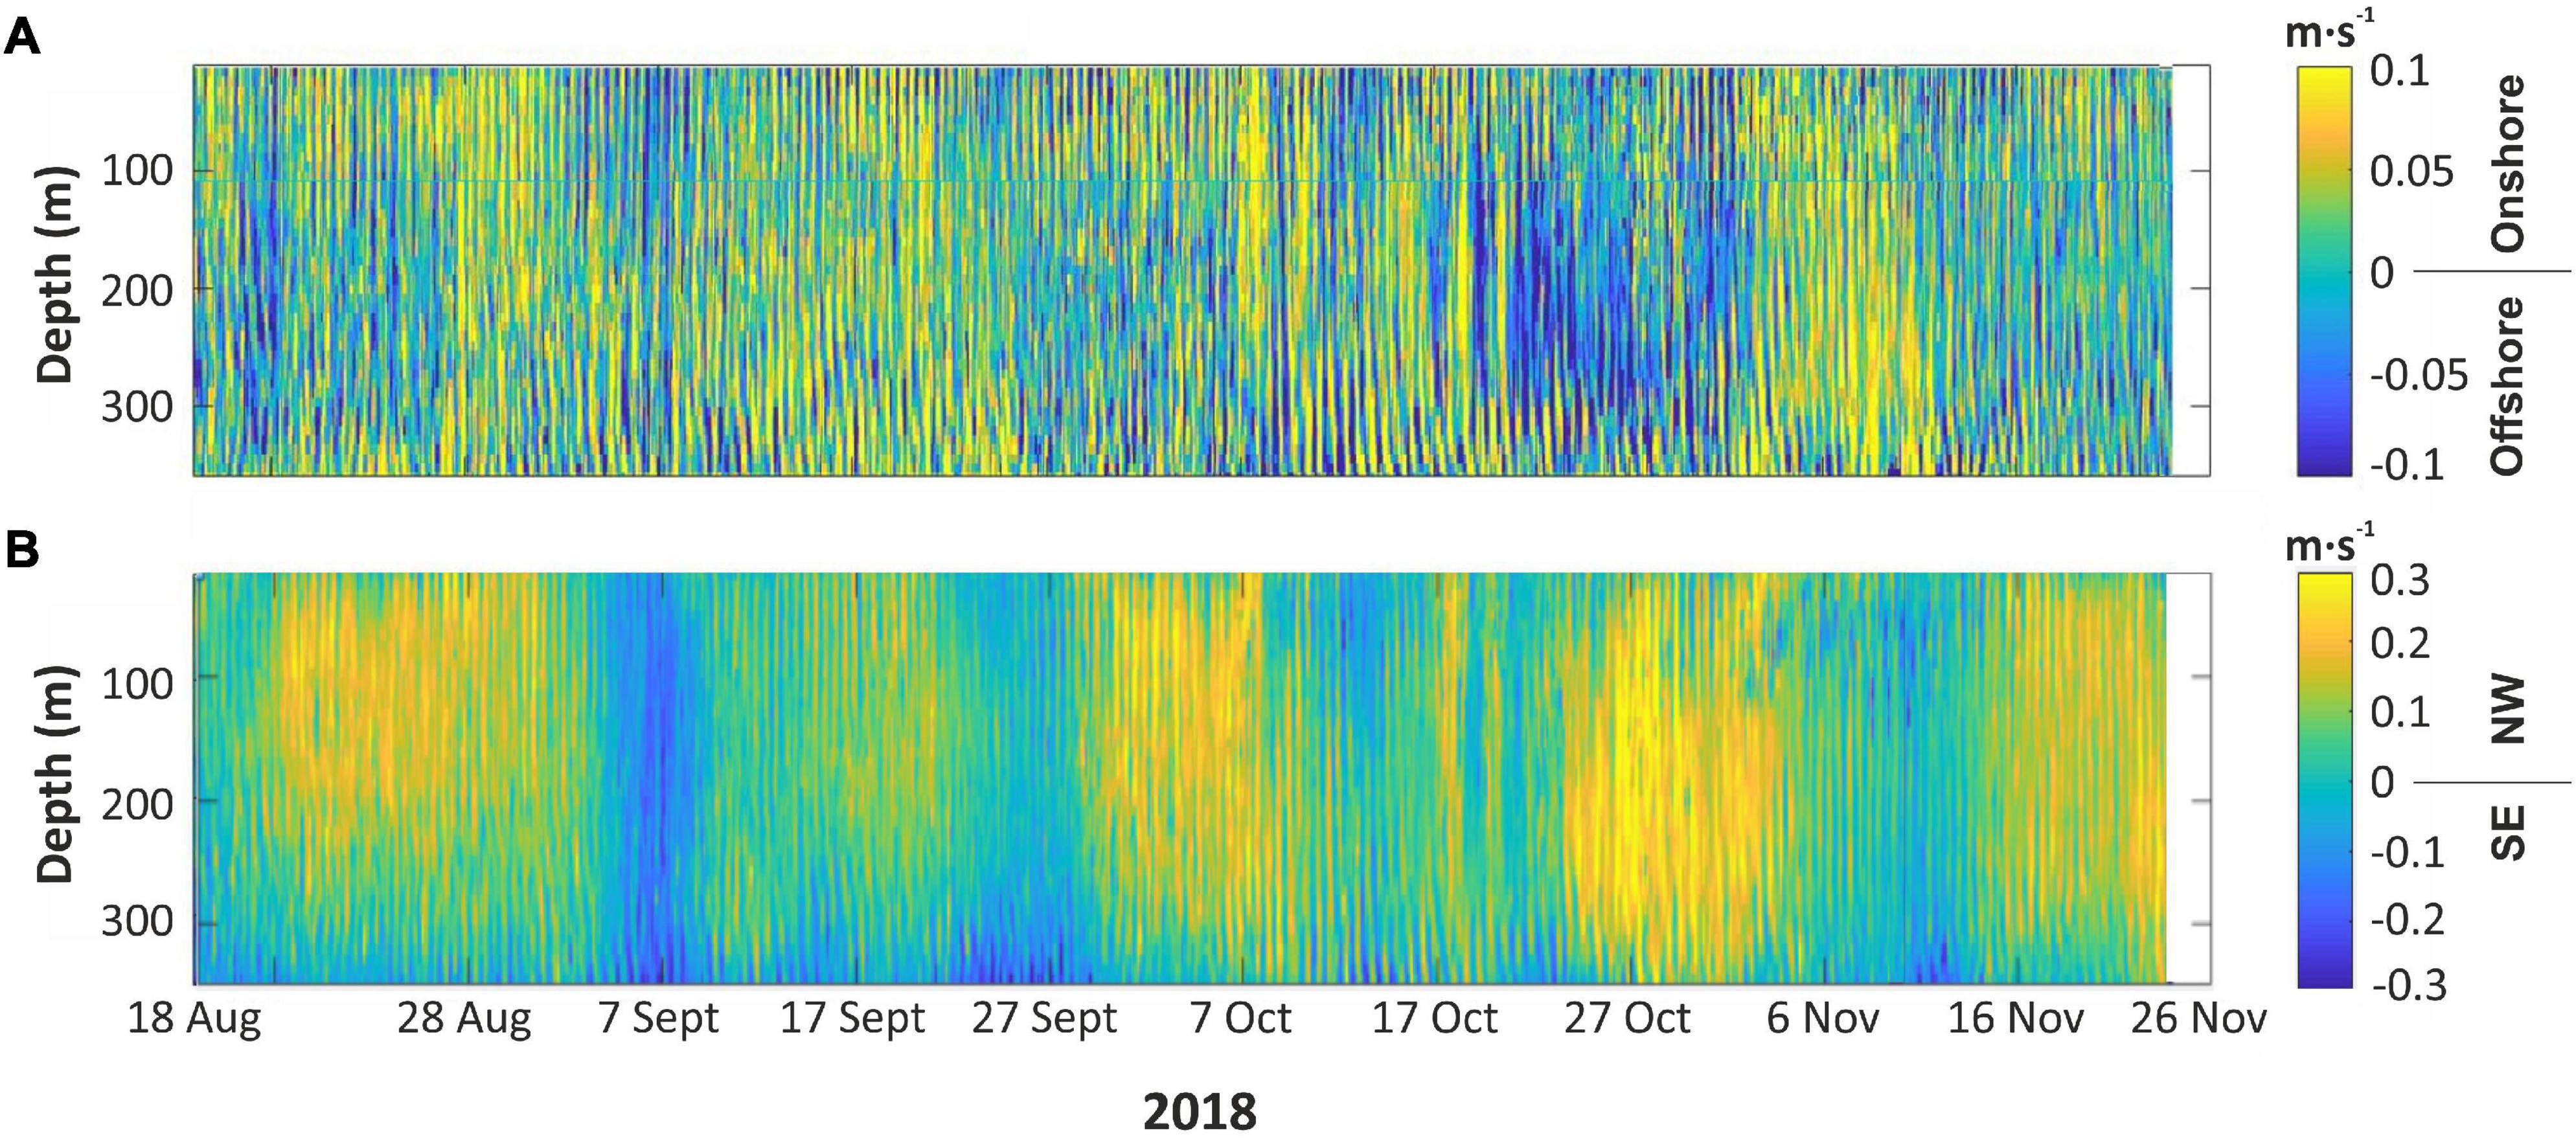
Figure 7. (A) Across-margin and (B) along-margin velocity components, in m⋅s– 1, measured with the 75 kHz Acoustic Doppler Current Profiler (ADCP) installed at the BUS Instrument Platform during the study period, spanning from the 14th of August to the 23rd of November 2018. Note the change in scale for the along-margin component. For interpretation of the references to color in this figure legend, the reader is referred to the web version of this article.
Discussion
Nepheloid Layer Distribution
The nepheloid layer distribution over the upper slope region of Vancouver Island exhibited a vertical distribution consisting of: (i) a continuous SNL within the first 70 m of the water column, (ii) intermittent sub-surface turbidity increases between 70 and 90 m water depth, (iii) INLs between 150 and 300 m at the depths of the shelf-break and upper slope, and (iv) a weak discontinuous BNL close to the bottom (∼10 m off the bottom) (Figure 5E).
The SNL maximum (0.16 NTU) at <70 m water depth (Figure 5E) mainly consisted of phytoplankton particles from the euphotic zone, as inferred by the high fluorescence values recorded at the same water depth (Figure 5D). This primary productivity is supported by inputs of inorganic nutrients via a number of processes, which include along-shore transport, local wind-driven upwelling, interaction of mesoscale currents with bottom topography, tidal mixing, and estuarine circulation in the Strait of Juan de Fuca (Crawford and Dewey, 1989).
In addition to the SNL, elevated turbidity values of 0.14–0.19 NTU were observed sporadically between 70 and 90 m water depth (Figure 5E). The vertical profiles exhibit coherent peaks of decreasing dissolved oxygen (DO) at the same water depths (Figure 5C), under upwelling-favorable conditions according to the fluctuation of the isohalines and isotherms (Figures 5A,B), suggesting that these turbidity increases likely corresponded to zooplankton accumulations. From spring to fall, strong upwelling events provide nutrients to the continental shelf of Vancouver Island (Mackas, 1992) that enhance phytoplankton activity, especially during late-summer months, stimulating zooplankton grazing (Simard and Mackas, 1989). Most of the zooplankton that have been identified in this area are copepods (Calanus marshallae, Pseudocalanus spp., Neocalanus cristatus and N. plumchrus, and Metridia pacifica), which are known to undergo seasonal ontogenetic vertical migration (Miller et al., 1984; Mackas et al., 1998), including their advection through Barkley Canyon (De Leo et al., 2018). These include euphausiids (Euphasia pacifica and Thysanoessa spinifera) (Mackas et al., 1997), chaetognaths (Sagiita elegans and Eukrohnia hamata, and Salpa spp.), hydromedusae (Aglantha and Phialidium), and ctenophore (Pleurobrachia) (Haigh and Schnute, 2003). Nevertheless, sub-surface layer zooplankton populations tend to decline rapidly on the continental shelf area through spring to fall, despite the high-food availability and relatively low predation (Mackas, 1992; Venello et al., 2021).
The INLs developed at the shelf-break, mainly centered at ∼200 m depth over the upper slope, showed turbidity values of ∼0.1 NTU (Figure 5E). Although these INLs at the P03 station are only some meters thick (Figures 6E,F), at the VPS location they are often connected with the BNL, displaying continuous turbidity increases from 150 m depth to ∼375 m depth (at least ∼15 m off the bottom) (Figure 5E). This probably indicates that sediment particles are detached not only from the shelf but also from deeper regions of the slope, and that these particle detachments are then scattered throughout these water depths, rather than being stratified. These connected INL-BNL were frequently interrupted by periods of clear waters and were common in upper slope waters (between 200 and 400 m depth) (Figure 5E) but not farther offshore, as they were not recorded in the turbidity profiles of station P04 (Figures 6E,F). In contrast, the BNL that extended from ∼560 m depth down to the bottom (798 m depth) (Figures 6E,F) observed at P03 would have been detached downslope across the margin, contributing to the development of the slope-INL at similar depths between 780 and 1,000 m depth at station P04 during the summer cruise (Figure 6E). The general offshore decrease of turbidity indicates particle dispersal and settling that limited the offshore extension of this slope INL (Hickey et al., 1986).
The across-margin extent of these INLs indicate a complex interaction between the sediment resuspension mechanisms and the hydrodynamics that dominate in this region. Therefore, it is key to understand the frequency and the timing of resuspension events, as well as the strength and the spatial and temporal continuity of currents over the entire continental slope.
Potential Resuspension Mechanisms Generating Nepheloid Layers
Fall Storms
On the upper slope of Barkley Canyon, the more intense INLs (∼0.13 NTU) were observed at ∼200 m at the depths of the shelf-break, particularly between the 7th of October and the 6th of November (Figure 5E) when several storm events were recorded (Figure 3). During fall months, the passage of the Aleutian low-pressure system typically causes rapid fluctuations of wind and wave conditions associated to storms, and these are one of the primary mechanisms for resuspension of fine-sediments from mid- and outer-continental shelf depths (Sternberg and Larsen, 1975; Walsh and Nittrouer, 1999; McPhee-Shaw et al., 2004).
Storm events usually cause enhanced sediment transport and increased particle fluxes in slope areas, particularly in submarine canyons, by the advection of resuspended sediments from the adjacent continental shelves (Carson et al., 1986; Puig et al., 2003, 2014; Palanques et al., 2008). For example, in the neighboring Quinault Canyon off Olympic Peninsula (Figure 1), particulate matter on the shelf is resuspended by storm-induced currents and waves and is subsequently advected by the regional flow on a particular isobath (Carson et al., 1986), detaching as INL over the shelf-break (Hickey et al., 1986) from which the resuspended particulate material settles rapidly in amorphous aggregates, increasing particle fluxes at intermediate depths in the upper canyon region and near the bottom (Baker and Hickey, 1986). Specifically, Hickey et al. (1986) mentioned that the waves capable of moving sediment at depths of ∼150 m typically had Hs of 4–6 m associated with a Tp of 17 s.
The analysis of the temporal variability on the water column turbidity increases observed at the BUS site during the stormy period, however, indicated that during the study period the passage of storms was not a major mechanism responsible for resuspending and transporting sediments from the shelf into the upper slope. A close-up analysis between the 20th of October and the 6th of November, during the most intense stormy period, revealed no clear relationship between water turbidity increases, Hs, Tp, and offshore current intensity (Figure 8). The storm recorded on the 25th of October (Hs: 4 m, Tp: 13 s) seemed to generate turbidity increases that reached values of 0.1 NTU at 150–200 m water depth, while the storm occurring on the 4th of November, which had similar characteristics (Hs: 4.4 m, Tp: 11 s) than the former storm, did not appear to generate any water turbidity increases (Figure 8). This de-coupling between the atmospheric forcing processes and water turbidity could indicate that the advection of resuspended shelf sediments is not entirely dependent on the storm’s magnitude but also on the duration of prevailing currents delivering resuspended particles toward the shelf edge and deeper areas (Palanques et al., 2008).
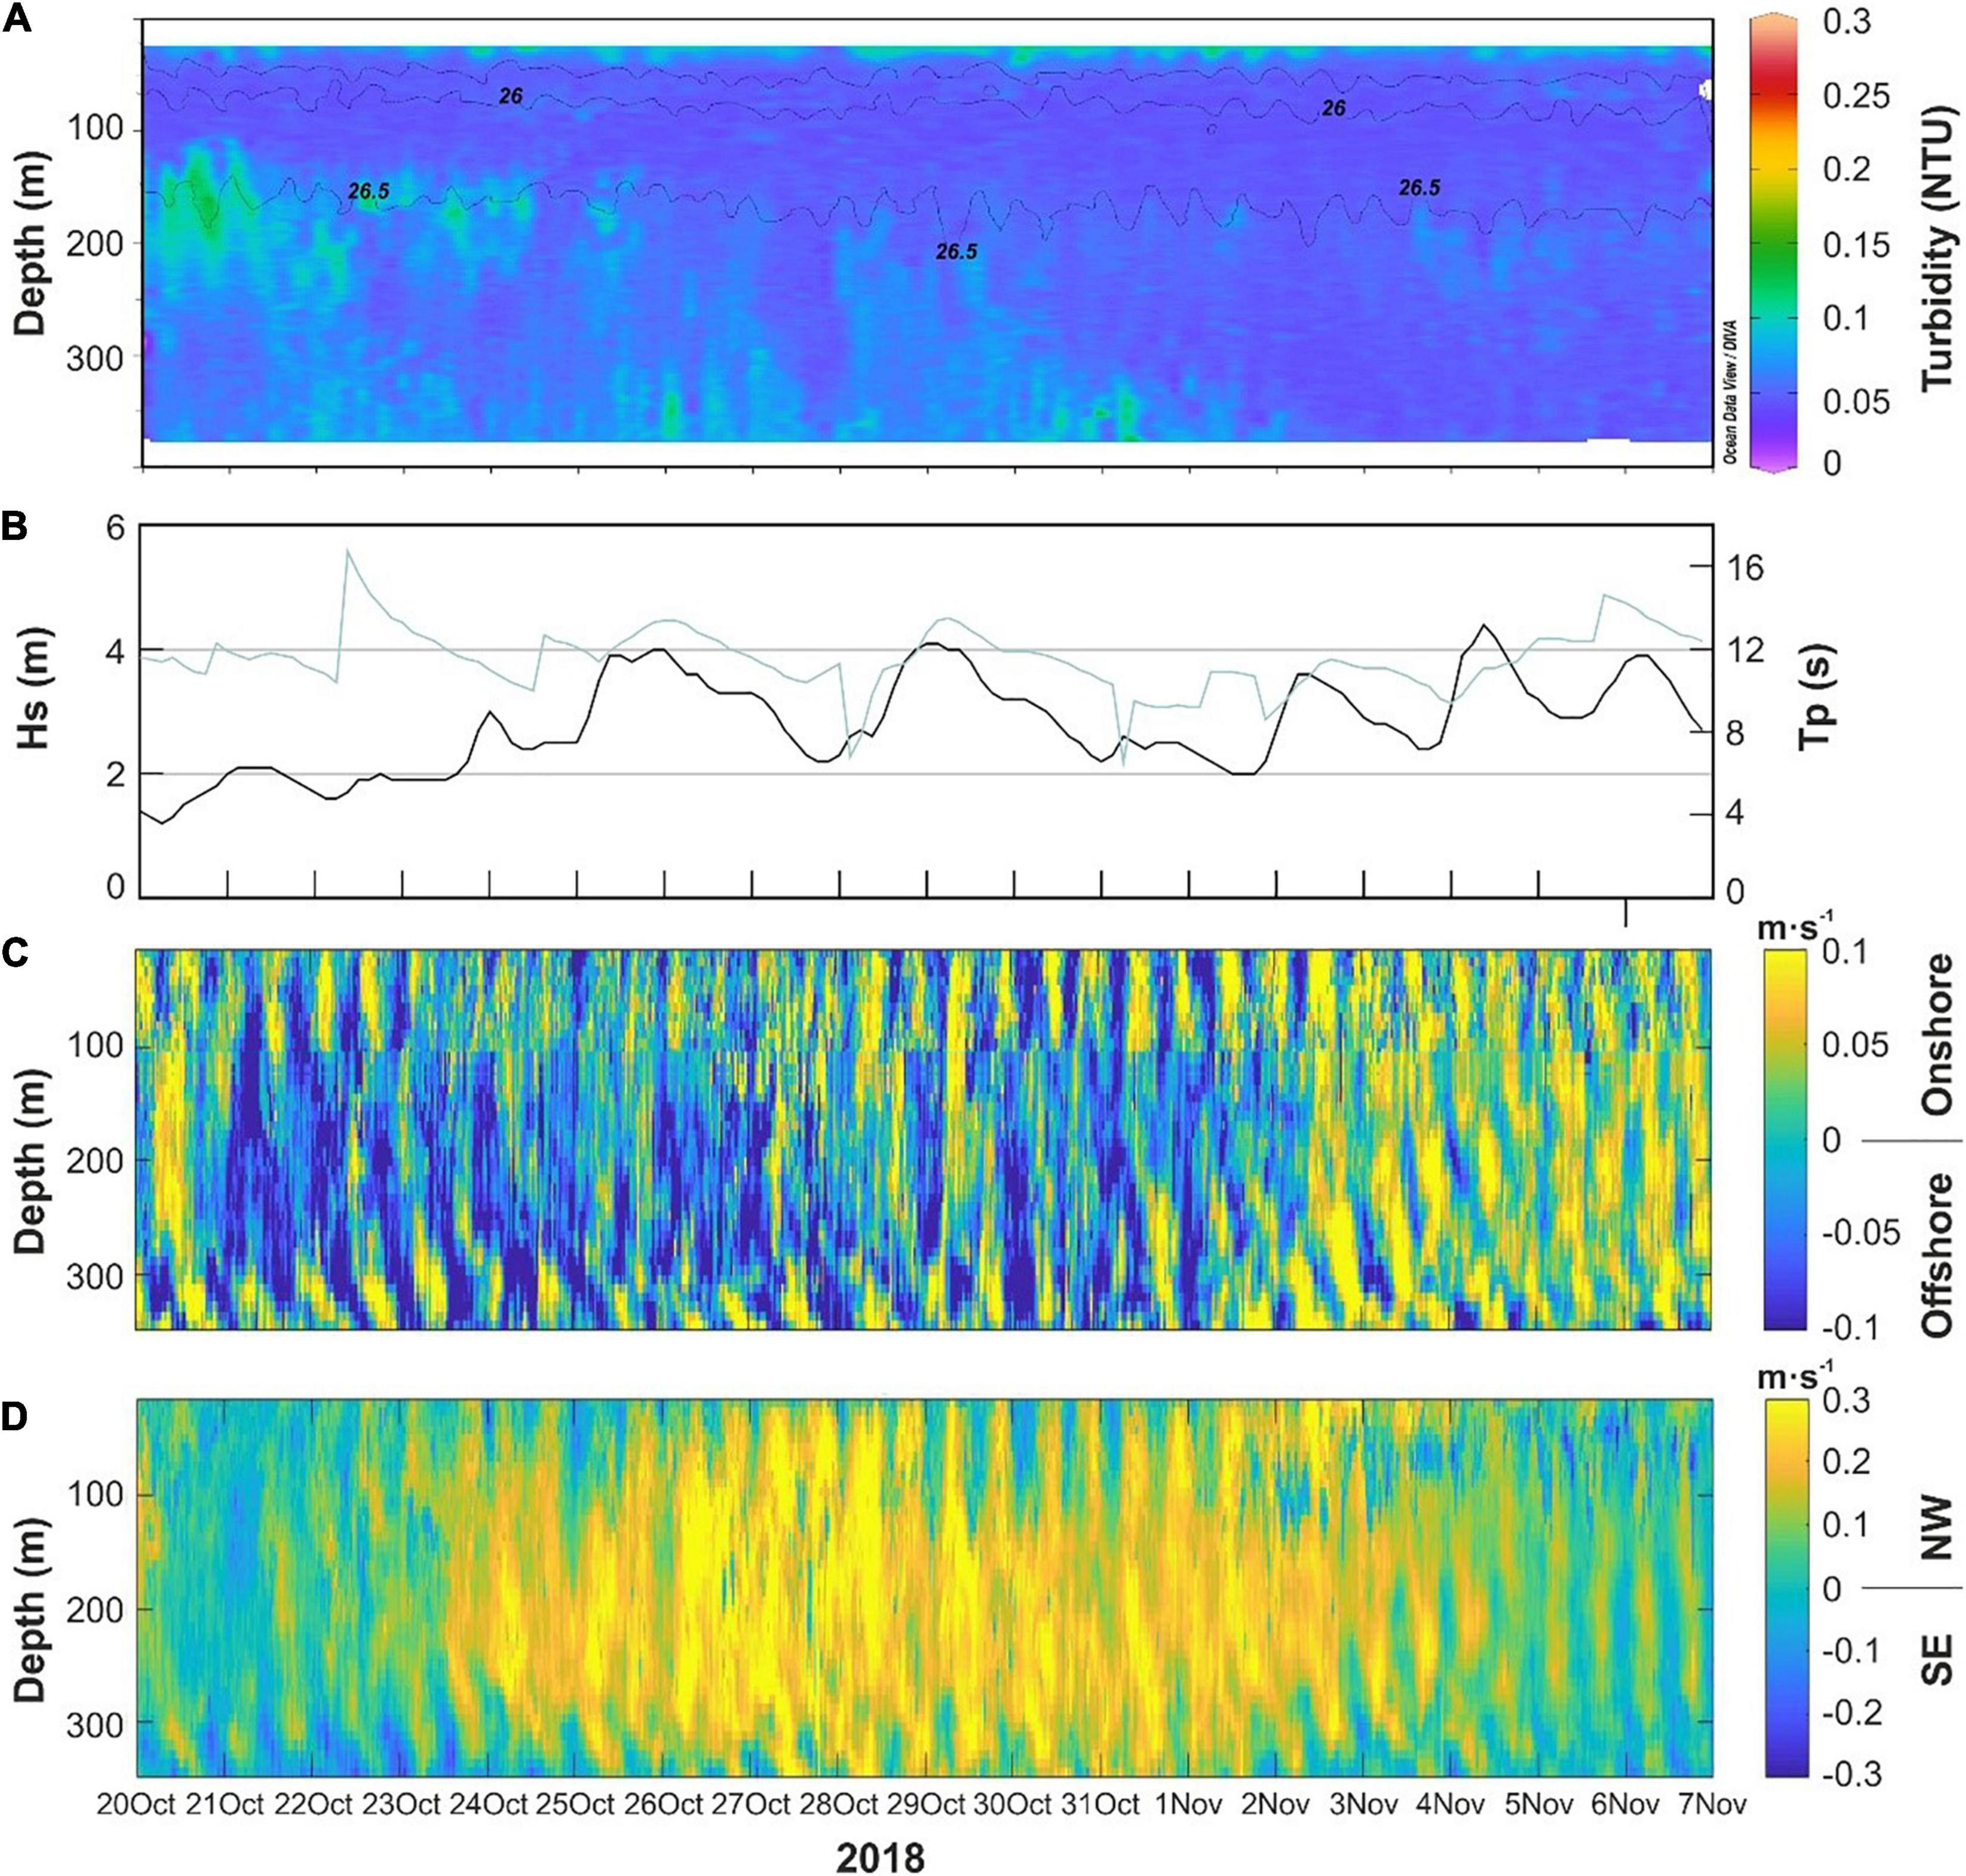
Figure 8. Temporal and spatial distribution during the more intense stormy period of fall 2018 of (A) turbidity in NTU, (B) significant wave height (Hs) (black line) and mean wave period (Tp) (light blue line), (C) across-margin velocity component, and (D) along-margin velocity component, in m⋅s– 1, measured with the 75 kHz Acoustic Doppler Current Profiler (ADCP) installed at the BUS Instrument platform. Note the change in scale for the along-margin component. For interpretation of the references in this figure legend, the reader is referred to the web version of this article.
Tides and General Flow
The interaction of internal waves with the seafloor has been described as the main mechanism responsible for generating and maintaining high near-bottom suspended sediment concentrations on continental margins (Cacchione and Drake, 1986; Palanques and Biscaye, 1992; Puig et al., 2001, 2004; McPhee-Shaw, 2006). On the continental margin of Vancouver Island, internal waves occur at tidal frequencies, being diurnal baroclinic velocities larger than semi-diurnal barotropic velocities (Crawford and Thomson, 1982; Drakopoulos and Marsden, 1993). From our data, the internal tide seems to propagate along the pycnocline formed at ∼100 m water depth at the boundary between the Pacific Subarctic Upper Water (PSUW) and the Eastern North Pacific Transition Water (ENPTW), as observed in the oscillations of the isopycnals at this water depth (Figures 7A,B). However, during the present study, the across-margin currents associated to the internal tide were generally weak (between 0 and 0.1 m⋅s–1) and no turbidity increases could be linked to the internal tide fluctuations at the profiled water depths (Figure 8).
Along-margin currents were greater than across-margin currents (>0.2 m⋅s–1; Figure 7B) and presented dominant northwestward direction at mixed tidal frequencies (Figure 7B). This is in general agreement with a previous study conducted off Vancouver Island (Crawford and Thomson, 1982), as well as with other studies carried out along the west coast of North America which have also suggested that bottom diurnal and semidiurnal barotropic tides propagate northward along the west coast of North America, mainly as Kelvin Waves (Munk et al., 1970; Crawford et al., 1981).
In the neighboring Quinault Canyon (Figure 1), quasi-geostrophic fluctuations in flow are superimposed on the mean flow every season, exceeding it by an order of magnitude. This means that during any particular season both southeastward and northwestward flow events can occur (Carson et al., 1986). Battisti and Hickey (1984) demonstrated that fluctuations in the flow field are due to a combination of forcing by the local wind field and freely propagating waves that are generated by the wind field along the coast. The direct effect of these wind-driven fluctuations tends to be confined to the upper water column (250 m depth) and shallower bottom depths (Battisti and Hickey, 1984). Off the Washington State coast, the resulting flow is generally northward during winter when principal sediment transport events occur (Hickey, 1979). Therefore, along-margin currents along Vancouver Island could affect the advection of resuspended sediments within slope depths, considering that nearly clear-water periods coincided with southeastward currents and turbid-water periods with northwestward currents (Figures 5E, 7B). Furthermore, these along-margin currents are likely associated with the California Undercurrent (CUC) which flows northwestward during late-summer and fall months at the depths of the shelf-break (Hickey, 1979; Pierce et al., 2000). Therefore, the CUC may act as a relevant mechanism for both sediment resuspension and advection in our study area.
Trawling Activities
Although the CUC may exert a controlling role in the sediment transport in our study area, the turbidity increases observed in the water column at the study site could not be conclusively explained by any single hydrodynamic process operating along the margin off Vancouver Island. This suggests that other potential resuspension mechanisms, aside from these natural processes, may also play an important role causing sediment resuspension and contributing to the formation of the INLs and BNLs in the study area.
Several studies have demonstrated that resuspension caused by bottom trawling can create turbid clouds and persistent nepheloid layers with high suspended sediment concentration, which have been observed mainly on continental shelves (Churchill, 1989; Schoellhamer, 1996; Palanques et al., 2001, 2014; Ferré et al., 2008). In contrast, the occurrence of turbidity increases caused by trawling activities in slope environments has been less investigated. Studies conducted on the NW Mediterranean slope have described that the resuspension created by the trawling gear can be propagated deeper than the trawling grounds (Puig et al., 2012; Martín et al., 2014). These studies were conducted on a submarine canyon flank, which reported the presence of highly concentrated INLs and BNLs generated after the passage of the trawling fleet. Recent studies recorded quasi permanent INLs and near-BNLs near the fishing grounds of the Foix and the Palamós submarine canyons (Catalan margin, NW Mediterranean) during the trawling season (Arjona-Camas et al., 2019, 2021). Other studies carried out in the NE Mediterranean (Chronis et al., 2000) and in the NE Atlantic (Wilson et al., 2015b; Daly et al., 2018) also suggest that trawling activities can be a major mechanism involved in the development and maintenance of high concentrated turbid layers on continental slope regions and submarine canyons.
Bottom trawling activities on the upper slope region off Vancouver Island are considered to be a source of the water turbidity increases recorded by the VPS profiler, considering that the Barkley Canyon node is situated very close to fishing grounds (Figure 1), and that at least three major hit incidents caused substantial damage to the NEPTUNE cabled seafloor observatory. To that effect, an artificial AIS signal from the BUS location is now broadcasted to prevent further collisions of trawlers with the NEPTUNE infrastructure.
Analyses on AIS data revealed that the presence of demersal trawl hauls coincided with periods of increased water turbidity and the presence of INLs and BNLs at the same depths where trawling activities are practiced (Figures 4, 5E). This is particularly evident in late September and late-October, when demersal trawling activity was more intense in the study area (Figures 4e,h and Table 2). During less intense trawling periods, such as mid-October and mid-November (Figures 4g,j and Table 2), high turbidity values were still observed at trawling ground depths (Figure 5E). In contrast, very intense trawling activity during early-November (Figure 4j) did not have any related effect on the water column turbidity and nepheloid layer structure in the study area (Figure 5E). However, these clear waters occurred during southeastward currents (Figure 7B), which could advect the resuspended particles away from the VPS observing site.
These results highlight that local bottom trawling might contribute to enhance water turbidity in the study area at the depths where it is practiced. Nevertheless, to fully understand the water turbidity increases in the study area we must consider a wider context. The presence of continuous fishing activity along the Vancouver Island’s continental slope (Figure 1), combined with the California Current System, results in the quasi-continuous advection of trawling resuspended particles, playing an important role in their transport along the margin via nepheloid layers. The very-frequent increases in the water column turbidity increases recorded at the study site can be the result of trawling resuspension in farther fishing grounds, where the resulting detachments are advected towards the VPS site by the mean flow, reaching it without direct concordance with the local AIS data around our study site (Figure 4), therefore making difficult to constrain the relationship between trawling and sediment resuspension in such a highly dynamic region.
Trawling activities at the Cascadia margin mainly occur at ∼400 m depth targeting groundfish species such as cod, pollock, rockfish (Sebastes spp.), sablefish (Anopoloma fimbria), and thornyheads (Sebastopolus spp.) (Food and Agriculture Organization [FAO], 2019). However, the continuous expansion of trawling activities to deeper regions (Norse et al., 2012; Watson and Morato, 2013) is evident in this margin due to the presence of trawl marks ∼1,100 m depth, further expanding the impacts of bottom trawling to greater depths (Friedlander et al., 1999; De Leo et al., 2017). In an effort to mitigate and abate the impacts of bottom trawling, closure areas have been established (Iriondo et al., 2019). However, sediment resuspension by bottom trawling in areas adjacent to protected areas can still affect them (Linders et al., 2018), which need to be taken into account.
Concluding Remarks
The present study provides a first glimpse into the nepheloid layer distribution on the upper slope region of Vancouver Island, discussing the potential mechanisms contributing to the sediment resuspension and advection on this continental margin. A high-resolution time-series of turbidity profiles illustrate a well-defined turbidity structure consisting of SNLs at <100 m depth related to primary and secondary productivity, INLs between 150 and 300 m depth at the shelf-break and upper slope domain, and deeper INLs and BNLs found at water depths down to 400 m depth.
The high number of AIS signals observed over the study area during the ∼4-month observational period, and the lack of a clear correspondence of turbidity increases with natural processes and events, suggests that trawling resuspension contributes to increasing suspended particle concentrations in the water column. AIS data reveal that the depths of the observed nepheloid layers coincide with the operating depths of trawlers. The presence of local demersal trawling at certain times when intermediate and bottom particulate matter detachments are observed, highlights the role of bottom trawling in enhancing water turbidity at the study site. The presence of pervasive fishing grounds along the Vancouver Island’s continental slope and further south, combined with the NW currents of the California Current results in the quasi-continuous advection of resuspended particles by trawling, playing a major role in their transport along the margin as nepheloid layers.
Data Availability Statement
The raw data supporting the conclusions of this article will be made available by the authors, without undue reservation. Data from all the instruments are archived and publicly available online in near-real time via ONC’s Oceans 2.0 Data Management System (https://data.oceannetworks.ca/DataSearch).
Author Contributions
MA-C: methodology, software, data analyses and curation, formal analysis, and writing the manuscript. PP: methodology, conceptualization, funding acquisition, reviewing and editing, and supervision. FD: methodology, conceptualization, and reviewing and editing. GG: methodology, software, and data analyses and curation. SP: methodology, software, data analyses and curation, and reviewing and editing. RD: visualization, and reviewing and editing. AP: funding acquisition, reviewing and editing, and supervision. All authors contributed to the article and approved the submitted version.
Funding
This work was supported by the ABIDES (CTM2015-65142) Spanish Project and by the Autonomous Government of Catalonia Grants 2017 SGR 863 and 2017 SGR 1241, as well as by the TrawledSeas Project receiving funding from the European Union’s Horizon 2020 Research and Innovation programme under a MSCA grant agreement (No. 867471). MA-C was supported by a predoctoral F. P. I. grant (BES-2016-076983) from the Spanish Ministry of Economy, Industry and Competitiveness. This work is contributing to ICM’s “Center of Excellence” Severo Ochoa (CEX2019-000928-S). Ocean Networks Canada was funded through Canada Foundation for Innovation-Major Science Initiative (CFI-MSI) fund 30199.
Conflict of Interest
The authors declare that the research was conducted in the absence of any commercial or financial relationships that could be construed as a potential conflict of interest.
Publisher’s Note
All claims expressed in this article are solely those of the authors and do not necessarily represent those of their affiliated organizations, or those of the publisher, the editors and the reviewers. Any product that may be evaluated in this article, or claim that may be made by its manufacturer, is not guaranteed or endorsed by the publisher.
Acknowledgments
We are thankful for the support from ONC’s marine and digital operations staff for servicing and maintaining the VPS system, and for the curation and quality control of all oceanographic data streams used in this study. We also thank Fisheries and Oceans Canada (DFO) and the Institute of Ocean Sciences (IOS) in Sidney, British Columbia, Canada, for the publicly and freely available data from the long-term Line P monitoring program.
Supplementary Material
The Supplementary Material for this article can be found online at: https://www.frontiersin.org/articles/10.3389/fmars.2021.770280/full#supplementary-material
Supplementary Figure 1 | Speed over ground (SOG) histogram and fitting of the multi-modal distribution through the EM-algorithm for all trawling vessels, using AIS signals from August to November 2018. The first distribution (green line) is hypothesized to be associated with fishing gear retrieval or non-power drifting. The second distribution (red line) is associated with trawling activity, and the third distribution (blue line) is associated with traveling speeds. The black dashed line indicates the upper and lower limits used to classify vessels as trawling. Inset table includes, for each distribution: mean speed over ground (SOG) in knots and the corresponding standard deviation. For interpretation of the references to color in this figure legend, the reader is referred to the web version of this article.
Supplementary Figure 2 | Scatter plots of buoy (Juan de Fuca Buoy) vs. model (NOAA WW3) meteorological (wave and wind) data. Linear regression plots for wave parameters are shown in panels (A–C), corresponding to significant wave height (Hs), primary wave mean period (Tp), and mean wave direction (θ), respectively. Linear regression plots for wind parameters are shown in panels (D,E), which correspond to wind speed and wind direction, respectively. Linear regression statistics (slope and R2 correlation coefficient) are given for wave and wind parameters.
Supplementary Figure 3 | TS diagram for all the CTD casts sampled with the Vertical Profiling System (VPS) during the study period, spanning from the 14th of August to the 23rd of November 2018, identifying the different water masses present in the study area: Pacific Subarctic Upper Water (PSUW), Eastern North Pacific Transition Water (ENPTW), and Pacific Subarctic Intermediate Water (PSIW) (data plotted using Ocean Data View 4.7.10; http://odv.awi.de; Schlitzer, 2010). For interpretation of the references to color in this figure legend, the reader is referred to the web version of this article.
Footnotes
- ^ www.neptunecanada.ca
- ^ www.oceannetworks.ca
- ^ https://data.oceannetworks.ca/DataSearch
- ^ http://www.waterproperties.ca/linep/
- ^ https://www.ndbc.noaa.gov/
- ^ http://www.siitech.com
References
Antoine, D., André, J. M., and Morel, A. (1996). Oceanic primary production: 2. Estimation at global scale from satellite (coastal zone color scanner) chlorophyll. Global Biogem. Cycles 10, 57–69. doi: 10.1029/95gb02832
Ardron, J. A., Jamieson, G. S., and Hangaard, D. (2007). Spatial identification of closures to reduce the bycatch of corals and sponges in the groundfish trawl fishery, British Columbia. Can. Bull. Mar. Sci. 81, 157–167.
Arjona-Camas, M., Puig, P., Palanques, A., Durán, R., White, M., Paradis, S., et al. (2021). Natural vs. trawling-induced water turbidity and suspended sediment transport variability within the Palamós Canyon (NW Mediterranean). Mar. Geophys. Res. 42:38.
Arjona-Camas, M., Puig, P., Palanques, A., Emelianov, M., and Durán, R. (2019). Evidence of trawling-induced resuspension events in the generation of nepheloid layers in the Foix submarine canyon (NW Mediterranean). J. Mar. Syst. 196, 86–96. doi: 10.1016/j.jmarsys.2019.05.003
Baker, E. T., and Hickey, B. M. (1986). Contemporary sedimentation processes in and around an active west coast submarine canyon. Mar. Geol. 71, 15–34.
Barber, F. G. (1957). Observations of currents north of Triangle Island, BC. Fish. Res. Board. Can. Prog. Rep. Pac. Coast. Station 108, 15–38.
Barnes, C. R., Best, M. M., Pautet, L., and Pirenne, B. (2011). Understanding earth-ocean processes using real-time data from NEPTUNE, Canada’s widely distributed sensor networks, Northeast Pacific. Geosci. Can. 38, 21–30.
Barrie, J. V., Conway, K. W., Picard, K., and Greene, H. G. (2009). Large-scale sedimentary bedforms and sediment dynamics on a glaciated tectonic continental shelf: examples from the Pacific margin of Canada. Cont. Shelf Res. 29, 796–806. doi: 10.1016/j.csr.2008.12.007
Battisti, D., and Hickey, B. M. (1984). Application of remote wind-forced coastal trapped wave theory to the Oregon and Washington coasts. J. Phys. Oceanogr. 14, 887–903.
Blair, N. E., and Aller, R. C. (2012). The fate of terrestrial organic carbon in the marine environment. Annu. Rev. Mar. Sci. 4, 401–423. doi: 10.1146/annurev-marine-120709-142717
Bornhold, B. D., and Barrie, J. V. (1991). Surficial sediments on the western Canadian continental shelf. Cont. Shelf Res. 11, 685–699. doi: 10.1016/0278-4343(91)90074-g
Bornhold, B. D., and Yorath, C. J. (1984). Surficial geology of the continental shelf, northwestern Vancouver Island. Mar. Geol. 57, 89–112.
Boyd, P. W., Harrison, P. J., and Johnson, B. D. (1999). The joint global ocean flux study (Canada) in the NW subarctic Pacific. Deep Sea Res. II Top. Stud. Oceanogr. 46, 2345–2350. doi: 10.1016/s0967-0645(99)00066-1
Broecker, W. S., and Takashi, T. (1985). Sources and flow patterns of deep-ocean waters as deduced from potential temperature, salinity and initial phosphate concentration. J. Geophys. Res. 90, 6925–6939. doi: 10.1029/jc090ic04p06925
Cacchione, D. A., and Drake, D. E. (1986). Nepheloid layers and internal waves over continental shelves and slopes. Geo Mar. Lett. 6, 147–152. doi: 10.1007/bf02238085
Cacchione, D. A., Wiberg, P. L., Lynch, J., Irish, J., and Traykovski, P. (1999). Estimates of suspended-sediment flux and bedform activity on the inner portion of the Eel continental shelf. Mar. Geol. 154, 83–97. doi: 10.1016/s0025-3227(98)00105-4
Canals, M., Companys, J. B., Martín, D., Sanchez-Vidal, A., and Ramirez-Llodra, E. (2013). Integrated study of Mediterranean deep canyons: novel results and future challenges. Prog. Oceanogr. 118, 1–27. doi: 10.1016/j.pocean.2013.09.004
Cannolly, T. P., and Hickey, B. M. (2014). Regional impact of submarine canyons during seasonal upwelling. J. Geophys. Res. Oceans 119, 953–975. doi: 10.1002/2013jc009452
Carson, B., Baker, E. T., Hickey, B. M., Nittrouer, C. A., DeMaster, D. J., Thorbjarnarson, K. W., et al. (1986). Modern sediment dispersal and accumulation in Quinault submarine canyon – a summary. Mar. Geol. 71, 1–13. doi: 10.1016/0025-3227(86)90030-7
Chase, Z., van Geen, A., Kosro, P. M., Marra, J., and Wheeler, P. A. (2002). Iron nutrient and phytoplankton distributions in Oregon coastal waters. J. Geophys. Res. 107, 3174.
Checkley, D. M., and Barth, J. A. (2009). Patterns and processes in the California current system. Prog. Oceanogr. 83, 49–64. doi: 10.1016/j.pocean.2009.07.028
Chronis, G., Lykousis, V., Georgopoulos, D., Zervakis, V., Stavrakakis, S., and Poulos, S. (2000). Suspended particulate matter and nepheloid layers over the southern margin of the Cretan Sea (NE Mediterranean): seasonal distribution and dynamics. Prog. Oceanogr. 46, 163–185. doi: 10.1016/s0079-6611(00)00017-3
Churchill, J. H. (1989). The effect of commercial trawling on sediment resuspension transport over the Middle Atlantic Bight continental shelf. Cont. Shelf. Res. 9, 841–864. doi: 10.1016/0278-4343(89)90016-2
Cosma, T., and Hendy, I. L. (2008). Pleistocene glacimarine sedimentation on the continental slope off Vancouver Island, British Columbia. Mar. Geol. 255, 45–54. doi: 10.1016/j.margeo.2008.07.001
Crawford, W. R., and Dewey, R. K. (1989). Turbulence and mixing: sources of nutrients on the Vancouver Island continental shelf. Atmos. Ocean 27, 428–442. doi: 10.1080/07055900.1989.9649345
Crawford, W. R., and Thomson, R. E. (1982). Continental shelf waves of diurnal period along Vancouver Island. J. Geophys. Res. Oceans 87, 9516–9522. doi: 10.1029/jc087ic12p09516
Crawford, W. R., and Thomson, R. E. (1991). Physical oceanography of the western Canadian continental shelf. Cont. Shelf Res. 11, 669–683. doi: 10.1016/0278-4343(91)90073-f
Crawford, W. R., Rapatz, W. J., and Huggett, W. S. (1981). Pressure and temperature measurements on seamounts in the North Pacific. Mar. Geol. 5, 43–54. doi: 10.1080/15210608109379404
Daly, E., Johnson, M. P., Wilson, A. M., Gerritsen, H. D., Kiriakoulakis, K., Allcock, A. L., et al. (2018). Bottom trawling at Whittard Canyon: evidence for seabed modification, trawl plumes and food source heterogeneity. Prog. Oceanogr. 169, 227–240. doi: 10.1016/j.pocean.2017.12.010
De Leo, F. C., Gauthier, M., Nephin, J., Mihaly, S., and Juniper, S. K. (2017). Bottom trawling and oxygen minimum zone influences on continental slope benthic community structure off Vancouver Island (NE Pacific). Deep Sea Res. II. Top. Stud. Oceanogr. 137, 404–419. doi: 10.1016/j.dsr2.2016.11.014
De Leo, F. C., Ogata, B., Sastri, A. R., Heesemann, M., Mihaly, S., Galbraith, M., et al. (2018). High-frequency observations from a Deep-sea cabled observatory reveal seasonal overwintering of Neocalanus spp. in Barkley Canyon, NE Pacific: insights into particulate organic carbon flux. Progr. Oceanogr. 169, 120–137. doi: 10.1016/j.pocean.2018.06.001
Dellapenna, T. M., Allison, M. A., Gill, G. A., Lehman, R. D., and Warnken, K. W. (2006). The impact of shrimp trawling and associated sediment resuspension in mud dominated, shallow estuaries. Estuar. Coast. Shelf Sci. 69, 519–530. doi: 10.1016/j.ecss.2006.04.024
Dempster, A. P., Laird, N. M., and Rubin, D. B. (1977). Maximum likelihood from incomplete data via the EM algorithm. J. R. Stat. Soc. Ser. B 39, 1–38.
Department of Fisheries and Oceans Canada [DFO] (2019). Commercial Fisheries Licensing Rules and Policies Reference Document Pacific Region. Available online at: http://www.pac.dfo-mpo.gc.ca/ (accessed July 2021).
Dickson, R. R., and McCave, I. N. (1986). Nepheloid layers on the continental slope west of Porcupine Bank. Deep Sea Res. I Oceanogr. Res. Pap. 33, 791–818. doi: 10.1016/0198-0149(86)90089-0
Doya, C., Aguzzi, J., Pardo, M., Matabos, M., Company, J. B., Costa, C., et al. (2014). Diel behavioral rythms in sablefish (Anoplopma fimbria) and other benthic species, as recorded by the Deep-sea cabled observatories in Barkley Canyon (NEPTUNE-Canada). J. Mar. Sys. 130, 69–78.
Drakopoulos, P. G., and Marsden, R. F. (1993). The internal tide off the west coast of Vancouver Island. J. Phys. Oceanogr. 23, 758–775. doi: 10.1175/1520-0485(1993)023<0758:titotw>2.0.co;2
Emery, W. J., and Meincke, J. (1986). Global water masses-summary and review. Oceanol. Acta 9, 383–391.
Ferré, B., Durrieu de Madron, X., Estournel, C., Ulses, C., and Le Corre, G. (2008). Impact of natural (waves and currents) and anthropogenic (trawl) resuspension on the export of particulate matter to the open ocean: application to the Gulf of Lion (NW Mediterranean). Cont. Shelf Res. 28, 2071–2091. doi: 10.1016/j.csr.2008.02.002
Finney, J. L. (2009). Overlap of Predicted Cold-Water Coral Habitat and Bottom-Contact Fisheries in British Columbia. Doctoral dissertation. Burnaby, BC: School of Resource and Environmental Management-Simon Fraser University.
Food and Agriculture Organization [FAO] (2019). Food and Agriculture Organization of the United Nations. FAO Major Fishing Areas. Northeast Pacific (Major Fishing Area 67). Available online at: http://www.fao.org/fishery/area/Area67/en (accessed July 2021).
Friedlander, A. M., Boehlert, G. W., Field, M. E., Mason, J. E., Gardner, J. V., and Dartnell, P. (1999). Sidescan-sonar mapping of benthic trawl marks on the shelf and slope off Eureka, California. Fish. Bull. 97, 786–801.
Gardner, W. D. (1989). Periodic resuspension in Baltimore Canyon by focusing of internal waves. J. Geophys. Res. Oceans 94, 18185–18194. doi: 10.1029/jc094ic12p18185
Gardner, W. D., Richardson, M. J., Mishonov, A. V., and Biscaye, P. E. (2018). Global comparison of benthic nepheloid layers based on 52 years of nephelometer and transmissometer measurements. Prog. Oceanogr. 168, 100–111. doi: 10.1016/j.pocean.2018.09.008
Gardner, W. D., Walsh, I. D., and Richardson, M. J. (1993). Biophysical forcing of particle production and distribution during a spring bloom in the North Atlantic. Deep-Sea Res. II 40, 171–195. doi: 10.1016/0967-0645(93)90012-c
Haigh, R., and Schnute, J. T. (2003). The longspine thornyhead fishery along the west coast of Vancouver Island, British Columbia, Canada: portrait of a developing fishery. N. Am. J. Fish. Manage. 23, 120–140. doi: 10.1577/1548-8675(2003)023<0120:tltfat>2.0.co;2
Hall, R. A., Aslam, T., and Huvenne, V. A. (2017). Partly standing internal tides in a dendritic submarine canyon by an ocean glider. Deep Sea Res. Part I Oceanogr. Res. Pap. 126, 73–84. doi: 10.1016/j.dsr.2017.05.015
Harris, P. T., Macmillan-Lawler, M., Rupp, J., and Baker, E. K. (2014a). Geomorphology of the oceans. Mar. Geol. 352, 4–24. doi: 10.1098/rsta.2012.0395
Harris, P. T., Barrie, J. V., Conway, K. W., and Greene, H. G. (2014b). Hanging canyons of Haida Gwaii, British Columbia, Canada: fault-control on submarine canyon geomorphology along active continental margins. Deep Sea Res. II Top. Stud. Oceanogr. 104, 83–92. doi: 10.1016/j.dsr2.2013.06.017
Hartley, H. O. (1958). Maximum likelihood estimation from incomplete data. Biometrics 14, 174–194. doi: 10.2307/2527783
Hickey, B. M. (1979). The California current system – hypotheses and facts. Prog. Oceanogr. 8, 191–279. doi: 10.1016/0079-6611(79)90002-8
Hickey, B. M., and Banas, N. S. (2008). Why is the northern end of the California current so productive? Oceanography 21, 90–107. doi: 10.5670/oceanog.2008.07
Hickey, B., Baker, E., and Kachel, N. (1986). Suspended particle movement in and around Quinault submarine canyon. Mar. Geol. 71, 35–83. doi: 10.1016/0025-3227(86)90032-0
Hollowed, A. B. (1992). Spatial and temporal distributions of Pacific hake, Merluccius productus, larvae and estimates of survival during early life stages. Calif. Coop. Ocean. Fish. Invest. Rep 33, 100–123.
Inthorn, M., Mohrholz, V., and Zabel, M. (2006). Nepheloid layer distribution in the Benguela upwelling area offshore Namibia. Deep Sea Res. I Oceanogr. Res. Pap. 53, 1423–1438. doi: 10.1016/j.dsr.2006.06.004
Iriondo, A., Santiago, J., Murua, H., Granado, I., Taconet, M., Kroodsma, D., et al. (2019). “FAO Area 67 – AIS-based fishing activity in the Northeast Pacific,” in Global Atlas of AIS-Based Fishing Activity – Changes and Opportunities, eds M. Taconet, D. Kroodsma, and J. A. Fernandes (Rome: FAO).
Juniper, S. K., Matabos, M., Mihaly, S., Ajayamohan, R. S., Gervais, F., and Bui, A. O. (2013). A year in Barkley Canyon: a time-series observatory study of mid-slope benthos and habitat dynamics using the NEPTUNE Canada network. Deep Sea Res. II Top. Stud. Oceanogr. 92, 114–123. doi: 10.1016/j.dsr2.2013.03.038
Kulka, D. W., and Pitcher, D. A. (2001). Spatial and Temporal Patterns in Trawling Activity in the Canadian Atlantic and Pacific. St. John’s, NL: Fisheries and Oceans Canada.
Kwon, E. Y., DeVries, T., Galbraith, E. D., Hwang, J., Kim, G., and Timmermann, A. (2021). Stable carbon isotopes suggest large terrestrial carbon inputs to the global ocean. Global Biogeochem. Cycles 35:e2020GB006684.
Levin, L. A., and Sibuet, M. (2012). Understanding continental margin biodiversity: a new imperative. Annu. Rev. Mar. Sci. 4, 79–112. doi: 10.1146/annurev-marine-120709-142714
Linders, T., Nilsson, P., Wikström, A., and Sköld, M. (2018). Distribution and fate of trawling-induced suspension of sediments in a marine protected area. ICES J. Mar. Sci. 75, 785–795. doi: 10.1093/icesjms/fsx196
Liu, Z., Zhao, Y., Colin, C., Stattegger, K., Wiesner, M. G., Huh, C.-A., et al. (2016). Source-to-sink transport processes of fluvial sediments in the South China Sea. Earth Sci. Rev. 153, 238–273. doi: 10.1016/j.earscirev.2015.08.005
Lluch-Belda, D., Laurs, R. M., Lluch-Cota, D. B., and Lluch-Cota, S. E. (2001). Long-term trends of interannual variability in the California Current System. Calif. Coop. Ocean. Fish. 14, 458–467.
Lluch-Belda, D., Lluch-Cota, D. B., and Lluch-Cota, S. E. (2003). Scales of interanual variability in the California Current System: associated physical mechanisms and likely ecological impacts. Calif. Coop. Ocean. Fish. 44, 76–85.
Lorenzoni, L., Thunell, R., Benitez-Nelson, C. R., Hollander, D., Martinez, N., Tappa, E., et al. (2009). The importance of subsurface nepheloid layers in transport and delivery of sediments to eastern Cariaco Basin, Venezuela. Deep Sea Res. I. Oceanogr. Res. Pap. 56, 2249–2262. doi: 10.1016/j.dsr.2009.08.001
Lynn, R. J., and Simpson, J. J. (1987). The California current system: the seasonal variability of its physical characteristics. J. Geophys. Res. Oceans 92, 12947–12966. doi: 10.1029/jc092ic12p12947
Mackas, D. L. (1992). Seasonal cycle of zooplankton off southwestern British Columbia. Can. J. Fish. Aquat. Sci. 49, 903–921. doi: 10.1139/f92-101
Mackas, D. L., Goldblatt, R., and Lewis, A. L. (1998). Interdecadal variation in developmental timing of Neocalanus plumchrus populations at ocean station P in the subarctic North Pacific. Can. J. Fish. Aquat. Sci. 55, 1878–1893. doi: 10.1139/f98-080
Mackas, D. L., Kieser, R., Saunders, M., Yelland, D. R., Brown, R. M., and Moore, D. F. (1997). Aggregation of euphausiids and Pacific hake (Merluccius productus) along the outer continental shelf off Vancouver Island. Can. J. Fish. Aquat. Sci. 54, 2080–2096. doi: 10.1139/cjfas-54-9-2080
Martín, J., Puig, P., Palanques, A., and Ribo, M. (2014). Trawling-induced daily sediment resuspension in the flank of a Mediterranean submarine canyon. Deep Sea Res. II Top. Stud. Oceanogr. 104, 174–183. doi: 10.1016/j.dsr2.2013.05.036
Matabos, M., Bui, A. O., Mihaly, S., Aguzzi, J., Juniper, S. K., and Ajayamohan, R. S. (2014). High-frequency study of epibenthic megafaunal community dynamics in Barkley Canyon: a multi-disciplinary approach using the NEPTUNE Canada network. J. Mar. Sys. 130, 56–68. doi: 10.1016/j.jmarsys.2013.05.002
McCave, I. N. (1986). Local and global aspects of the bottom nepheloid layers in the world ocean. J. Sea Res. 20, 167–181. doi: 10.1016/0077-7579(86)90040-2
McPhee-Shaw, E. (2006). Boundary-interior exchange: reviewing the idea that internal-wave mizing enhances lateral dispersal near continental margins. Deep Sea Res. II Top. Stud. Oceanogr. 53, 42–59. doi: 10.1016/j.dsr2.2005.10.018
McPhee-Shaw, E. E., Sternberg, R. W., Mullenbach, B., and Ogston, A. S. (2004). Observations of intermediate nepheloid layers on the northern California continental margin. Cont. Shelf Res. 24, 693–720. doi: 10.1016/j.csr.2004.01.004
Mengual, B., Cayocca, F., Le Hir, P., Draye, R., Laffargue, P., Vincent, B., et al. (2016). Influence of bottom trawling on sediment resuspension in the ‘Grande-Vasière’ area (Bay of Biscay. France). Ocean Dyn. 66, 1181–1207. doi: 10.1007/s10236-016-0974-7
Miller, C. B., Frost, B. W., Batchelder, H. P., Clemons, M. J., and Conway, R. E. (1984). Life histories of large, grazing copepods in a subarctic ocean gyre: Neocalanus plumchrus, Neocalanus cristatus, and Euclanus bungii in the Northeast Pacific. Prog. Oceanogr. 13, 201–243.
Milliman, J. D., and Farnsworth, K. L. (2013). River Discharge to the Coastal Ocean: A Global Synthesis. Cambridge: Cambridge University Press.
Munk, W., Snodgrass, F., and Wirebush, M. (1970). Tides offshore: transition from California coastal to deep-sea water. Geophys. Fluid Dyn. 1, 161–235. doi: 10.1080/03091927009365772
Natale, F., Gibin, M., Alessandrini, A., Vespe, M., and Paulrud, A. (2015). Mapping fishing effort through AIS data. PLoS One 10:e0130746. doi: 10.1371/journal.pone.0130746
Norse, E. A., Brooke, S., Cheung, W. W. L., Clark, M. R., Ekeland, I., Froese, R., et al. (2012). Sustainability of deep-sea fisheries. Mar. Policy 36, 307–320.
Oberle, F. K. J., Storlazzi, C. D., and Hanebuth, T. J. J. (2016). What a drag: quantifying the global impact of chronic bottom trawling on continental shelf sediment. J. Mar. Syst. 159, 109–119. doi: 10.1016/j.jmarsys.2015.12.007
Oliveira, A., Vitorino, J., Rodrigues, A., Jouanneau, J. M., Días, J. A., and Weber, O. (2002). Nepheloid layer dynamics in the northern Portuguese shelf. Prog. Oceanogr. 52, 195–213.
Palanques, A., and Biscaye, P. E. (1992). Patterns and controls of the suspended matter distribution over the shelf and upper slope south of New England. Cont. Shelf. Res. 12, 577–600.
Palanques, A., Guillén, J., and Puig, P. (2001). Impact of bottom trawling on water turbidity and muddy sediment of an unfished continental shelf. Limnol. Oceanogr. 46, 1100–1110.
Palanques, A., Guillén, J., Puig, P., and Durrieu de Madron, X. (2008). Storm-driven shelf-to canyon suspended sediment transport at the southwestern Gulf of Lions. Cont. Shelf Res. 28, 1947–1956. doi: 10.1016/j.csr.2008.03.020
Palanques, A., Martín, J., Puig, P., Guillén, J., Company, J. B., and Sardà, F. (2006). Evidence of sediment gravity flows induced by trawling in the Palamós (Fonera) submarine canyon (northwestern Mediterranean). Deep Sea Res. I Oceanogr. Res. Pap. 53, 201–214. doi: 10.1016/j.dsr.2005.10.003
Palanques, A., Puig, P., Guillén, J., Demestre, M., and Martín, J. (2014). Effects of bottom trawling on the Ebro continental shelf sedimentary system (NW Mediterranean). Cont. Shelf Res. 72, 83–98. doi: 10.1016/j.csr.2013.10.008
Paradis, S., Goñi, M., Masqué, P., Durán, R., Arjona-Camas, M., Palanques, A., et al. (2021). Persistence of biogeochemical alterations of deep-sea sediments by bottom trawling. Geophys. Res. Lett. 48:e2020GL091279.
Pierce, S. D., Smith, R. L., Kosro, P. M., Barth, J. A., and Wilson, C. D. (2000). Continuity of the poleward undercurrent along the eastern boundary of the mid-latitude north Pacific. Deep Sea Res. II Top. Stud. Oceanogr. 47, 811–829. doi: 10.1016/s0967-0645(99)00128-9
Puig, P., and Palanques, A. (1998). Nepheloid structure and hydrographic control on the Barcelona continental margin, northwestern Mediterranean. Mar. Geol. 149, 39–54.
Puig, P., Canals, M., Martín, J., Amblas, D., Lastras, G., Palanques, A., et al. (2012). Ploughing the deep-sea floor. Nature 489:286. doi: 10.1038/nature11410
Puig, P., Ogston, A. S., Mullenbach, B. L., Nittrouer, C. A., and Sternberg, R. W. (2003). Shelf-to canyon sediment-transport processes on the Eel continental margin (northern California). Mar. Geol. 193, 129–149.
Puig, P., Palanques, A., and Martín, J. (2014). Contemporary sediment-transport processes in Submarine Canyons. Ann. Rev. Mar. Sci. 6, 53–77. doi: 10.1146/annurev-marine-010213-135037
Puig, P., Palanques, A., Guillén, J., and El Khatab, M. (2004). Role of internal waves in the generation of nepheloid layers on the northwestern Alboran slope: implications for continental margin shaping. J. Geophys. Res. Oceans 109:C9011.
Puig, P., Sardà, F., and Palanques, A. (2001). Responses of deep-water shrimp populations to intermediate nepheloid layer detachments on the Northwestern Mediterranean continental margin. Deep Sea Res. I Oceanogr. Res. Pap. 48, 2195–2207.
Quaresma, L. S., Vitorino, J., Oliveira, A., and da Silva, J. (2007). Evidence of sediment resuspension by nonlinear internal wave son the western Portuguese mid-shelf. Mar. Geol. 246, 123–143. doi: 10.1016/j.margeo.2007.04.019
Robert, K., and Juniper, S. K. (2012). Surface-sediment bioturbation quantified with cameras on the NEPTUNE Canada cabled observatory. Mar. Ecol. Prog. Ser. 453, 137–149.
Saldívar-Lucio, R., Di Lorenzo, E., Nakamura, M., Villalobos, H., Lluch-Cota, D., and Del Monte-Luna, P. (2016). Macro-scale patterns in upwelling/downwelling activity at North American West Coast. PLoS One 11:e0166962. doi: 10.1371/journal.pone.0166962
Schlitzer, R. (2010). ). Ocean Data View. Available online at: http://odv.awi.de (accessed November 19, 2021).
Schoellhamer, D. H. (1996). Anthropogenic sediment resuspension mechanisms in a shallow microtidal estuary. Estuar. Coast. Mar. Sci. 43, 533–548. doi: 10.1006/ecss.1996.0086
Simard, Y., and Mackas, D. K. (1989). Mesoscale aggregations of euphausiid sound scattering layers on the continental shelf Seabirds off Vancouver Island. BC. Can. J. Fish. Aquat. Sci. 46:83.
Sinclair, A. (2007). Trends in Groundfish Bottom Trawl Fishing Activity in BC. Research Document 006. Nanaimo, BC: Fisheries and Oceans Canada Pacific Biological Station, 22.
Smith, S. J., and Friedrichs, C. T. (2011). Size and settling velocities of cohesive flocs and suspended sediment aggregates in a trailing suction hopper dredge plume. Cont. Shelf Res. 31, 50–63.
Solomon, O. M., Larson, D. R., and Paulter, N. G. (2001). “Comparison of some algorithms to estimate the low and high state level of pulses. In IMTC 2001,” in Proceedings of the 18th IEEE Instrumentation and Measurement Technology Conference. Rediscovering Measurement in the Age of Informatics (Cat. No. 01CH 37188), Vol. 1, (Budapest: IEEE), 96–101.
Sternberg, R. W., and Larsen, L. H. (1975). Threshold of sediment movement by open ocean waves: observations. Deep Sea Res. Oceanogr. Abstr. 22, 299–309. doi: 10.1016/0011-7471(75)90071-6
Thomsen, L., Aguzzi, J., Costa, F. C., De Leo, F. C., Ogston, A., and Purser, A. (2017). The oceanic biological pump: rapid carbon transfer to depth at continental margins during winter. Sci. Rep. 7:10763. doi: 10.1038/s41598-017-11075-6
Thomsen, L., Barnes, C., Best, M., Chapman, R., Pirenne, B., Thomson, R., et al. (2012). Ocean circulation promotes methane release from gas hydrate outcrops at the NEPTUNE Canada Barkley Canyon node. Geophys. Res. Lett. 39:L16605.
Thorbjarnarson, K. W., Nittrouer, C. A., and DeMaster, D. J. (1986). Accumulation of modern sediment in Quinault submarine canyon. Mar. Geol. 71, 107–124. doi: 10.1016/0025-3227(86)90034-4
Venello, T. A., Sastri, A. R., Galbraith, M. D., and Dower, J. F. (2021). Zooplankton functional group responses to environmental drivers off the west coast of Vancouver Island, Canada. Prog. Oceanogr. 190:102482.
Walsh, J. P., and Nittrouer, C. A. (1999). Observations of sediment flux to the Eel continental slope, northern California. Mar. Geol. 154, 55–68. doi: 10.1016/s0025-3227(98)00103-0
Walsh, J. P., and Nittrouer, C. A. (2009). Understanding fine-grained river-sediment dispersal on continental margins. Mar. Geol. 263, 34–45. doi: 10.1016/j.margeo.2009.03.016
Watson, R. A., and Morato, T. (2013). Fishing down the deep: accounting for within-species changes in depth of fishing. Fish. Res. 140, 63–65. doi: 10.1016/j.fishres.2012.12.004
Whitney, F. A., Freeland, H. J., and Robert, M. (2007). Persistently declining oxygen levels in the interior waters of the eastern subarctic Pacific. Prog. Oceanogr. 75, 179–199. doi: 10.1016/j.pocean.2007.08.007
Wilson, A. M., Raine, R., Mohn, C., and White, M. (2015a). Nepheloid layer distribution in the Whittard Canyon, NE Atlantic margin. Mar. Geol. 367, 130–142. doi: 10.1016/j.margeo.2015.06.002
Wilson, A. M., Kiriakoulakis, K., Raine, R., Gerritsen, H. D., Blackbird, S., Allcock, A. L., et al. (2015b). Anthropogenic influence on sediment transport in the Whittard Canyon, NE Atlantic. Mar. Pollut. 101, 320–329. doi: 10.1016/j.marpolbul.2015.10.067
Keywords: Vancouver Island, NE Pacific, upper continental slope, NEPTUNE cabled observatory, nepheloid structure, bottom trawling, sediment transport
Citation: Arjona-Camas M, Puig P, De Leo FC, Garner G, Paradis S, Durán R and Palanques A (2022) Influence of Natural Processes and Bottom Trawling in the Nepheloid Layer Structure Off Vancouver Island (British Columbia, Canada, NE Pacific). Front. Mar. Sci. 8:770280. doi: 10.3389/fmars.2021.770280
Received: 03 September 2021; Accepted: 27 December 2021;
Published: 28 January 2022.
Edited by:
Yanwu Zhang, Monterey Bay Aquarium Research Institute (MBARI), United StatesReviewed by:
Mairi M. R. Best, Consultant, Sudbury, ON, CanadaThomas Marcellin Grothues, Rutgers, The State University of New Jersey, United States
Kurt Rosenberger, United States Geological Survey (USGS), United States
Copyright © 2022 Arjona-Camas, Puig, De Leo, Garner, Paradis, Durán and Palanques. This is an open-access article distributed under the terms of the Creative Commons Attribution License (CC BY). The use, distribution or reproduction in other forums is permitted, provided the original author(s) and the copyright owner(s) are credited and that the original publication in this journal is cited, in accordance with accepted academic practice. No use, distribution or reproduction is permitted which does not comply with these terms.
*Correspondence: Marta Arjona-Camas, marjona@icm.csic.es