Innovative Real-Time Observing Capabilities for Remote Coastal Regions
 Carol Janzen1*
  Molly McCammon1
  Thomas Weingartner2 Hank Statscewich2 Peter Winsor3
  Seth Danielson2 Rebecca Heim4
- 1Alaska Ocean Observing System, Anchorage, AK, United States
- 2College of Fisheries and Ocean Sciences, University of Alaska, Fairbanks, AK, United States
- 3World Wild Life Fund, Ontario, CA, Canada
- 4National Oceanic and Atmospheric Administration – National Weather Service, Anchorage, AK, United States
Remote regions across Alaska are challenging environments for obtaining real-time, operational observations due to lack of power, easy road access, and robust communications. The Alaska Ocean Observing System partners with government agencies, universities, tribes and industry to evaluate innovative observing technologies, infrastructure and applications that address these challenges. These approaches support acquisition of ocean observing data necessary for forecasting and reporting conditions for safe navigation and response to emergencies and coastal hazards. Three applications are now delivering real-time surface current, sea ice, and water level data in areas not possible a mere 10 years ago. One particular challenge in Alaska is providing robust alternative power solutions for shore-based observing. Remote power options have been evolving alongside resilient technologies and are being designed for freeze-up conditions, making it possible to keep remotely deployed operational systems running and easy to maintain year-round. In this paper, three remote observing approaches are reviewed, including use of off-grid power to operate high-frequency (HF) radars for measuring surface currents, a real-time ice detection buoy that remains deployed throughout the freeze-up cycle, and a high-quality water level observing alternative to NOAA’s National Water Level Observing Network (NWLON) installations. These efforts are highly collaborative and require working partnerships and combined funding from other interested groups to make them a reality. Though they respond to Alaska’s needs including Arctic observing, these approaches also have broader applications to other remote coastal regions.
Introduction
Alaska has been experiencing dramatic changes in the past decade, especially in the Arctic. March 2015 and 2016 Arctic sea ice extents set new record lows in the winter sea ice extent maximum for the entire satellite record starting in 1979 (Viñas, 2016; NASA, 2016). December 2017 continued this trend and experienced the second lowest ice extent in the satellite record (NSIDC, 2018; Walsh, 2018). Later freeze-up dates in the fall and earlier break-up dates in the spring are occurring for both the Bering Strait and Chukchi Sea regions (Mahoney et al., 2014; Johnson and Eicken, 2016; DeMarban, 2018a,b; Samenow, 2018). Sea ice coverage has decreased to the point that existing northern shipping lanes around the world are open for longer periods of time (Masters, 2013) and are projected to experience a continued increase in marine vessel traffic (Arctic Council, 2009). This heightens the likelihood of ship groundings and the potential for oil spills in the region (Roelevan et al., 1995; Merrick et al., 2002). Already, the United States and nations including Russia, China, Korea, and Japan are eyeing increased access and use of this new Arctic Marine Highway for shipping, offshore oil, gas and mining activities, and fishing (Arctic Council, 2009; Zysk, 2014; Pan and Huntington, 2016; Tonami, 2016; Quillérou et al., 2017). To this end, the United States Arctic, comprised of the Beaufort, Chukchi and Bering Seas, needs a robust marine and coastal observing infrastructure providing real-time maritime observations to support national interests in this region, including navigation safety, hazard risk planning, and incident response (U.S. Navy Dept, 2009; U.S. Coast Guard, 2013). However, to date, the United States Arctic has been significantly under-observed, especially compared to other United States coasts.
Alaska is a challenging environment for obtaining real-time observations due to the lack of coastal infrastructure including grid-tied-power, easy road access and robust communication systems. During the past decade, the Alaska Ocean Observing System (AOOS) has partnered with government agencies, universities, tribes, and private industry to evaluate and demonstrate creative solutions to filling information gaps by establishing observing networks and using technologies and infrastructure that circumvent some of these challenges. In this review, we highlight three of these solutions and provide the motivation, application and a brief evaluation on successes that demonstrate the viability of these technologies for Alaska and other remote maritime observing needs.
Methods and Approach
The Alaska Ocean Observing System and Regional Collaborations
The sheer size of the Alaska region requires extensive collaboration and leveraging of other programs to accomplish the AOOS mission, which is to increase observing and forecasting capacity in all regions of the state, especially in the Arctic and the Gulf of Alaska. AOOS supports key observational assets while identifying and working to fill information gaps.
The Alaska Ocean Observing System is guided by a governing board made up of state and federal agencies, the University of Alaska and other Alaska research institutions, and representatives of the private sector including marine navigation, fisheries, oil and gas industries, and tribes. Strong stakeholder relationships and active engagement and outreach programs ensure the most urgent observing needs are prioritized as described in the AOOS Strategic Operations Plan (Alaska Ocean Observing System [AOOS], 2016). To enlist stakeholder input used to prioritize observing initiatives, AOOS hosts multiple observing network consortiums. The Alaska Water Level Watch (AWLW) is a collaborative group working to improve the quality, coverage, and accessibility to water level observations in Alaska’s coastal zone1,2. The Alaska Ocean Acidification Network3 and the Alaska Harmful Algae Bloom Network4 are two other examples of AOOS lead, topical working groups. These networks provide forums for stakeholder participation, collaboration and input to observing priorities, and they support and host workshops, pursue funding opportunities and proposals, as well as conduct outreach activities.
Alaska Ocean Observing System also actively supports and provides public access to regional real-time and historical data through the largest collection of regional and Arctic data, models, and visualization tools, powered by a state-of-the-art high-performance computing center. Through data portal tracking, user feedback and data requests, AOOS identifies where users need more information. All of these efforts provide valuable feedback on the need for specific data and information across the region, and through AOOS, informs the national IOOS program on critical observational data gaps and infrastructural and technology needs required to fill these gaps.
Operating High Frequency (HF) Radars in Remote Regions Off the Grid
High frequency (HF) radar systems are shore-based installations that measure high-resolution speed and direction of surface currents across large areas of the coastal ocean at hourly intervals in real-time. The present state of the United States national HF radar network for measuring surface current has resulted from nearly 40 years of research, development and application (Stewart and Joy, 1974; Teague et al., 1975; Holbrook and Frisch, 1981; Janopaul et al., 1982; Fernandez et al., 1995; Chapman and Graber, 1997; Graber et al., 1997; Essen et al., 2000; Paduan et al., 2001). HF radars are highly suitable for remote monitoring as they can operate autonomously under any weather condition. The spatial-map time series of HF radar surface currents provide enough detail for important applications including ecosystem research and management, numerical modeling and prediction, search and rescue, hazardous materials spill response, and overall increased marine domain awareness. HF radar signals have also been evaluated as a tool for vessel detection in areas lacking Automated Information System (AIS) capability (Roarty et al., 2013a,b), increasing their potential utility for remote observing.
Challenges With HF Radar Implementation in Alaska
Changes occurring in the Arctic, the expected increase in vessel traffic and need for predictive capabilities in ocean and ice forecasting are just a few of the motivations to increase HF radar observing in Alaska, especially along the Bering Sea and Bering Strait and the north slope in the Beaufort Sea. Though there is an extensive HF radar network operating continuously along much of the contiguous United States coastline5, Alaska currently has only three HF radar stations, which operate along the northwest coast on the Chukchi and western Beaufort Seas. Alaska lacks adequate HF radar installations, due in part to the limited available power and transportation infrastructure across much of the Alaska coastline.
A 5 MHz HF “long-range radar” are most common as they provide the best coverage and can transmit over radar distances up to 200 km using on the order of 7.5 kWh/day. Most HFR systems in the United States obtain power from the onshore power grid, and it is this dependency that has severely limited HF radar application in Alaska. Where power is available, namely in remote coastal communities that struggle with generating their own power needs, site location may not yield the optimal radar mask for sampling ocean currents. Remote installations of HF radar in Arctic and sub-Arctic Alaska must also consider difficult and costly logistics, demanding environmental conditions such as high winds, sub-freezing temperatures, salt-laden maritime air and icing, inquisitive, and potentially disruptive, wildlife (rodents, foxes, and bears), and site permit requirements.
HF Radar Power Solution – The Remote Power Module (RPM)
To solve the power problem with HF radar installations in Alaska, engineers and scientists from the University of Alaska, Fairbanks (UAF) College of Fisheries and Ocean Sciences developed an HF radar remote power module (RPM) (Statscewich et al., 2011, 2014). The RPM (Figure 1) is a stand-alone device for long-term deployments that minimizes permit issues associated with diesel generators and logistical costs associated with refueling and maintenance. The RPM design facilitates setup and transport to remote sites using small vehicles, and contains subsystems for power generation, satellite communications, and power performance monitoring. A battery bank with a 5-day power reserve is charged primarily by wind and solar, and secondarily by a biodiesel generator. The current system used in Alaska is specifically designed for high latitudes, but can be modified for remote coasts elsewhere. Two of the three Alaska HF radar stations are currently powered by RPMs. The UAF team has also successfully operated three HF radars in Antarctica, two of which were powered exclusively by RPMs. In 2019, AOOS and UAF will install two additional HF radars in the Bering Strait region with one system utilizing an RPM.
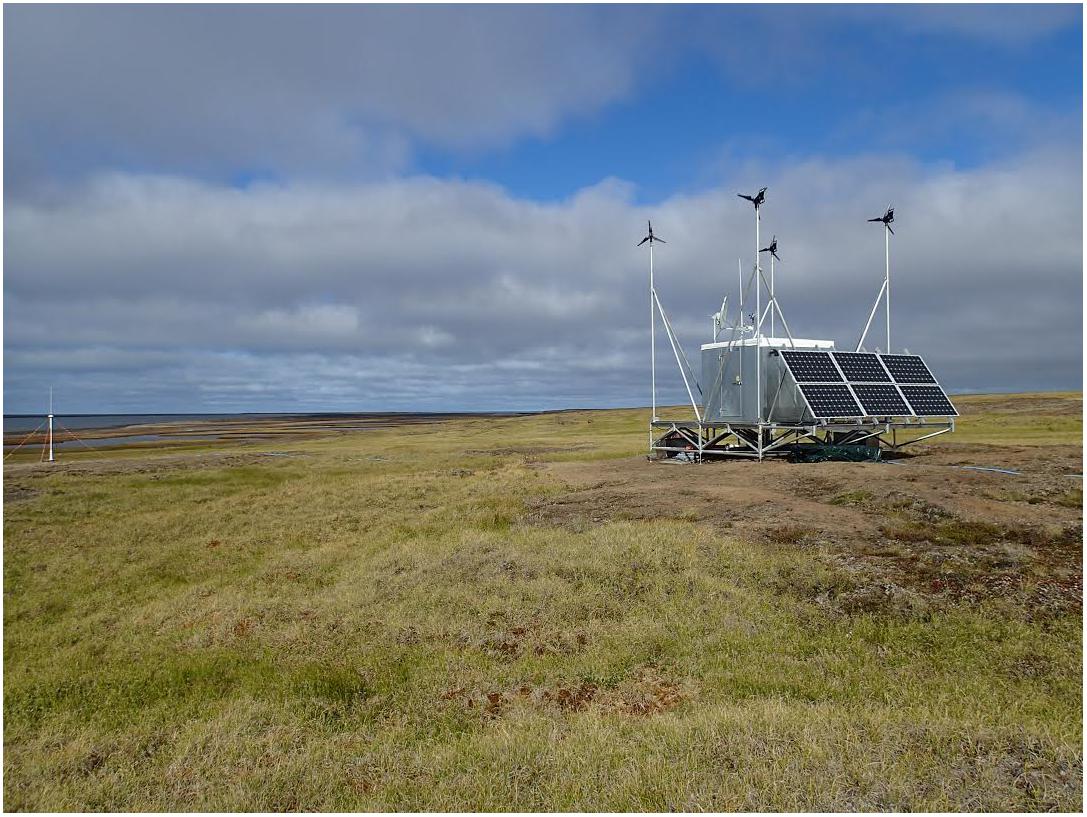
Figure 1. Picture of an Arctic HF radar installation to the left and its corresponding remote power module (RPM) shown to the right. (Photo credit: Hank Statscewich, UAF, AK).
Lessons Learned
The RPM design has proven reliable for the “High Arctic” and the Antarctic summer, but has several critical flaws, namely in the ability to keep electronics warm in deep winter. Engineers have since developed an insulated, thermo-regulated enclosure for the sensitive HFR electronics. Fortunately, heavy snow has not been an issue, as the foundation keeps the instrument enclosure and the bottom of the solar array nearly 1.5 m above the ground. Solar panels are kept at a fairly steep angle of 65 degrees, so snow tends to slide off, keeping them exposed to sunlight. To ensure real-time data delivery, an add-on iridium satellite-based data telemetry system will be implemented to provide a reliable data back-haul as a fail-over should the Hughes Net telemetry system go down. The three RPMs currently in the Arctic have produced nearly 90% of their total power from the wind, and similar performance at the new Bering Strait location is expected, but with periodic bursts of much higher winds than are typically seen on the north slope. To accommodate the higher winds, the wind turbine masts have been reinforced with a grade 80 stainless steel insert and deployed wind turbines will have a smaller rotor diameter to avoid excessive blade deflection and mast strikes. The power delivery sub-panel for the RPM has also undergone a major revision and will be much more compact, modular and integrated. The net result of these modifications will reduce total cost to build and purchase the RPM, enable quicker installation in harsh environments and provide additional system health monitoring, expediting a more thorough remote troubleshooting capability.
Real-Time Ice Detection Buoys for Maritime Domain Awareness and Ice Forecasting
In the United States Arctic, federal agencies, shipping and the oil and gas industries require an accurate method of predicting sea ice formation for offshore operations and maritime safety. One aim is to avoid costly, premature or delayed cessation of marine operations caused by inaccuracies in model predictions or satellite detection of sea ice formation. Despite the exceptional ability to forecast the onset of sea-ice formation, sea ice models remain challenged by the lack of information about how the vertical density gradient (induced by both temperature and salinity) over the shelf evolves as a function of air-sea heat fluxes. This information is limited as real-time water column observations are typically restricted to seasonal mooring operations that can only be conducted with vessel support during ice-free conditions. However, it is precisely during the breakup and freeze-up transitions when these observations are most needed for accurate ice modeling and forecasting efforts.
A Real-Time Ice Detection Buoy System (IDB)
The IOOS Ocean Technology Transition (OTT) program, sponsoring the transfer of emerging marine observing technologies into operational-ready platforms, supported the University of Alaska (UAF), industry partner Pacific Gyre and AOOS to fully develop and deploy an ice detection buoy (IDB) system that inexpensively and accurately reports the seasonal evolution of the thermohaline structure in the water column through the freeze-up cycle. Data from the IDB are needed by models to determine when the onset of offshore sea ice formation begins, while providing guidance for improving remote sensing algorithms for frazil ice detection, a notoriously difficult process for remote sensing ice satellites. The IDB itself is designed to transmit data real-time via iridium satellite through the onset of ice formation, at which time an expendable surface buoy is remotely detached by an operator to prevent loss of the subsurface mooring just before ice moves in or freeze-up commences. The subsurface mooring and sensor array remain in the water below ice keel-depth, recording data through the following breakup cycle and planned recovery.
Alaska IDB Sea Trials
The first IDB was deployed in 2015 on the Chukchi Shelf in 40 m water depth. The mooring was equipped with a sea surface thermistor, five subsurface SBE 37 IMM Microcat Conductivity and Temperature sensors (8,10, 20, 30, and 40 m), subsurface floatation below the expected ice keel-depth, an acoustic release and an expendable surface float equipped with iridium antennae for data transmission6. The IDB successfully reported the vertical temperature and salinity structure of the Chukchi Sea shelf in real-time prior to and during the 2015 freeze-up cycle. Operators released the expendable surface buoy when the vertical density gradient eroded in early November and satellite imagery indicated the main ice pack was less than a day from over-riding the mooring (Hauri et al., 2018).
The success of this trial buoy lead to the deployment of an identical system in 2017, with support from the NOAA National Weather Service (NWS). 2017 data were displayed real-time on the AOOS data portal as well as shared through the GTS (Global Telecommunications System), which enabled real-time access to the IDB data for use in the NWS Alaska Sea Ice Program (ASIP) forecasting activities. Data were used in the daily ice analysis, 5-day sea ice forecasts, and the 3-month sea ice outlook products. The NWS analyzed the IDB data alongside current satellite imagery in the vicinity of the buoy for a better informed and more complete view of the coupled atmosphere/ice/ocean system. The 2017 IDB was successfully recovered in the late summer of 2018 and the overwintering data are currently being analyzed.
Lessons Learned
The 2015 subsurface mooring was never recovered, either because the acoustic release failed, or more likely because ice keels moved the mooring by hooking the subsurface floatation. In 2018, a third IDB deployment only reported data for 1 day before going off-transmission due to ice. A passing research vessel recovered the intact mooring, which had moved south from its original deployment position and sustained damage to the antenna. The IDB surface and subsurface floatation clearly puts it at risk of mobile ice any time of year, and the IDB sea-trials have informed several needed modifications for future IDBs, including safeguarding against ice rafts and reinforcing the surface float communications antenna. Despite these risks, the value of capturing the real-time water column density stratification conditions during freeze-up was demonstrated and the success has captured the attention of the NWS and other stakeholders interested in ice freeze-up prediction and forecasting.
A Tiered Data Quality Approach for Observing Water Levels
Accurate water level observations are fundamental for safe navigation, mapping and charting, storm-surge forecasting, informed emergency response, and ecosystem management. Alaska’s extensive and remote shorelines are especially under-instrumented with respect to basic water level observations, due in part to regional obstacles including the formation of seasonal ice, the lack of coastal infrastructure needed to install observing platforms and rapid coastal erosion that render conventional water level sensing technologies impractical. Approved NOAA Center for Operational Oceanographic Products (CO-OPS) National Water Level Observation Network (NWLON) technologies primarily consist of in-water sensors in stilling wells or down-looking microwave systems, and station siting is heavily reliant on ice-free conditions and local infrastructure, making annual operations and maintenance of a more widespread series of NWLONs cost prohibitive for most of the low infrastructure coastline in Alaska. Currently, the entire west and north coasts of Alaska have only five NWLON tide gauges. Though NWLON installations are always desirable as they provide the best solution for all water level data applications, a tiered water level data policy allows for observations with lesser accuracies (Edwing, 2015). The policy stipulates water level data quality tiers A (e.g., NWLON), B and C, matching data accuracy to specific applications (Table 1).
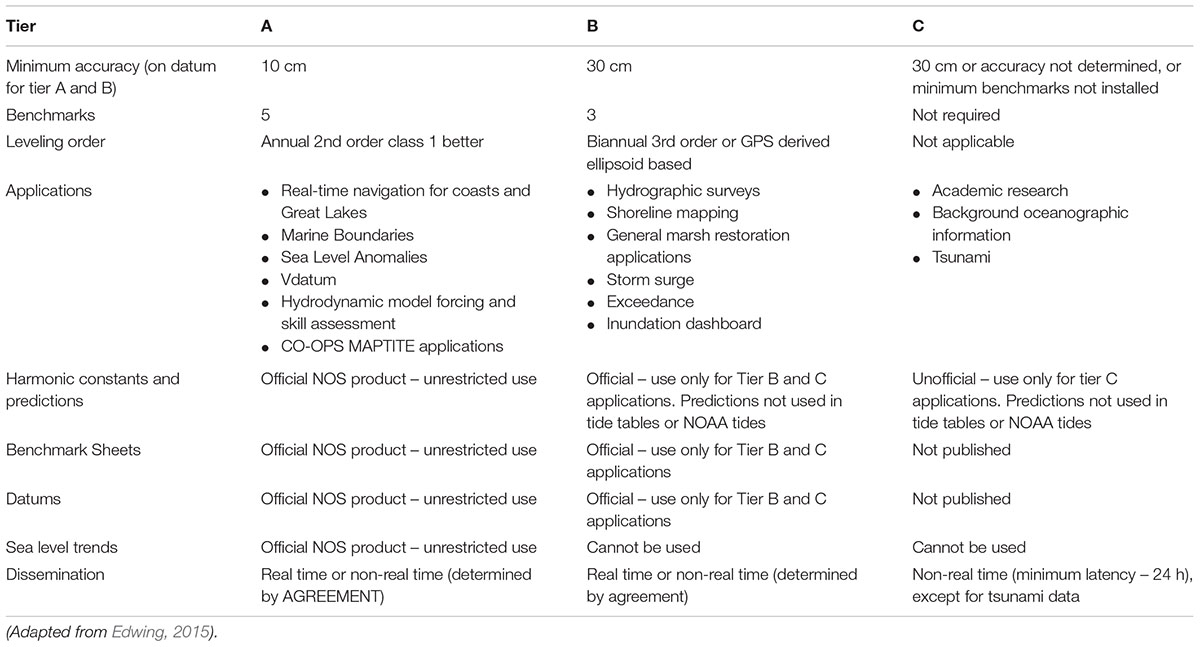
Table 1. Minimum criteria for tiered data within NOAA CO-OPS water level program.
The Alaska Water Level Watch (AWLW) partnership is working to augment the existing Alaska NWLON with tiered coastal water level observation products (e.g., real time stations, short-term time series, and high-water mark measurements). The ultimate goal is to make these additional data products public through a robust data management system that parallels the NOAA CO-OPS Tides and Currents online system7, as this system only hosts Tier A data. AOOS is supporting the initial development of the tiered data portal, and IOOS and NOAA CO-OPs plan to advance development of this capability and make it nationwide through the IOOS Regional Associations.
Remote, Real-Time Water Level Observing Using GNSS Reflectometry
Alaska Ocean Observing System is testing alternative methods that provide Tier B water level information, the minimum accuracy sufficient for computing datums, resolving tidal and subtidal water levels within 10 s of cm, also adequate for understanding flooding events and validating storm surge models and forecasts. Global Navigation Satellite Systems (GNSS) receivers have been demonstrated to provide a quality alternative method for directly measuring water level without a tide gauge, referred to as GNSS-Reflectometry (GNSS-R) (Martin-Neira, 1993; Löfgren et al., 2011; Larson et al., 2012, 2013, 2017; Dawidowicz, 2014; Strandberg et al., 2016; Williams and Nienvinski, 2016). GNSS-R receivers measure water level changes at an oblique angle, and can be installed on existing infrastructure, such as a pier or a building, or directly on land where a clear view of the water surface exists with no obstructions. The basic approach uses reflected GPS satellite signals to determine the height of a reflecting surface, such as the ocean, relative to a stable GPS antenna of fixed local height. The total received GPS signal measured by the antenna is the sum of the direct signal and the reflected signal. The interference between these two signals depends on the satellite altitude in the sky and on the receiver height above the ground. Given the satellite altitude is known, the observed interference pattern as the satellite rises/sets is used to extract the receiver height, after which the antenna height is subtracted to determine the true water level. GNSS-R can be installed and maintained more easily and at significantly lower cost than a traditional NWLON tide gauge while providing high quality Tier B water level information (e.g., Larson et al., 2013). GNSS-R systems do not require much power, and can operate off remotely rechargeable power supplies, such as small solar panels with rechargeable batteries, making them suitable for remote coastal installations. GNSS-R receivers also do not need to be removed prior to freeze-up, hence are especially well-suited for year-round Arctic installations. Real-time (or near real-time) data can be transmitted either by cell phone (if in a community with service), or via an iridium satellite link.
Alaska GNSS-R Pilot Study
Since 2017, AOOS and partners have been exploring GNSS-R water level measuring techniques to determine the efficacy of these systems for use in remote Alaska, and to determine some of the limitations in various environmental settings, such as mountainous fjords commonly found along the Southeast Alaska coast, and low-rise topography coastal areas with large tidal excursions common along the western Alaska coastline and north slope. The NWS is supporting AOOS in testing GNSS-R systems from both a non-profit geoscience consortium UNAVCO8, and a private industry partner ASTRA, LLC.
Alaska Ocean Observing System and UNAVCO have just started their collaboration, but AOOS and ASTRA, LLC completed their first GNSS-R sea trial in 2018 using ASTRA’s commercialized dual frequency GPS system that was initially developed for space weather monitoring. These space weather systems have operated in Alaska, including the Arctic, for over 10 years. A year-long pilot study conducted in Seward, Alaska enabled the performance of the ASTRA GPS receiver to be evaluated against water level measurements from a NOAA-operated NWLON station 2 km away. The water level data comparisons between the two methods showed acceptable agreement with the GNSS-R major tidal constituents (M2, S2, N2, K1, and O1) measuring within 5 cm of the NWLON estimates, easily meeting the Tier B water level criteria objective (Janzen et al., 2018).
Lessons Learned
The Seward sea trials using GNSS-R for water level observing have provided valuable logistical installation information for future remote deployments. Seward GNSS-R data indicated that deployment near mountainous regions can block satellite coverage and reduce the data rate during certain times of the day. GPS receivers provide high frequency data rates for water level observing, and fortunately, the reduced data rate did not prevent tidal harmonic and subtidal analyses of the data. However, a period of time when a ship was moored near the GPS receiver caused interference in the data quality, and illustrated the importance of locating installations away from areas frequented by boats.
Discussion
All observing activities in Alaska depend on substantial partnerships and leveraging of resources, as well as enhanced coordination with Alaska coastal communities and tribes. AOOS, as the Integrated Ocean Observing System (IOOS) Regional Association (RA) responsible for coordinating statewide monitoring for Alaska’s nearly 44,000 miles of coastline and offshore environments, is not the only entity working in this realm. However, it is the only entity representing state and federal agencies, research institutions and the private sector whose primary mission is to enhance ocean observations to meet a broad range of end user needs. Many of these activities depend on the collaboration among all 17 federal agencies within the NOAA managed national IOOS Program, as well as links to the Global Ocean Observing System (GOOS) and the Group on Earth Observations (GEO). These collaborations should be fostered and enhanced with training and technical support, as well as additional mechanisms for transferring and sharing of funds among federal agencies and with the private sector. As the Arctic continues to become more accessible and receive greater attention and use, a modest investment in additional observing assets in the region – linked to pan-Arctic assets and those in other Arctic regions, will enhance the United States marine domain awareness in the Arctic as well as national and international security.
Author Contributions
CJ: AOOS program manager of all projects in mini-review, lead author of this manuscript, lead author of Sections “Introduction,” “Real-Time Ice Detection Buoys for Maritime Domain Awareness and Ice Forecasting,” and “A Tiered Data Quality Approach for Observing Water Levels,” co-author and technical editor of all other sections, analyst for tidal harmonics of GPS reflectometry data discussed in Section “A Tiered Data Quality Approach for Observing Water Levels.” MM: AOOS director, lead author of Abstract and Sections “The Alaska Ocean Observing System and Regional Collaborations” and “Discussion,” and co-editor of all other sections. TW: lead project investigator on the HF Radar program in Alaska, lead project investigator for the Remote Power Modules used to support HF Radar in Alaska, co-author in Section “Operating High Frequency (HF) Radars in Remote Regions Off the Grid.” HS: lead engineer on HF Radar program in Alaska, lead engineer for Remote Power Modules used to support HF Radar in Alaska, lead author of Section “Operating High Frequency (HF) Radars in Remote Regions Off the Grid,” and supplied Figure 1. PW: lead project investigator for the Ice Detection Buoy project, co-author in Section “Real-Time Ice Detection Buoys for Maritime Domain Awareness and Ice Forecasting.” SD: project investigator on the Ice Detection Buoy project and current lead project investigator on the HF Radar program in Alaska, co-author in Section “Real-Time Ice Detection Buoys for Maritime Domain Awareness and Ice Forecasting.” RH: NOAA-National Weather Service liaison for the Ice Detection Buoy project, and co-author in Section “Real-Time Ice Detection Buoys for Maritime Domain Awareness and Ice Forecasting”.
Funding
Primary funding for AOOS and associated projects including HF radar and water level installations discussed in the manuscript comes from NOAA NOS grant-NA16NOS0120027. Past funders of the Alaska HF radar installations and development of the remote power modules (RPMs) discussed here include Shell Oil Company, the United States Bureau of Ocean Energy Management (BOEM), the North Slope Borough/Shell Baseline Studies Program, ConocoPhillips Alaska, the Alaska Coastal Impact Assistance Program (CIAP), and the National Center for Island, Maritime and Extreme Environment Security (CIMES). The Ice Detection Buoy (IDB) project was funded through a NOAA IOOS OTT Program Grant awarded to the University of Alaska, Fairbanks, under NOAA grant-NA14NOS0120147.
Conflict of Interest Statement
The authors declare that the research was conducted in the absence of any commercial or financial relationships that could be construed as a potential conflict of interest.
Acknowledgments
We would like to recognize the following for working toward increased marine observing: The NOAA Office of Coast Survey (OCS), the NOAA National Weather Service (NWS), the NOAA Integrated Ocean Observing System (IOOS) program, the Alaska Department of Natural Resources, and the Bureau of Ocean and Energy Management (BOEM). We would also like to thank our private industry partners Pacific Gyre and ASTRA, LLC, and non-profit partner UNAVCO for their significant role in making innovative and cost effective remote observing technologies possible.
Footnotes
- ^https://aoos.org/alaska-water-level-watch/
- ^https://www.facebook.com/AlaskaWaterLevelWatch/
- ^https://aoos.org/alaska-ocean-acidification-network/
- ^https://aoos.org/alaska-hab-network/
- ^http://hfradar.ndbc.noaa.gov
- ^https://aoos.org/ice-detection-buoy/
- ^https://tidesandcurrents.noaa.gov/
- ^https://www.unavco.org/about/about.html
References
Alaska Ocean Observing System [AOOS] (2016). AOOS FY 2016-2020 Strategic Operations Plan. Available at: http://aoos.org/wp-content/uploads/2016/08/AOOS-Strategic-Operations-Plan-FINAL-092116.pdf (accessed April 3, 2019).
Chapman, R. D., and Graber, H. C. (1997). Validation of HF radar measurements. Oceanography 10, 76–79. doi: 10.1109/EMBC.2016.7591829
Dawidowicz, K. (2014). Sea level changes monitoring using GNSS technology – a review of recent efforts. Acta Adriat. 55, 145–162.
DeMarban, A. (2018a). ‘Extreme’ Lack of Sea Ice and Autumn Heat Marked Alaska Weather in 2018. Available at: https://www.adn.com/alaska-news/weather/2019/01/01/extreme-lack-of-sea-ice-and-autumn-heat-marked-alaska-weather-in-2018/ (accessed April 3, 2019).
DeMarban, A. (2018b). ‘Nothing Even Comes Close’: Western Alaska Sea Ice at Lowest Extent Since 1850, Database Indicates. Available at: https://www.adn.com/alaska-news/environment/2018/04/11/western-alaska-sea-ice-at-lowest-extent-in-150-years-says-nws-scientist/ (accessed April 3, 2019).
Edwing, R. (2015). Approval of Revised Policy for Management and Dissemination of External Source Water Level Data. Washington, DC: United States Department of Commerce, 11.
Essen, H. H., Gurgel, K. W., and Schlick, T. (2000). On accuracy of current measurements by means of HF radar. IEEE J. Oceanic Eng. 25, 472–480. doi: 10.1109/48.895354
Fernandez, D. M., Vescky, J. F., and Teague, C. C. (1995). “Measurements of upper-ocean surface currents with high-frequency radar,” in Proceedings of the IEEE Fifth Working Conference on Current Measurement, St. Petersburg, FL, 109–114. doi: 10.1109/CCM.1995.516159
Graber, H. C., Haus, B. K., Shay, L. K., and Chapman, R. D. (1997). HF radar comparisons with moored estimates of current speed and direction: expected differences and implications. J. Geophys. Res. 102, 18749–18766. doi: 10.1029/97JC01190
Hauri, C., Danielson, S., McDonnell, A. M. P., Hopcroft, R. R., Winsor, P., Shipton, P., et al. (2018). From sea ice to seals: a moored marine ecosystem observatory in the Arctic. Ocean Sci. 14, 1423–1433. doi: 10.5194/os-14-1423-2018
Holbrook, J. R., and Frisch, A. S. (1981). A comparsion of near-surface CODAR and VACM measurements in the strait of Juan De Fuca. J. Geophys. Res. 86, 10908–10912. doi: 10.1029/JC086iC11p10908
Janopaul, M. M., Broche, P., de Maistre, J. C., Essen, H. H., Blanchet, C., Grau, G., et al. (1982). Comparison of measurements of sea currents by HF radar and by conventional means. Int. J. Remote Sens. 3, 409–422. doi: 10.1080/01431168208948412
Janzen, C. D., Thompson, G., Gisler, A., Reynolds, A., Azeem, I., Crowley, G., et al. (2018). “Using space phsyics technologies for accurate land-based water level measurements,” in Proceedings of the Conference on AGU Ocean Sciences Meeting, Portland, OR.
Johnson, M., and Eicken, H. (2016). Estimating Arctic sea-ice-freeze-up and break-up from the satellite record: a comparison of different approaches in the Chukchi and Beaufort Seas. Elementa 4:000124. doi: 10.12952/journal.elementa.000124
Larson, K. M., Löfgren, J. S., and Haas, R. (2012). Coastal sea level measurements using a single geodetic GPS receiver. Adv. Space Res. 51, 1301–1310. doi: 10.1016/j.asr.2012.04.017
Larson, K. M., Ray, R. D., Nievinski, F. G., and Freymueller, J. T. (2013). The accidental tide gauge: a GPS reflection case study from Kachemak Bay, Alaska. IEEE Geosci. Remote Sens. Lett. 10, 1200–1204. doi: 10.1109/LGRS.2012.2236075
Larson, K. M., Ray, R. D., and Williams, S. D. P. (2017). A 10-year comparison of water levels measured with a geodetic GPS receiver versus a conventional tide gauge. J. Atmos. Oceanic Technol. 34, 295–307. doi: 10.1175/JTECH-D-16-0101.1
Löfgren, J. S., Haas, R., and Johansson, J. M. (2011). Monitoring coastal sea level using reflected GNSS signals. Adv. Space Res. 47, 213–220. doi: 10.1016/j.asr.2010.08.015
Mahoney, A. R., Eicken, H., Gaylord, A. G., and Gens, R. (2014). Landfast sea ice extend in the Chukchi and Beaufort Seas: the annual cycle and decadal variability. Cold Region Sci. Technol. 103, 41–56. doi: 10.1016/j.coldregions.2014.03.0033
Martin-Neira, M. A. (1993). Passive reflectometry and interferometry system (PARIS); application to ocean altimetry. ESA J. 17, 331–355.
Masters, J. (2013). The Thawing Arctic: Risks and Opportunities. Available at: http://www.cfr.org/arctic/thawing-arctic-risks-opportunities/p32082 (accessed April 3, 2019).
Merrick, J. R. W., Rene van Dorp, J., Mazzuchi, T., Harrald, J. R., Spahn, J. E., and Grabowski, M. (2002). The prince william sound risk assessment. Interfaces 32, 25–40. doi: 10.1287/inte.32.6.25.6474
NASA (2016). “2016 Arctic sea ice wintertime extent hits another record low,” in Global Climate Change. Available at: https://climate.nasa.gov/news/2422/2016-arctic-sea-ice-wintertime-extent-hits-another-record-low/ (accessed April 3, 2019).
Paduan, J., Barrick, D., Fernandez, D., Hallock, Z., and Teague, C. (2001). Improving the accuracy of coastal HF radar current mapping. Hydro Int. 5, 26–29.
Pan, M., and Huntington, H. P. (2016). A precautionary approach to fisheries in the central arctic ocean: policy, science and China. Mar. Policy 63, 153–157. doi: 10.1016/j.marpol.2015.10.015
Quillérou, E., Jacquot, M., Cudennec, A., and Bailly, D. (2017). The Arctic: Opportunities, Concerns and Challenges. Available at: http://www.ocean-climate.org/wp-content/uploads/2017/03/the-arctic_07-9.pdf (accessed April 3, 2019).
Roarty, H. J., Smith, M., Glenn, S., Barrick, D. E., Whelan, C., Page, E., et al. (2013a). “Expanding the maritime domain awareness capabilities in the arctic: high frequency radar vessel tracking,” in Proceedings of the 2013 IEEE Radar Conference (RadarCon13), Ottawa, ON. doi: 10.1109/RADAR.2013.6586136
Roarty, H. J., Smith, M., Glenn, S., Barrick, D. E., Whelan, C., and Statscewich, H. (2013b). “Multi-Use HF radar for arctic maritime domain awareness,” in Proceedings of the OCEANS’13 MTS/IEEE Conference, Bergen Norway. doi: 10.1109/OCEANS-Bergen.2013.6608132
Roelevan, D., Kokc, M., Stipdonk, H. I., and De Vries, W. A. (1995). Inland waterway transport: modelling the probability of accidents. Saf. Sci. 19, 191–202. doi: 10.1016/0925-7535(94)00020-4
Samenow, J. (2018). ‘Fallen Off a Cliff’: Scientists Have Never Observed so Little Ice in the Bering Sea in Spring. Available at: https://www.washingtonpost.com/news/capital-weather-gang/wp/2018/05/03/fallen-off-a-cliff-scientists-have-never-observed-so-little-ice-in-the-bering-sea-in-spring/?utm_term=.c64016b78343 (accessed April 3, 2019).
Statscewich, H., Smith, H. R. M., Page, E., Glenn, S., and Weingartner, T. (2014). Enhancing arctic maritime domain awareness through an off-grid multi-sensor instrument platform. Mar. Technol. Soc. J. 48, 97–109. doi: 10.4031/MTSJ.48.5.1
Statscewich, H., Weingartner, T., Danielson, S., Grunau, B., Egan, G., and Timm, J. (2011). A high-latitude modular autonomous power, control, and communication system for application to high-frequency surface current mapping radars. Mar. Technol. Soc. J. 45, 59–68. doi: 10.4031/MTSJ.45.3.7
Stewart, R. H., and Joy, J. W. (1974). HF radio measurements of ocean surface currents. Deep Sea Res. 21, 1039–1049.
Strandberg, J., Hobiger, T., and Haas, R. (2016). Improving GNSS-R sea level determination through inverse modeling of SNR data. Radio Sci. 51, 1286–1296. doi: 10.1002/2016RS006057
Teague, C. C., Tyler, G. L., and Stewart, R. H. (1975). The radar cross section of the sea at 1.95 MHz: comparison of in-situ and radar determinations. Radio Sci. 10, 847–852. doi: 10.1029/RS010i010p00847
Tonami, A. (2016). Asian Foreign Policy in a Changing Arctic: The Diplomacy of Economy and Science at New Frontiers. Basingstoke: Palgrave Macmillan, 140. doi: 10.1057/978-1-137-53746-1
U.S. Navy Dept (2009). Task Force Climate Change and the Arctic Roadmap. Washington, DC: U.S. Navy Dept.
U.S. Coast Guard (2013). United States Coast Guard: Arctic Strategy, Vol. 48. Washington, DC: U.S. Coast Guard.
Viñas, M.-J. (2016). Sea Ice Hits Record Lows, in: Arctic Sea Ice News and Analysis, National Snow and Ice Data Center. Available at: http://nsidc.org/arcticseaicenews/2016/ (accessed April 3, 2019).
Walsh, J. (2018). “Sea ice in the Alaska Region: the remarkable winter of 2017-18,” in Nov 2017-April 2018 Alaska Climate Dispatch, A State-Wide Seasonal Summary and Outlook, eds A. York and T. Buxbaum (Koyukuk, AK: Alaska Center for Climate Assessment & Policy). Available at: https://accap.uaf.edu/sites/default/files/climate_dispatch_May_2018_FINAL.pdf
Williams, S. D. P., and Nienvinski, F. G. (2016). Tropospheric delays in ground-based GNSS multi-path reflectometry – experimental evidence from coastal sites. AGU J. Geophys. Res. Solid Earth 122, 2310–2327. doi: 10.1002/2016JB013612
Keywords: currents, ice detection, water level, GNSS reflectometry, modeling, forecasting
Citation: Janzen C, McCammon M, Weingartner T, Statscewich H, Winsor P, Danielson S and Heim R (2019) Innovative Real-Time Observing Capabilities for Remote Coastal Regions. Front. Mar. Sci. 6:176. doi: 10.3389/fmars.2019.00176
Received: 01 November 2018; Accepted: 19 March 2019;
Published: 03 May 2019.
Edited by:
Maria Snoussi, Mohammed V University, MoroccoReviewed by:
Twila Moon, University of Oregon, United StatesMatthew Druckenmiller, National Snow and Ice Data Center, United States
C. K. Shum, The Ohio State University, United States
Copyright © 2019 Janzen, McCammon, Weingartner, Statscewich, Winsor, Danielson and Heim. This is an open-access article distributed under the terms of the Creative Commons Attribution License (CC BY). The use, distribution or reproduction in other forums is permitted, provided the original author(s) and the copyright owner(s) are credited and that the original publication in this journal is cited, in accordance with accepted academic practice. No use, distribution or reproduction is permitted which does not comply with these terms.
*Correspondence: Carol Janzen, Janzen@aoos.org