The Impact of Cyberattacks on Efficient Operations of CAVs
 Ian McManus
 Kevin Heaslip
- Secure Transportation Operations Laboratory, Department of Civil and Environmental Engineering, Virginia Tech, Blacksburg, VA, United States
The implementation of connected and automated vehicles promises increased safety and efficiency by leveraging advances in technology. With this new technology, some vulnerabilities could lead to cyberattacks. Without a focus on cybersecurity, vehicles may be attacked, reducing the efficiency and safety advantages promised through technological advancement. This research performed an impact analysis on traffic operations of cyberattacks on Vehicular Ad-Hoc Networks (VANET). A roadway traffic and communications simulation was created using the Veins modeling platform that incorporated V2X communication and could model Denial of Service (DoS) and Man in the Middle (MITM) attacks on an urban street network. The number of compromised intersections and attack success rate were varied to understand the impact of each attack scenario. Each attack’s worst-case scenario resulted in an over 20% increase in travel time delay per vehicle as the attack severity increased. Also, the attacks had a wide variation in delay upon the transportation network, decreasing the travel time reliability and the ability for road users to predict delay on their journey.
Introduction
Connected and Automated Vehicles (CAV) are currently one of the main focuses of the transportation research community, with many Original Equipment Manufacturers (OEM) and technology companies seeking to deploy advanced vehicles into the consumer market sooner than later. CAVs will be able to communicate with other vehicles through Vehicle-to-Vehicle (V2V) communication and Road-Side Units (RSU) through Vehicle-to-Infrastructure (V2I) communication. These two sources of communication will allow CAVs to have continuous awareness and an updated map of the road landscape around them, alerting them to crashes or congestion that may be occurring downstream (Intelligent Transportation Systems - ITS Program Overview, 2021). The performance of these vehicles is widely believed to reduce crashes, deaths, congestion, and emissions in the future. The National Highway Traffic Safety Administration (NHTSA) reported that in 2018, 36,560 people were killed in motor vehicle crashes, and 94% of all severe crashes resulted from human error; both statistics are expected to be significantly reduced by the introduction of CAVs (National Highway Traffic Safety Administration, 2017). CAVs seek to leverage technology to improve the safety and efficiency of the transportation network—generally restricted by human error. The introduction of this emerging technology presents a new challenge to vehicles in cyberattacks.
This paper focuses on the impact of Denial of Service (DoS) attacks and Man in the Middle (MITM) attacks on traffic operations. Al-kahtani, (2012) described a DoS attack as a malicious node sending dummy messages that can overwhelm the system, jamming any further communications, thus preventing critical and necessary messages from being sent to other nodes on the communication network. This same study described a MITM attack as a malicious node eavesdropping on messages sent between other vehicles or infrastructure; the node injects a malicious message into the communication network (Al-kahtani, 2012). These two attacks were selected as they are two relatively understood and well-known attacks that can significantly impact the transportation network (Kelarestaghi et al., 2019). Understanding these cyberattacks’ impact on the transportation network is important to designing and constructing a more resilient transportation system. Successful cyberattacks can nullify the benefits promised by the emergence of CAVs and introduce safety and delay impacts for transportation users.
This research aims to quantify the efficiency impact of cyberattacks in a connected vehicle environment. Using OMNeT++, nineteen scenarios were modeled—including one base scenario with no attack. Scenarios for DoS and MITM attacks were developed by increasing attack success rates and the number of infected RSUs. The possible scenarios developed contained either one, six, or twelve infected RSUs with a 25, 50, or 75% chance of attack success. The travel time delay for each scenario was calculated by comparing the travel time per vehicle against the base scenario. This analysis includes numerical comparisons of the travel time delay for each scenario and T-tests and Chi-squared tests, comparing the means and variance of the delays.
The remainder of this paper will detail previous research pertinent to this research, discuss the research’s methodology, present the results from the simulations, discuss the importance of the results, and draw conclusions from the study. The methodology contains an outline for the simulation setup, running the simulation, and analysis.
Literature Review
A comprehensive literature review was conducted with a multidisciplinary lens to gain a perspective of research that has been conducted in different fields. The fields covered in the literature review included electrical engineering, computer science, and transportation engineering. A preliminary literature review showed a lack of multidisciplinary research in the state of the art, which required a separate examination of each field’s state of the art. The goal of the literature review was to identify research that is needed on the topic of cybersecurity of transportation infrastructure and vehicles.
CAVS and Cyberattacks
While CAVs are still an emerging technology, automated vehicles have been studied robustly for several decades, with the first “modern” automated vehicle being developed in Germany at the tail end of the 20th century (Davidson and Spinoulas, 2015). Automated vehicle research and competition increased in the United States at the beginning of the 21st century due to the United States Defense Advanced Research Project Agency (DARPA) Grand and Urban Challenge, where universities, vehicle manufacturers, and other companies deployed automated vehicle technology that is now attempting to be deployed to the consumer market (Davidson and Spinoulas, 2015).
Companies such as Audi, Mercedes-Benz, and Google currently have rigorously tested prototypes (Lavasani et al., 2016). As of September 2020, Google’s (now Alphabet) automated vehicle program, Waymo, has driven more than 20 million miles on public roads with self-driving-enabled vehicles at level four automation (Waymo, 2020). The Society of Automotive Engineers (SAE) has developed Standard J0316, defining the six levels of automation in vehicles, with zero being no automation and level five being full automation (SAE International, 2018).
Connected and automated vehicles are currently being researched, developed, and tested but have not been deployed in the consumer market. Litman, (2020) claimed that automated vehicles would be available at the end of the 2020s, but they will only benefit the affluent population; most people will not receive the benefits until possibly 2060 (Litman, 2020). Using a model based on the implementation of previous emerging technologies, Lavasani et al. (2016) concluded that if automated vehicles are available in 2025, it will take 10 years (2035) for eight million vehicles to be in the market and 35 years (2060) for the market to become fully saturated with these vehicles. However, more Advanced Driver Assistance Systems (ADAS) are being deployed every year in the commercial market, moving today’s vehicles close to fully automated vehicles.
In the future, vehicles will communicate with each other and roadside infrastructure through a communication network known as a vehicular ad-hoc network (VANET). In a VANET, vehicles are treated as nodes on the system, and roadside infrastructure is fixed. Vehicles use On-Board Units (OBU) to send messages to other vehicles and Road Side Units (RSU), on the infrastructure side, with all communication using wireless connections based on IEEE 802.11p radio frequencies (Al-Sultan et al., 2014). Communication between vehicles on the road and in-place infrastructure allows for advanced warning messages and safety messages to be sent throughout the network, theoretically reducing crashes and congestion.
CAVs are also vulnerable to hacking and cyberattacks. Anticipating and defending against these attacks is important as there is an obvious endangerment to human life if these attacks are successful. To help ensure safety against cyberattacks, Al-kahtani, (2012) and Kelarestaghi et al. (2019) named five main security requirements: availability, authentication, integrity, confidentiality, non-repudiation, and privacy.
DoS and MITM attacks are the two attacks modeled in this research. While these attacks can fall into multiple categories (Kelarestaghi et al., 2019), in this research, the DoS attacks seek to disrupt the communication network’s availability while the MITM attack compromises authentication. A DoS attack can be broadly described as limiting a user’s access to the VANET (Sumra et al., 2011). The three main techniques for executing this attack are occupying the communication network’s resources by overloading it with random signals, jamming the network with large amounts of messages, and dropping packets sent on the network (Sumra et al., 2011; Ahmad and Adnane, 2016). The last method is modeled in this research, preventing important messages from being received by the desired destination. DoS attacks are likely to occur with a high impact (Ahmad and Adnane, 2016) and can be performed without detection from the victims (Biswas et al., 2012). The attack’s relative ease and high impact make it an important research topic moving forward.
MITM attacks function differently and can be effectively described as an attacker intercepting a message sent between two nodes in the system (Al-kahtani, 2012). Once a message is compromised, an attacker can do four main things: delay the message sending, drop it, modify it, or record the message (Ahmad et al., 2018). This research models the attack as a delay attack, impacting the timing of important operational messages for vehicles. MITM attacks have been categorized as possible with a moderate impact (Ahmad and Adnane, 2016). These attacks are generally considered less severe than DoS attacks, but their numerous consequences have made them a popular research topic.
Cybersecurity in Transportation Engineering
The existing research surrounding this topic is split between examining the impact of the attacks on VANET communications and its implications on high-level MOEs. The other research focuses more on the effects of an attack on more traditional, yet focused, transportation MOEs. This research falls short in investigating the transportation aspect. The research presented below describes previous conclusions while showing the knowledge gaps.
Intelligent Transportation Systems (ITS) and autonomy are not new topics within transportation engineering. ITS has been implemented for years, and modern cars are equipped with driver-assist functions like lane-keeping assist and cooperative adaptive cruise control (CACC). Even with these topics being well researched, little in-depth research has been done to quantify cybersecurity risks. Ganin et al. (2019) modeled resilience by quantifying the travel time delay associated with disruptions to ITS links and nodes (smart intersections and smart segments). The study found that travel time delay was increased by nearly 20% by disruptions at ITS-controlled intersections (Ganin et al., 2019). The results demonstrated that even a low-level connected transportation network that only incorporates ITS is vulnerable to disruptions due to attacks, resulting in significant travel time delays within the transportation system. Amoozadeh et al. (2015) demonstrated the impacts of message falsification and radio jamming attacks on a CACC enabled vehicle platoon. The attacks proved that compromising CACC in vehicle platoons reduces acceptable gaps between vehicles (efficiency) and reduces each vehicle’s speed in the platoon (Amoozadeh et al., 2015). These two studies stand to show that not-so-distant infrastructure and technology are susceptible to cyberattacks, attacks that have significant implications on transportation safety and operations.
Ahmad et al. (2018) tested the effects of MITM attacks on VANETs, seeking to quantify the different impact concentrations of malicious nodes had on the VANET’s behavior. The results showed that delayed, dropped, and tampered messages significantly hampered the communication network’s ability to efficiently and effectively transmit message packets between vehicles and RSUs (Ahmad et al., 2018). As a result of hampered network communication abilities, the researchers reported that the attack would compromise transportation safety and operations. A similar study performed by Grover et al. (2013) demonstrated the impact of a position forging attack on the VANET’s packet transmission and quantified the effect on average vehicle speed. This study also showed that this attack against the VANET resulted in packet transmission interference, dropped packets, and significantly reduced average vehicle speed (Grover et al., 2013). While these two studies somewhat demonstrated how cyberattacks could impact transportation safety and operations, they focused more on VANET operations.
Two studies were found that quantified the impact of cyberattacks against CAVs in terms of transportation MOEs. Ekedebe et al. (2015) studied the effect of a jamming DoS attack on a transportation network following a crash and the subsequent traffic backup. Similarly, Garip et al. (2015) demonstrated how a vehicular botnet could impact roadway traffic operations and travel times.
These studies focused their research on vehicle traffic network operations. However, neither presented detailed, quantifiable impacts on safety. Ekedebe et al. (2015) set up a simulation where upstream traffic was slowed/stopped due to a crash. A jamming DoS attack was implemented on downstream vehicles, ranging from 0 to 100% communication jam. These communications jamming attacks aimed to hamper the compromised vehicles’ ability to reroute around the traffic jam dynamically. The study showed that more vehicles remained on the jammed route as the attack reduced communications, resulting in even more travel time delay, increased travel times, increased emissions, and decreased average speed for the compromised vehicles (Ekedebe et al., 2015). Garip et al. (2015) used a different tactic to lure compromised vehicles onto already congested street segments, using a bot network to send falsified messages. Using different concentrations of bots, researchers demonstrated that this attack could trick vehicles into thinking a route was clear when the road was already congested with vehicle traffic and other compromised vehicles (Garip et al., 2015). These message falsification attacks resulted in a drastic increase in trip time, travel time delay, and congestion while significantly reducing the average speed of vehicles in the network (Garip et al., 2015).
As shown above, the research connecting cybersecurity and transportation operations and safety exist, but there are many knowledge gaps. These knowledge gaps shaped the research detailed throughout this paper, producing the goal of quantifying the impact of cyberattacks in transportation. This research will measure the efficiency impact to the transportation network following DoS and MITM attacks on RSUs in a connected vehicle environment to achieve this goal. The attacks focus on attacking the transportation network as it operates normally - understanding attacks that could occur at any time. The research performed also provides a numerical baseline for impact on the network from cyberattacks. Finally, the research also aimed to connect the impact of cyberattacks on VANETs on the transportation network itself.
Methodology
The following sections summarize the methodology to develop and implement the simulation and the data analysis that followed. The full details of this process can be found in McManus, (2021). Developing the simulation began with establishing clear assumptions for the model. Once the simulation environment was set, the base model was created. This base model represents a CAV environment with no cyberattacks. The attack models and attack response models were then developed to simulate cyberattacks. Following the development of the attacks, the analysis methodology is laid out to detail the methods and significance of data analysis methods used.
Simulation Assumptions
The simulation model’s development incorporated many aspects of emerging technologies that are not yet 100% understood in implementation. The list of assumptions made are listed below:
• Attacks could be carried out as the model does not incorporate countermeasures. Manually adjusting the attack success rate and the number of infected RSUs allowed for a controlled attack environment and could be changed using effectiveness rates of postulated countermeasures.
• Crash avoidance technologies such as radar and lidar were not incorporated into the simulation. These technologies could serve as redundancies in future CAVs, but they were not modeled in the simulation. It was also assumed that the CAV was a level 5, with no driver intervention. These two assumptions led to the conservative, worst-case attack results in the simulation scenarios.
• Vehicles would navigate the intersection following a crash at a very slow speed to account for the extra maneuvering and cautiousness needed to navigate an area where a crash occurred. This assumption allowed for a uniform collision response versus a more stochastic distribution seen in the maneuvering around collisions in the real world.
• The delay speed, delay time, and recovery times were constant throughout the simulation. These assumptions modeled the results of a vehicle network traffic delay versus simulating the actual traffic flow theory and conditions. This also allowed scenarios to be compared to each other.
• The base scenario assumed no cyberattacks and perfect CAV operations. This resulted in no crashes in the base scenario.
• The vehicle volume was assumed and kept constant, while the routing was randomized before the simulation was run and kept consistent throughout the simulation.
Simulation Development
The simulation was developed using a connected urban environment; a Manhattan grid was used to represent an urban street network and is easily scalable. The generic street grid was selected to provide maximum control of vehicle interaction and demonstrate a proof of concept for the simulation itself. It also provides a uniform emphasis on all intersections, creating a more uniform and distributed traffic flow at a network level. The grid contains six vertical streets and three horizontals, creating 18 total intersections 800 m apart. There is a north-south emphasis with all six vertical streets representing major vehicle traffic generators, while only the middle east-west route is a major generator. The two other east-west roads contain one-third of the traffic generation, emphasizing vehicular traffic conflicts within the street network, not at the corners. Each approach to an intersection is a single lane in each direction that accommodates all three turning movements (left, through, right). In future iterations, the street network and traffic volume could be adapted to fit a real-world network with validated traffic counts.
The Veins simulation software package was chosen to model the connected vehicle environment. The Veins software was prevalent in previous studies and tested cyberattacks on VANETs. It is an open-sourced software that contains a network simulator (OMNeT++) (What is OMNeT++?, 2021) and a microscopic traffic simulator (SUMO) (Lopez et al., 2018). Veins pairs these two simulators and runs and communicates in parallel. This architecture allows for the simulation of a connected vehicle environment (Sommer et al., 2011).
The routing for the vehicles was created using SUMO’s iterative script that optimized the simulation using the shortest distance for each vehicle (Lopez et al., 2018). This was paired with an extension that randomized the vehicles’ arrival times to the street network, creating non-uniform vehicle arrivals. This vehicle routing optimization was used for each scenario, creating uniform vehicle traffic flow. Each origin produced an equal number of trips destined for each other boundary node in the simulation.
Base Model Development
The simulation begins with vehicles and RSUs performing initialization functions that establish communication channels, unique PSIDs, and setting counters to zero. The initialization also establishes the connection between OMNeT++ and SUMO through their parallel communication channel, the Traffic Control Interface (TraCI) (TraCI - SUMO Documentation, 2021). Eighteen total RSUs were used within the simulation, one at each intersection. Each RSU had a communication radius of 350 m and assigned reservations and directed vehicle traffic through its intersection. Intersection reservations used a similar “weaving” technique discussed in (Fajardo et al., 2011), using time reservations as a limiting factor instead of a spatial technique. Reservations for approaching vehicles were handled using the First-In-First-Out queueing. The RSUs were not given additional dynamic routing or other traffic efficiency abilities.
Once initialization is completed, each RSU creates a self-message sent every half second. After it receives its message, the RSU sends out a service message beacon. These beacons are sent on IEEE 802.11p channel 178, reserved for control messages (Eichler, 2007).
Once the vehicle enters the radius, it receives this beacon, which acts as a “hello” message the first time around. Upon receiving the message, the vehicle will note the RSU’s identification PSID. It will also check the reservations sent by the RSU; since it is the first interaction, the vehicle will not receive a reservation. Once the vehicle realizes there is no reservation from the RSU in the message, it sends back a message to request a reservation.
The RSU receives the vehicle’s request, containing important information like PSID, speed, distance, routing, fastest arrival time, and direction. Using these pieces of information, the RSU checks for any conflicting reservations along the pathing route of the vehicle. The intersection contains sixteen critical points that outline the path of any turning movement from any direction. The RSU calculates the time it would take the approaching vehicle to pass through each of the critical points on its route. Then, using these calculations, it checks if any conflicting reservations are already made. If there are conflicting reservations at any point, the most conservative number is taken, and the safe time is added to all the critical points on the car’s path. The RSU notes these times to be used in later reservations and notes the vehicle’s quickest safe arrival time, paired with the vehicle’s PSID. If a delayed intersection entry is required, additional time will be added to ensure safe passage as redundancy for all turning movements. This process is done iteratively for each vehicle message received, based on the vehicles’ distance to the intersection. Once done, the time and PSID vector are sent out to the vehicles.
Upon receiving the reservation time from the RSU, the vehicle checks existing reservations and finds its reservation based on the PSID attached to the reservation. The vehicle will take the reservation time and calculate whether the reservation requires the vehicle to accelerate or decelerate before the intersection to accommodate any delay. If a delay is required, the vehicle will calculate the speed it needs to maintain and adjust immediately to that speed. It will also calculate the time until the vehicle needs to accelerate or decelerate to reach its route speed as it enters the intersection.
After clearing an intersection at its allotted time, the vehicle will accelerate back to the simulation max speed. The vehicle will not communicate with an RSU until it reaches the communication radius of the next intersection. Upon reaching the next communication radius, the vehicle will note that it is at a new intersection and must make a new reservation. This process is repeated for all vehicles until they reach their destination.
Attack Model Development
This research simulated the impacts of MITM and DoS attacks on a connected vehicle environment. These two attacks were selected as their methodology is relatively understood, and they have been categorized as likely attacks with significant impacts in previous literature. The attacks were modeled to show their impacts, not the attack methods themselves. It was assumed that a malicious actor was able to perform these attacks, the modeling of the attack itself was not in the scope of this research. It was also assumed that the attacker could successfully manipulate the messages to achieve their end goal of decreased transportation network operations.
Two variables were added to the simulation that controlled the likelihood of success of each attack. This variable was manually adjusted for each attack scenario. A large amount of control was provided when simulating the attacks using the two manual variables, attack success rate and the number of infected RSUs. This level of control is a tradeoff as it models what happens after a successful attack has occurred instead of when modeling the attack itself. The two variables allow the simulation to emulate the process of an attack by modeling its success rate and its dissemination through the communication network.
A DoS attack that drops vehicle reservation messages was modeled in this simulation. The vehicle will receive an RSU’s initial message and, if the attack is successful, the vehicle will never respond and drop its self-message, ending the reservation process. The attack skips the reservation process but tricks the vehicle into believing it has received a legitimate reservation. Given the time and space, the impacted vehicle will enter the intersection with no reservation but slow to avoid a crash, if possible, within the vehicle following model. The vehicle’s behavior is based on the Krauss car-following method (Krauß, 1998).
The MITM attack simulates an intercepted message that delays a vehicle’s acceleration/deceleration self-message to reach the intersection on time. The delay integer is randomly selected between two and 5 seconds, drastically impacting the timing of the intersection operations. Since the vehicle follows a legitimate reservation, it cannot slow down to avoid an impending collision like a DoS vehicle. Both attacks are expected to produce crashes at the impacted intersections during the simulation.
After a collision occurs, the RSU is immediately notified, notes the time of the collision, and clears all reservations. Any vehicle within the communication radius immediately slows to a delay speed of 2.24 m/s. This delay speed was selected to introduce delay in the transportation network, emulating a light vehicle flow throughout the delay time. Vehicles must maintain this speed throughout the 5-min delay period. The delay period was used to demonstrate a measurable delay following a crash. Simulating crashes in a wholly CAV environment is difficult since it is unknown what a crash would look like in a fully automated environment. The significantly reduced traffic flow produces a delay similar to a partially blocked intersection, producing resultant delay while still allowing minimal traffic flow. The 5-min delay period was significant given the simulation period. At any time during the delay period, if a vehicle is within 75 m of the intersection, it can make a proper reservation. This process assumes that vehicles will navigate the intersection following the collision at an extremely limited rate. This delay model was designed to simulate a slow-moving queue following a collision at the intersection.
Following the 5-min delay, a 5-min recovery period exists. During both periods, vehicles making reservations are immune to cyberattacks to prevent cascading crashes in the simulation. The delay period provides adequate time for the intersection to recover to free-flow speeds without the threat of an attack. Once the delay period ends, the RSU sends a message to all vehicles in the queue, indicating they can make reservations again. The RSU receives these messages, sorts them by distance to the intersection, then makes reservations for the first ten vehicles in the queue. Reservations are made in ten vehicle intervals to ensure the vehicles closest to the intersection can make reservations first. This process preserves the First-In-First-Out queueing used by the intersection. The reservations made during recovery are based on the fastest available arrival time, allowing vehicles to accelerate and the transportation network recovery. This process is repeated until vehicular traffic flow recovers back to normal. The recovery process mimics traffic flow theory following a delay. Cyberattacks can begin again following the recovery period.
Simulation Parameters
The following simulation parameters were established for the simulation:
• 1,500 s run time (20-minute simulation + 5-minute warmup).
• Five simulations were performed per scenario.
• 13.4 m/s maximum simulation speed.
• Five-minute delay time + 5-min recovery time.
• Nineteen attack scenarios—grouped into seven attack scenario groups (Supplementary Table 1)
Results and Discussion
The following section details the analysis methodology, the results produced by the simulation, and the analysis performed using the method described above. The results focus on the operational impact from each scenario and how the different severities of attack impact the vehicles. The analysis includes quantifying the effects of each scenario on operations and statistical analysis using T-tests and Chi-Squared tests. Next, the two attacks are compared to determine differences and similarities in their impacts on the transportation network’s efficiency.
Measures of Effectiveness
The main measure of effectiveness (MOE) used to study the impact of cyberattacks on vehicle traffic flow was the travel time delay introduced to the system. The travel time delay was calculated using the average time spent in the simulation per vehicle for each scenario run compared to the base scenario. Travel time delay is one of the main MOEs used in traffic analysis and indicates how vehicle traffic behaves in the simulation. Average travel speed per vehicle was also calculated and used in a visual format to provide a clear picture of travel speeds for each vehicle throughout the simulation.
Analysis Methodology
The analysis for this research focused on the average travel time delay per vehicle per simulation. The statistical analysis contained T-tests and Chi-squared tests for each scenario compared against the base scenario. The T-tests compared the means of each scenario against the mean of the base. The test used a 95% confidence interval to determine statistical significance. Chi-squared tests quantified the variance of each scenario compared to the base. Using the 95% confidence interval, if the test came back above that threshold, the test scenario had a variance outside the expected range relative to the base. The numerical analysis quantified the percent change of each scenario compared to the base. This calculation allowed the scenarios to be compared with the two attacks themselves.
Understanding the variance of the delay is important as traffic events like crashes and congestion occur more frequently with highly variable traffic flow. The Chi-squared test is used to determine if the variance falls outside of an expected range based on the base scenario. This would mean that the simulation runs within a scenario produced a wide range of travel time delay results. A wide variety of results could significantly impact travel time. High levels of variance also result in a less reliable transportation network.
The final analysis technique, calculating the percent change from the base to each scenario, represents a quantifiable difference in the results from each scenario. The percent change is an easily understood metric of impact representing the magnitude of the attack’s travel time delay. The results can draw conclusions and correlations between attack severity and resulting travel time delay. They can also be used to scale the impact to a more realistic period—taking the results from a small-scale test and applying them to larger networks, especially during the peak hours of demand.
Denial of Service Attack Analysis
The first calculations were performed to test the variance for each scenario. T-tests and Chi-Squared tests were also conducted for all scenarios using average simulation time per scenario, each being compared to the base scenario results. The results of these tests are shown below in Table 1.
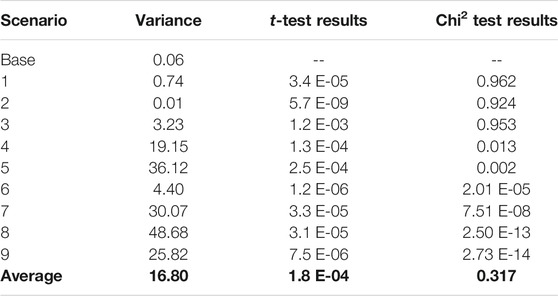
TABLE 1. DoS statistical analysis.
Table 1 shows that: 1) Every scenario produced a significantly smaller test result than the 95% confidence interval threshold of 0.05. This test shows no overlap between the results of the different scenarios compared to the base scenario. 2) The variance increases significantly after scenario 3, except for scenario 6.
The results of the Chi-Squared tests confirm this as only Scenarios 1, 2, and three produced higher test results than the 95% confidence interval threshold. This relationship is significant as it shows that a higher number of infected RSUs and an increased likelihood of success impact the outcome’s variance. It can also be inferred that the number of infected RSUs has a higher impact on the variance of the results than the likelihood of attack. There is no clear trend among the scenario groupings that shows the likelihood of attack impacts the variance.
From the variation calculations, it is clear how a widespread attack can introduce a high level of chaos into the transportation network. Decision-makers must understand these variance calculations to mitigate future attacks and build a robust connected vehicle environment.
The next series of calculations were performed to quantify the actual impact of the DoS attacks on vehicle travel time. As mentioned previously, the travel time delay added to each vehicle in the simulation is the most meaningful measure of an attack’s impact on the transportation network. Table 2 shows each scenario’s average simulation time per vehicle and provides simple comparisons to the base scenario to show the relative impact of each attack.
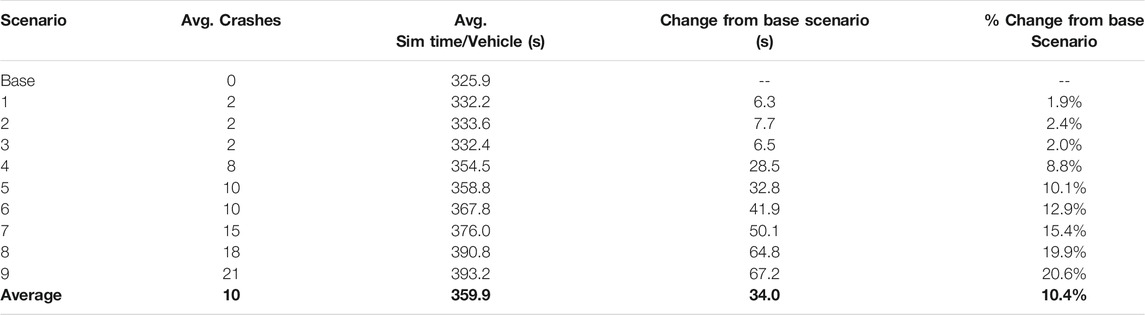
TABLE 2. DoS scenarios - relative travel time delay.
The takeaway from the above calculations is a clear impact threshold once six or more RSUs are infected. From scenario three to scenario 4, there is a 22-s increase in travel time delay, and the delay gets increasingly higher with each of the successive scenarios. The worst-case scenario (scenario 9) presents an over twenty percent increase from the baseline scenario. A twenty percent loss of efficiency for the transportation network is considerable - especially if the attack were to be conducted during peak hours. On a microscopic level, vehicles that have been delayed at the compromised intersections would feel a considerably more significant amount of travel time delay. The delay introduced to them was enough to impact the network’s efficiency drastically. Figure 1 provides a graphical representation of the correlation between compromised RSUs and the average simulation time per vehicle.
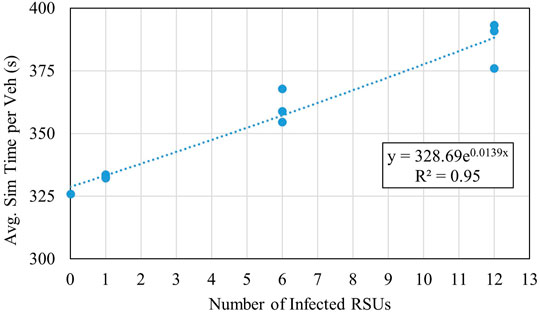
FIGURE 1. DoS Infected RSUs vs Travel Time.
The exponential curve demonstrates a heavy correlation between the number of infected RSUs and travel time (R2 = 0.95). The high correlation shows that as the attack scenarios get more severe, their impact on the transportation network delay also increases exponentially. These results directly support the conclusions drawn from the variance calculations that as the severity and number of compromised RSUs increase, the consequences become increasingly challenging to manage. One takeaway from the data analysis is that limiting the initial damage of a DoS attack is one of the most crucial steps in maintaining the transportations network’s integrity in a compromised setting.
Another important aspect of transportation network efficiency is throughput—how many vehicles are making it through the simulation during each scenario. Figure 2 presents the overall trend in vehicle throughput for each attack severity.
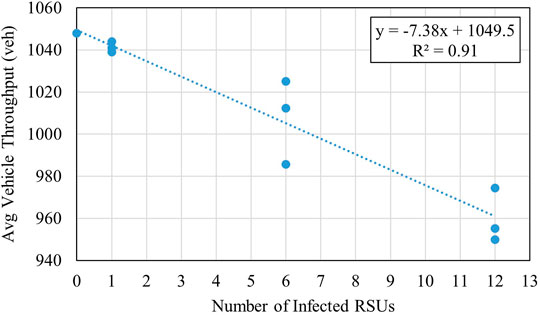
FIGURE 2. Infected RSUs’ impact on average throughput—DoS.
The figure confirms a strong correlation between increased scenario severity and decreased operational performance (R2 = 0.91). It can also be seen that scenarios 1–3 remain relatively consistent in terms of throughput. In contrast, the others consistently suffer, indicating that a threshold for increasingly poor operational performance exists for the subsequent scenarios. The space between each data point for scenarios with more than one infected RSU further highlights the increase in variance as attack severity increases.
As mentioned previously, the impact of a DoS attack’s effectiveness has not yet been explored. Logically, it would be expected that for each scenario grouping, an attack’s consequences would be worse for each increase in attack success rate. Table 3 investigates this assumption by comparing average simulation time per vehicle and average crashes for each scenario compared to the previous scenario.
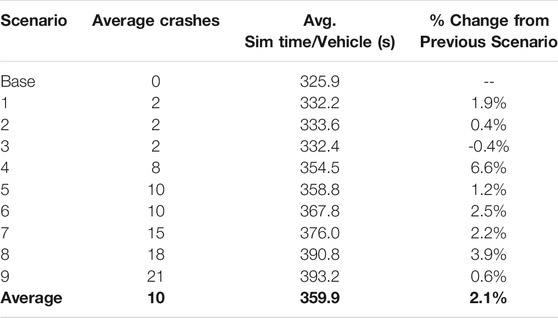
TABLE 3. DoS results compared by scenario.
Table 3 above further corroborates that as an attack scenario worsens (more RSUs or a higher chance of success), the attack’s impact is more pronounced on the transportation network. While the overall trend is true, there is no consistent increase in impact for each increase in intensity. The impact tends to be more severe, but the increase in severity appears random. It is also important to note that the percent increase for the individual MOEs are not comparable, as they are in different units and have different magnitudes of impact. An increase in two crashes is statistically more significant than an increase in 2 seconds of travel time.
Table 4 shows that the number of infected RSUs has a higher impact on vehicle traffic operations than the likelihood of success of the respective scenarios. Crashes rise with the increase of infected RSUs. In turn, as crashes rise, as does travel time delay within the street network. A scenario with six infected RSUs operating at a seventy-five percent attack rate will have less impact on the system than a scenario with twelve infected intersections operating at a twenty-five percent attack rate. The impact of each scenario group can be seen in Figure 3, which plots the average velocity per vehicle per timestep over time.
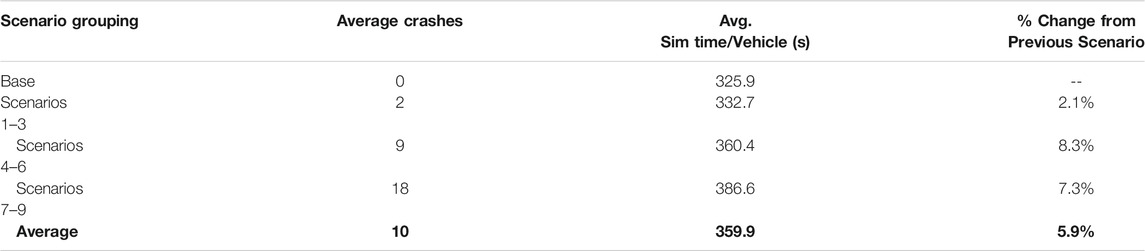
TABLE 4. DoS results compared by scenario group.
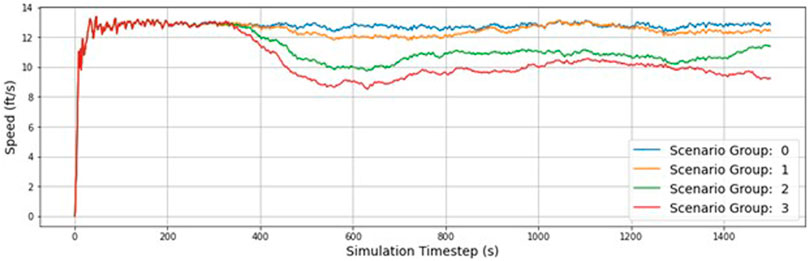
FIGURE 3. Vehicle speed per time step—DOS groups.
Figure 3 shows two significant dips in scenario groups 2 and 3, further emphasizing that the damage to the transportation network compounds seriously as attack severity increases. The two scenario groups feel the impacts from the attack throughout the simulation as they can never fully recover to normal operations.
Overall, a few main points have emerged from the DoS attack scenario data analysis. The first point is that a clear impact threshold exists between scenarios 0–three and scenarios 3–9. Put into words, as a DoS attack is more widespread throughout the transportation network, the more pronounced and severe its impacts become. This is a predictable result as more infected RSUs result in more crashes, increasing travel time delay. The primary mitigation strategy for a DoS attack is to limit its initial effectiveness to prevent a widespread network attack. It was also clear that the variance of results increases significantly as the attack scenarios grow more severe. The impact of one infected RSU is relatively easy to plan resilience concepts against, but as the attack severity increases, this becomes more difficult. The high variance makes specific resilience concepts challenging to implement as the attack’s impact can vary so much with each attack. The variance also impacts the reliability of the transportation network for those who depend on it. Finally, it was found that both likelihoods of success and scenario groupings impact the severity of the results. Scenario grouping is a better indicator of severity as a more widespread attack is inherently worse on the system, regardless of an attack’s likelihood of success.
MITM Attack Analysis
Like the DoS data analysis, the first step in analyzing MITM attack results was to analyze the variance and other statistical calculations of the results produced from each scenario. Table 5 shows the variance, t-test results, and Chi-Squared test results.
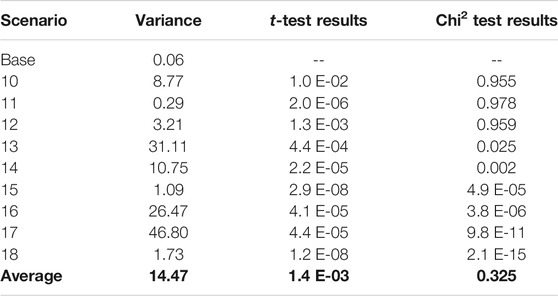
TABLE 5. MITM statistical analysis.
The T-tests were calculated to be under the 95% confidence threshold for all scenarios, showing that the results would never overlap with the base scenario.
The Chi-Squared value for Scenarios 10, 11, and 12 came back above the threshold. This means that these are the only scenarios that decision-makers could be confident in forecasting the resulting impact on the transportation network. The results could vary drastically for the other attacks, making resilience planning extremely difficult. The general trend shows an increase in variance as attack severity increases.
While the general trend for MITM attack variance generally increases with increased attack severity, this analysis does not tell the entire story. The increasing trend is characterized by relatively low variance with extreme spikes from scenarios 13, 16, and 17. If these three extreme cases are removed, the average variance is only 3.80 per scenario (excluding the base scenario), a relatively small variance given the inclusive average of 14.47.
MITM attacks appear to have a low variance in results, aside from a small number of highly chaotic scenarios, which means that the impacts of a MITM attack could be relatively easily predicted and planned for. Any highly variable cases make the job of decision-makers increasingly difficult when deciding on how to mitigate against MITM cyberattacks actively. The possibility of highly variable results broadens the scope of protecting the transportation network against an attack and introduces a level of chaos that should not be ignored. Suppose the extreme situations are not correctly accounted for. In that case, a high-impact attack could bypass any existing countermeasures and significantly impact the transportation network—effectively defeating any resiliency concepts introduced for the “average” scenario.
While the variance is essential for understanding the outcome of an attack, knowing how an attack will impact the transportation network is also important. Table 6 notes the average simulation time per vehicle in each MITM attack scenario and compares the results against the base scenario. Like the previous analysis, a clear impact threshold appears after scenario 12, once the number of infected RSUs increases from one to six. This threshold is expected as an increase in infected RSUs directly relates to an increase in negative impacts on the transportation network. After this threshold, each successive scenario carries an increasingly more significant impact on the travel time delay felt by the average vehicle in the network. The worst-case occurs during scenario 18 with an over twenty percent increase in average travel time per vehicle with the delay. As previously mentioned in the DoS section, an over twenty percent increase in travel time could significantly impact the transportation network during peak hours and in a larger scale environment. The main takeaway from this analysis is that after scenario 12, each attack scenario contributes more and more significant travel time delays to the network.
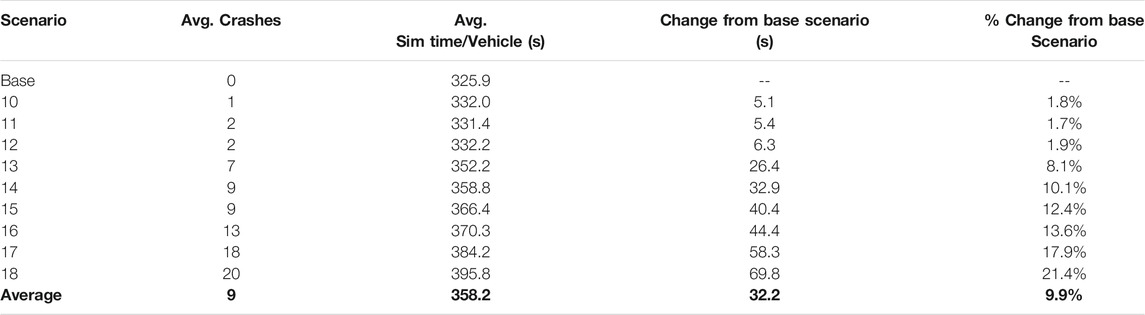
TABLE 6. MITM attack scenarios - relative travel time delay.
Figure 4 presents a high linear correlation (R2 = 0.91) between an attack’s severity and the impact the attack has on travel time. This correlation further demonstrates the need to limit an attack’s initial success, as a more widespread attack results in exponentially more significant impacts on the transportation network.
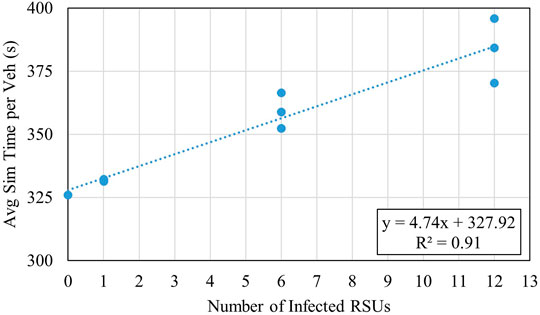
FIGURE 4. MITM Infected RSUs vs Travel Time.
Average vehicle throughput is also an indicator of transportation network performance under the different attack scenarios. While vehicle throughput is not an indicator in the simulation environment, it is still important to highlight network efficiency trends from a macroscopic level.
Figure 5 shows a clear correlation between attack severity and a decrease in average vehicle throughput with an R2 value equal to 0.90. The figure also demonstrates the threshold discussed previously, with continued higher impacts and increased severity after scenario 12, once more RSUs are infected. The throughput data agrees with the travel time delay data in that the transportation network is significantly impacted more as attack severity increases.
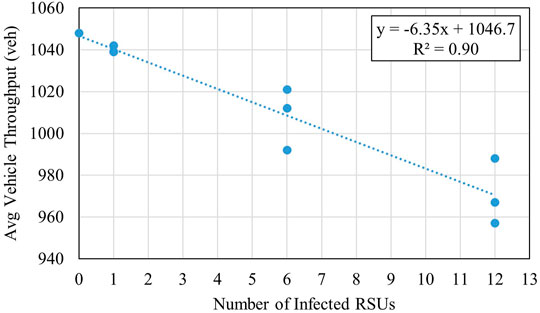
FIGURE 5. Average throughput per number of infected RSUs—MITM
Table 7 compares the percent change between scenario groupings to determine the impact of increasing the severity. The change between scenario groupings causes a more significant change in the outcomes than simply switching between the individual scenarios themselves (5.6% change vs 2.2%). This is expected as introducing more infected RSUs into the network results in more widespread disruption to vehicle traffic operations. More so than increasing the likelihood of a successful attack with a constant number of RSUs. To further understand the impact of each scenario group, Figure 6 displays the average vehicle speed for each time step in the simulation.

TABLE 7. MITM results compared by scenario group.
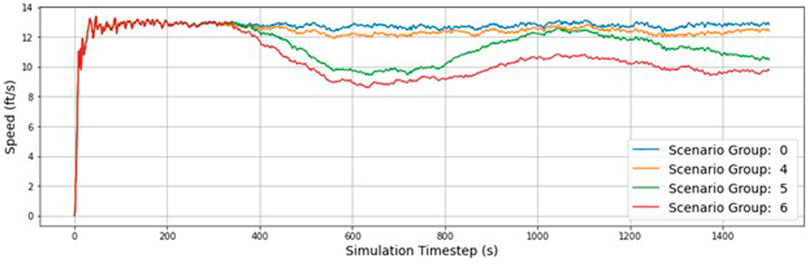
FIGURE 6. Vehicle speed per time step—MITM groups.
Figure 6 clearly shows the significance of scenario groups 5 and 6 on normal traffic operation during the simulation. There is a significant dip in speed that bottoms out just after 600 s. The plot shows the network recovering as speeds increase, but scenario six never recovers due to how widespread the attacks are.
The overall conclusions from the MITM attack data analysis are very similar to those made for DoS data analysis. One of the main themes in terms of data analysis is that increasing the number of RSUs has the most direct and significant impact on the operations and safety of the transportation network. This impact can be seen throughout the analysis in scenarios 13–18, where performance steadily decreases with each iteration of attack severity. One of the main points these attacks seem to diverge in data analysis is their variance per scenario. MITM attacks had a relatively low variance except for three scenarios with large spikes in variance. While the lower variance would benefit planners and decision-makers, the spikes in different scenarios present a troubling problem. It appears that at least some scenarios, seemingly without cause, can have higher variance—meaning significantly different efficiency results from different trial runs within a scenario.
Attack Comparison
It is important to compare the results of the attacks against each other at a high level to make general conclusions. This analysis will compare data already presented to show the similarities and differences between the impact of the two attacks – consisting primarily of average and summary data.
The average variance for each of the attacks will be compared first. DoS attacks had an average variance of 16.80, and MITM had an average of 14.47. The average variance for each attack is considerable, but they achieved these averages differently. For the DoS attacks, the variance increased as the attack scenarios became more severe. On the other hand, MITM attacks achieved their high variance through sporadic spikes in variance from three main scenarios. Aside from these three attacks, the variance for MITM attacks would have been considerably lower. However, these attacks occurred, and the results must be accounted for. Overall, the average variation did not change much from attack to attack. In fact, for both attacks, only the scenarios with one infected RSU achieved a Chi-Squared score within the 95% confidence interval threshold. This shows that although their path to high variance may be different, either way, the more severe attack scenarios result in high variance.
Depending on the traffic volume, an attack can have a wide range of impacts on the transportation network’s operations. A crash during rush hour at a busy urban intersection will have a considerably different impact than a crash in the middle of the day on a side street. The main conclusion drawn from this comparison is that a severe DoS attack and a severe MITM attack are extremely hard to predict and plan for confidently. Decision-makers must develop a resilience plan that takes the unpredictable nature of the impact of these attacks into account.
The variance shows the wide range of effects the impact of each attack could have. However, it is important to compare key measures of effectiveness themselves with the simulation data. Table 8 will compare the statistics for each of the related scenario groups for each attack. The simulation time for each will also be compared to the base scenario for reference.
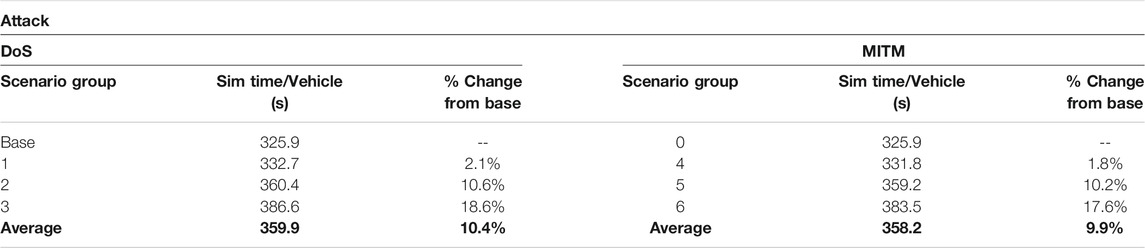
TABLE 8. Average simulation time per vehicle comparison.
The first trend is how similar the average result for each scenario group and the overall average results are. The DoS attacks have an average of 1.7 s more simulation time per vehicle, resulting in a 0.5% more travel time delay than the base scenario. This is an important finding as MITM attacks are often less impactful than a DoS attack. The above findings find very little difference between a well-executed severe DoS attack and a well-executed severe MITM attack. A well-positioned adversary could use various attacks to compromise the overall network, and correctly picking which areas of the transportation network to focus on could result in significant efficiency impacts on the network. Figure 7 provides the average speed per vehicle per timestep over simulation time for each scenario group. This provides a visual representation of how operations are impacted during the attack simulations.
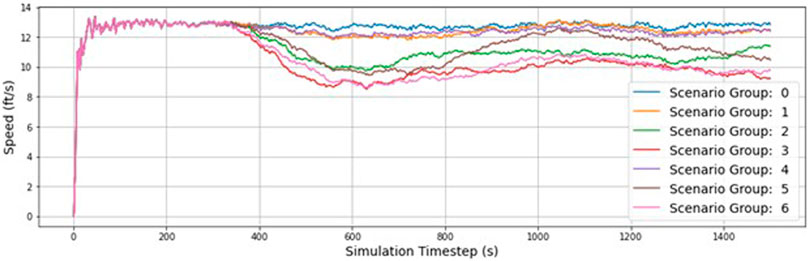
FIGURE 7. Average speed per time step—all Scenario groups.
Each of the attacks’ corresponding scenario groups (groups 1 and 4, 2 and 5, and 3 and 6) behave similarly. They experience very similar dips and recovery in speed, with one main exception. Scenario group 5 recovers to a much higher speed on average than scenario group 2, with its peak around 1,100 s. The figure also reiterates that scenario groups 1 and 4 behave similarly to the baseline scenario, especially the other attack groups. This graph visually represents the operational impacts of the widespread attacks shown in scenarios 2, 3, 5, and 6. These groups have significantly higher drops in speed and generally fail to recover during the simulation at a network scale.
A conclusion can be drawn between the simulated DoS and MITM attacks through multiple means of comparison - their impact on transportation network efficiency is nearly identical. This is an important concept to understand in developing a robust transportation network against cyberattacks. While this research focused on two significant cyberattacks, it has also shown a large variety of attacks an adversary can use to compromise the network in different ways. Understanding the impact of these attacks is the first step in understanding the risk they pose to the transportation network. Effectively understanding the possible risk of these attacks can help engineers gain a step on nefarious actors in the battle for cybersecurity.
Discussion
With the future development of intelligent transportation systems and CAVs, cybersecurity will soon come to the forefront of safety and efficiency concerns for transportation engineers. Understanding how cyberattacks can impact the safety and efficiency of intelligent vehicles is important when planning for them. Future transportation systems need to be cyber resilient to function properly. This research presented a baseline impact analysis of cyberattacks on efficiency and showed the possible negative impact on the transportation network. Other research has shown different aspects of cyberattacks against the VANET and ITS.
Key Findings
The findings from this research are important to show decision-makers the possible consequences of implementing emerging technologies without proper forethought to resilience. The key findings discussed previously in the results section are summarized below:
• Moderate to high severity DoS and MITM attacks carry similar operational impacts on the transportation network.
• Safety and resilience engineers must understand the impact of a wide variety of cyberattacks that carry with them a variety of impacts. Understanding these base impacts is important for resilience planning and metro regions.
• A threshold appeared that correlates to the number of impacted RSUs and the negative impact of the attack on vehicular traffic operations. The higher number of impacted RSUs corresponded to more impact.
• The number of successfully compromised RSUs had a higher impact on operations than an increase in attack likelihood for an attack with the same number of infected RSUs.
• Both attacks resulted in high variance of results for the travel time delay.
• A widespread attack, both MITM and DoS, represented a worst-case scenario for operations regardless of the attack’s success rate.
Research Applications
This research provided a baseline transportation efficiency analysis of cyberattacks against CAVs. The results and analysis provided by this research could be of importance to planners at all levels of transportation. Specifically, state and municipal DOTs who may not have the resources or expertise to quantify the possible negative impacts of cyberattacks against an unprotected connected environment could benefit from this. This research presents a worst-case scenario in an urban environment without proper cybersecurity countermeasures and resilience planning. Understanding the impact of attacks against the system is an important first step in developing resilience countermeasures and mitigation strategies. Without adequate planning and implementation, connected technologies present an opportunity for hackers to have a significant negative impact on the transportation system—negating their promised benefits.
Conclusion
The results from the simulations showed that as both DoS and MITM increased in severity, the negative impact on efficiency also increased. It was also found that the worst-case MITM and DoS attacks produced similar results, with both producing over a 20% increase in travel time delay. Simulation results also showed that the attack success rate does not matter once an attack becomes widespread through the system. This result shows that preventing an attack from spreading through the transportation network is extremely important to minimize the impact of an attack. Data analysis also showed that attacks carried a high level of variance with them. High variance in results makes the network itself less reliable and makes it difficult for planners to develop resilient network solutions for a wide range of results.
Overall, this research showed how important it is to develop proper cyber resilience plans for emerging technologies before their implementation. Engineers need to detect and react to cyberattacks to prevent them from spreading throughout the transportation network. Without proper resilience planning against cyberattacks, the network will be vulnerable to these attacks. If these attacks can spread without detection, they greatly impact transportation efficiency and reliability.
Data Availability Statement
The raw data supporting the conclusion of this article will be made available by the authors, without undue reservation.
Author Contributions
All authors listed have made a substantial, direct, and intellectual contribution to the work and approved it for publication.
Funding
Funding from the Commonwealth Cyber Initiative—Fellows Program.
Conflict of Interest
The authors declare that the research was conducted in the absence of any commercial or financial relationships that could be construed as a potential conflict of interest.
Publisher’s Note
All claims expressed in this article are solely those of the authors and do not necessarily represent those of their affiliated organizations, or those of the publisher, the editors and the reviewers. Any product that may be evaluated in this article, or claim that may be made by its manufacturer, is not guaranteed or endorsed by the publisher.
Acknowledgments
The authors would like to thank the Commonwealth Cyber Initiative for the financial support for this work. The contents of this manuscript have previously appeared online in the primary author’s published master’s thesis.
Supplementary Material
The Supplementary Material for this article can be found online at: https://www.frontiersin.org/articles/10.3389/ffutr.2022.792649/full#supplementary-material
References
Ahmad, F., and Adnane, A. (2016). “A Novel Context-Based Risk Assessment Approach in Vehicular Networks,” in 2016 30th International Conference on Advanced Information Networking and Applications Workshops (WAINA) (Crans-Montana, Switzerland: IEEE), 466–474. doi:10.1109/WAINA.2016.60
Ahmad, F., Adnane, A., Franqueira, V., Kurugollu, F., and Liu, L. (2018). Man-In-The-Middle Attacks in Vehicular Ad-Hoc Networks: Evaluating the Impact of Attackers' Strategies. Sensors. 18, 4040. doi:10.3390/s18114040
Al-kahtani, M. S. (2012). “Survey on Security Attacks in Vehicular Ad Hoc Networks (VANETs),” in 2012 6th International Conference on Signal Processing and Communication Systems (Gold Coast, Australia: IEEE), 1–9. doi:10.1109/ICSPCS.2012.6507953
Al-Sultan, S., Al-Doori, M. M., Al-Bayatti, A. H., and Zedan, H. (2014). A Comprehensive Survey on Vehicular Ad Hoc Network. J. Netw. Computer Appl. 37, 380–392. doi:10.1016/j.jnca.2013.02.036
Amoozadeh, M., Raghuramu, A., Chuah, C.-n., Ghosal, D., Zhang, H. M., Rowe, J., et al. (2015). Security Vulnerabilities of Connected Vehicle Streams and Their Impact on Cooperative Driving. IEEE Commun. Mag. 53, 126–132. doi:10.1109/MCOM.2015.7120028
Biswas, S., Misic, J., and Misic, V. (2012). “DDoS Attack on WAVE-Enabled VANET through Synchronization,” in 2012 IEEE Global Communications Conference (GLOBECOM) (Anaheim, CA, USA: IEEE), 1079–1084. doi:10.1109/GLOCOM.2012.6503256
Davidson, P., and Spinoulas, A. (2015). Autonomous Vehicles - what Could This Mean for the Future of Transport? Brisbane, Queensland: AITPM Traffic and Transport.
Eichler, S. (2007). “Performance Evaluation of the IEEE 802.11p WAVE Communication Standard,” in 2007, Performance Evaluation of the IEEE 802.11p WAVE Communication Standard IEEE 66th Vehicular Technology Conference (Baltimore, MD, USA: IEEE), 2199–2203. doi:10.1109/VETECF.2007.461
Ekedebe, N., Yu, W., Song, H., and Lu, C. (2015). On a Simulation Study of Cyber Attacks on Vehicle-To-Infrastructure Communication (V2I) in Intelligent Transportation System (ITS). in, eds. S. S. Agaian, S. A. Jassim, and E. Y. Du (Baltimore, Maryland, United States), 94970B. doi:10.1117/12.2177465
Fajardo, D., Au, T.-C., Waller, S. T., Stone, P., and Yang, D. (2011). Automated Intersection Control. Transportation Res. Rec. 2259, 223–232. doi:10.3141/2259-21
Ganin, A. A., Mersky, A. C., Jin, A. S., Kitsak, M., Keisler, J. M., and Linkov, I. (2019). Resilience in Intelligent Transportation Systems (ITS). Transportation Res. C: Emerging Tech. 100, 318–329. doi:10.1016/j.trc.2019.01.014
Garip, M. T., Gursoy, M. E., Reiher, P., and Gerla, M. (2015). “Congestion Attacks to Autonomous Cars Using Vehicular Botnets,” in Proceedings 2015 Workshop on Security of Emerging Networking Technologies (San Diego, CA: Internet Society). doi:10.14722/sent.2015.23001
Grover, J., Laxmi, V., and Gaur, M. S. (2013). Attack Models and Infrastructure Supported Detection Mechanisms for Position Forging Attacks in Vehicular Ad Hoc Networks. CSIT. 1, 261–279. doi:10.1007/s40012-013-0025-1
Intelligent Transportation Systems - ITS Program Overview (2021). United States Department of Transportation. Available at: https://www.its.dot.gov/factsheets/ITSJPO_overview.htm (Accessed April 20, 2021).
Kelarestaghi, K. B., Foruhandeh, M., Heaslip, K., and Gerdes, R. (2019). Survey on Vehicular Ad Hoc Networks and its Access Technologies Security Vulnerabilities and Countermeasures. arXiv preprint arXiv:1903.01541.
Krauß, S. (1998). Microscopic Modeling of Traffic Flow: Investigation of Collision Free Vehicle Dynamics. Berlin, Germany: UC Berkeley Transportation Library.
Lavasani, M., Jin, X., and Du, Y. (2016). Market Penetration Model for Autonomous Vehicles on the Basis of Earlier Technology Adoption Experience. Transportation Res. Rec. 2597, 67–74. doi:10.3141/2597-09
Litman, T. (2020). Autonomous Vehicle Implementation Predictions: Implications for Transport Planning
Lopez, P. A., Wiessner, E., Behrisch, M., Bieker-Walz, L., Erdmann, J., Flotterod, Y.-P., et al. (2018). “Microscopic Traffic Simulation Using SUMO,” in 2018 21st International Conference on Intelligent Transportation Systems (ITSC) (Maui, HI: IEEE), 2575–2582. doi:10.1109/ITSC.2018.8569938
McManus, I. (2021). The Impact of Cyberattacks on Safe and Efficient Operations of Connected and Autonomous Vehicles. Virginia Tech (Doctoral dissertation).
National Highway Traffic Safety Administration (2017). Automated Vehicles for Safety. Washington, DC: NHTSA. Available at: https://www.nhtsa.gov/technology-innovation/automated-vehicles (Accessed February 19, 2021).
SAE International (2018). Standard J3016: Taxonomy and Definitions for Terms Related to Driving Automation Systems for On-Road Motor Vehicles.
Sommer, C., German, R., and Dressler, F. (2011). Bidirectionally Coupled Network and Road Traffic Simulation for Improved IVC Analysis. IEEE Trans. Mobile Comput. 10, 3–15. doi:10.1109/TMC.2010.133
Sumra, I. A., Ahmad, I., Hasbullah, H., and Iskandar, B. S. (2011). “Behavior of Attacker and Some New Possible Attacks in Vehicular Ad Hoc Network (VANET),” in 2011 3rd International Congress on Ultra Modern Telecommunications and Control Systems and Workshops (ICUMT) (Budapest, Hungary.
TraCI - SUMO Documentation (2021). Available at: https://sumo.dlr.de/docs/TraCI.html (Accessed July 12, 2021).
Waymo, L. L. C. (2020). Waymo Safety Report. Available at: https://storage.googleapis.com/sdc-prod/v1/safety-report/2020-09-waymo-safety-report.pdf.
What is OMNeT++? (2021). Available at: https://omnetpp.org/intro/(Accessed July 12, 2021).
Keywords: cyberattack, traffic (operational) efficiency, modeling, impact analysis, VANET, CAVs, traffic simulation
Citation: McManus I and Heaslip K (2022) The Impact of Cyberattacks on Efficient Operations of CAVs. Front. Future Transp. 3:792649. doi: 10.3389/ffutr.2022.792649
Received: 10 October 2021; Accepted: 10 January 2022;
Published: 27 January 2022.
Edited by:
Lipika Deka, De Montfort University, United KingdomReviewed by:
Ali Balador, Universitat Politècnica de València, SpainMhafuzul Islam, General Motors, United States
Copyright © 2022 McManus and Heaslip. This is an open-access article distributed under the terms of the Creative Commons Attribution License (CC BY). The use, distribution or reproduction in other forums is permitted, provided the original author(s) and the copyright owner(s) are credited and that the original publication in this journal is cited, in accordance with accepted academic practice. No use, distribution or reproduction is permitted which does not comply with these terms.
*Correspondence: Ian McManus, ianm61@vt.edu