Wuling Mountains Function as a Corridor for Woody Plant Species Exchange Between Northern and Southern Central China
 Congrong Wang1,2
  Tianyang Zhou1,2 Yuanzhi Qin1,2 Gang Zhou1,2 Yanan Fei1,2 Yaozhan Xu1
  Zhiyao Tang3
  Mingxi Jiang1,4
  Xiujuan Qiao1,4*
- 1Key Laboratory of Aquatic Botany and Watershed Ecology, Wuhan Botanical Garden, Chinese Academy of Sciences, Wuhan, China
- 2University of Chinese Academy of Sciences, Beijing, China
- 3Key Laboratory for Earth Surface Processes of the Ministry of Education, Department of Ecology, College of Urban and Environmental Sciences, Peking University, Beijing, China
- 4Center of Conservation Biology, Core Botanical Gardens, Chinese Academy of Sciences, Wuhan, China
Aim: Wuling Mountains range from the northeast to southwest in Central China, a region with high habitat complexity and diversity that supports substantial plant species diversity. Connecting the northern subtropics to the mid-subtropics, Wuling Mountains also link the floras of Eastern and South-Western China. Despite a long-standing interest in how important role Wuling Mountains play in species exchange, patterns of plant species diversity in Wuling and their underlying drivers are still not well characterized. Here, the spatial distribution of woody plant species in this region is described and the role the Wuling Mountains play in structuring biodiversity in surrounding areas is explored.
Location: Wuling Mountains and adjacent regions, China.
Methods: Detailed distribution data for woody plant species in China were collected and mapped onto a raster grid of the Wuling Mountains and adjacent regions (a total of 820,000 km2) to analyze spatial patterns in species diversity, including α-diversity (species richness) and β-diversity (βsor). Unweighted pair-group method using arithmetic averages (UPGMA) clustering was used to divide the study region based on species composition. Canonical redundancy analysis was used to illustrate spatial patterns and species-environment relationships.
Results: Mountainous areas in the study region have high species richness as compared to other areas. Species exchanges occurred at a greater rate latitudinally vs. longitudinally, especially in Wuling Mountains. This suggests that Wuling Mountains may be an important ecological corridor for woody species, linking Northern and Southern Chinese floras. The study region was divided into six bioregions based on species composition: the Wuling Mountains Region, Nanling-Xuefengshan Mountains Region, Qinling-Dabashan Mountains Region, Sichuan Basin Region, Yangtze Plain Region and Yungui Plateau Region.
Main Conclusions: The Wuling Mountains Region acts as an ecological corridor for woody species, linking Northern and Southern China, and fostering biodiversity exchange and conservation in Central China.
Introduction
How species richness is distributed and the implications of richness patterns for biodiversity conservation have received long-standing interest in ecology and biogeography (Currie and Paquin, 1987; Gaston, 2000; Kreft and Jetz, 2007). While more than one hundred hypotheses have been proposed to explain observed species richness patterns, there remains no generally accepted theory. For example, regional climatic variation (Currie et al., 2004; Warren et al., 2005; O’Brien, 2006), geologic history (Ricklefs, 1987), land area (Chown and Gaston, 2000) and habitat heterogeneity (Kerr and Packer, 1997) have all been proposed to explain patterns in species richness. Human-induced environmental changes can also alter biodiversity patterns via local species extinctions (Pimm et al., 2014), especially in areas with a long history of human disturbance.
With high habitat heterogeneity and unreachable areas, mountainous regions can serve as both refuges (Tang et al., 2006) and cradles (Lu et al., 2018) for biodiversity, conserving diverse species assemblages (Fang, 2004; Orme et al., 2005). In the Northern Hemisphere, China harbors a diverse array of seed plant species, with high numbers of endemic and endangered species (Ying, 2001; Wang et al., 2015; Mi et al., 2021). However, due to land use changes in recent decades, many natural habitats in the lowlands have been destroyed, resulting in a rapid loss of biodiversity in China (Fang, 2004). Therefore, the question of how to protect as many species as possible is an important research topic for Chinese biodiversity conservation. Fortunately, within China, mountainous regions have slower rates of species loss, retaining important biological resources for the country (Fang, 2004). Ying (2001) identified three regions with particularly high biodiversity, i.e., biodiversity “hotspots”: the Hengduan range, Central China and the Lingnan region. All three are located in the mountainous area of South-Central China. Among these regions, the flora in Central China is the most representative of the Chinese flora overall, with high levels of endemism (Ying, 2001; Song et al., 2013); part of the North Temperate zone, Central China is known worldwide for its ancient, complex and rich temperate flora (Qi et al., 1995).
Generally, high mountains act as barriers to prevent biological dispersal (Bănărescu, 1992). However, many mountain ranges may be more permeable to biological diffusion than is commonly believed (e.g., Slechtova et al., 2004). For example, passes occur at irregular intervals along mountain ranges and can act as corridors for dispersal (McDowall, 1990; Harrison and Lawton, 1992; Harding, 1994; Williams et al., 2001; Craw et al., 2010). In New Zealand, the Pyrenees and the Alps are important channels linking North-Western Europe to the Iberian and Italian, respectively (Taberlet et al., 1998; Hewitt, 2000). Such cases have also been reported for the Korean Peninsula of East Asia. For example, during the Quaternary period, the Baekdudaegan Mountains acted as a dispersal corridor for a large assemblage of boreal and temperate species (Chung et al., 2017). In China, the corridor function of mountains has received little attention (in terms of how they influence plant distributions) as compared to the shelter function (i.e., biodiversity conservation). Yet consideration of the potential dual role of mountainous regions (corridor and shelter) may provide a new way to systematically study geographical patterns in subtropical species distribution in China. Characterizing species distributions in mountainous areas will not only improve our understanding of the effects of mountain passes on species diversity, but also strengthen local biodiversity conservation efforts and aid in predicting species responses to climate change (Wu et al., 2017).
To date, the species richness and community composition of many taxonomic groups has been described for various mountain ranges (Sanders and Rahbek, 2012; Peters et al., 2016). Species richness is the most commonly used indicator of α-diversity and directly reflects species distribution patterns. β-diversity measures the spatial turnover in species composition among communities across space; it is closely related to regional species pools and large-scale patterns in species richness (Whittaker, 1960; Tuomisto, 2010; Kraft et al., 2011). Greater understanding of the processes that create and maintain biodiversity can be gained through the evaluation of β-diversity (e.g., Tuomisto et al., 2003; Anderson et al., 2011; Kraft et al., 2011). Previous studies have shown that β-diversity varies when evaluated in different geographical directions (north, east, etc.), potentially reflecting directional differences in species distribution patterns (Lennon et al., 2001; Qian et al., 2005; Gaston et al., 2007).
Wuling Mountains (Wuling for short) are a northeast-to-southwest oriented mountain range in the middle of Central China; Wuling acts as a barrier between Sichuan Basin to the west and Yangtze Plain to the east, but joins Qinling-Daba Mountains in the north with Yungui Plateau in the south (Figure 1). The vegetation in Wuling is complex and diverse, showing both latitudinal and altitudinal gradients; vegetation types include subtropical evergreen broad-leaved forests, evergreen broad-leaved and deciduous broad-leaved mixed forests, deciduous broad-leaved forests and subalpine coniferous forests (Ying, 2001). There are approximately 4,119 species of seed plants belonging to 201 families and 1,005 genera in Wuling, accounting for 59.64% and 31.41% of all families and genera in China, respectively (Chen et al., 2001). Of these, 2682, 570 and 126 species are endemic to China, Central China and Wuling, respectively (Chen et al., 2001). Additionally, there are 72 endemic seed plant genera in China and 32 rare and endangered plants in the Wuling. The Wuling has been identified as the most representative region within China for its overall flora (Qi et al., 1995). In terms of floristic composition, Wuling is a central corridor that allows the East Asian flora to migrate and spread both eastward and northward from the mountainous areas of South-West China (Chen et al., 2001); the Wuling corridor is connected to Qinling Mountains in the north and Nanling Mountains in the south (Wang, 1992). However, previous studies of mountain corridors in this region were limited in that they examined only species from certain families or genera; the distributions of all woody plant species were not analyzed. As important habitat-forming species, woody plants play a key role in structuring species distributions in montane regions, and they are therefore also critical for biodiversity conservation.
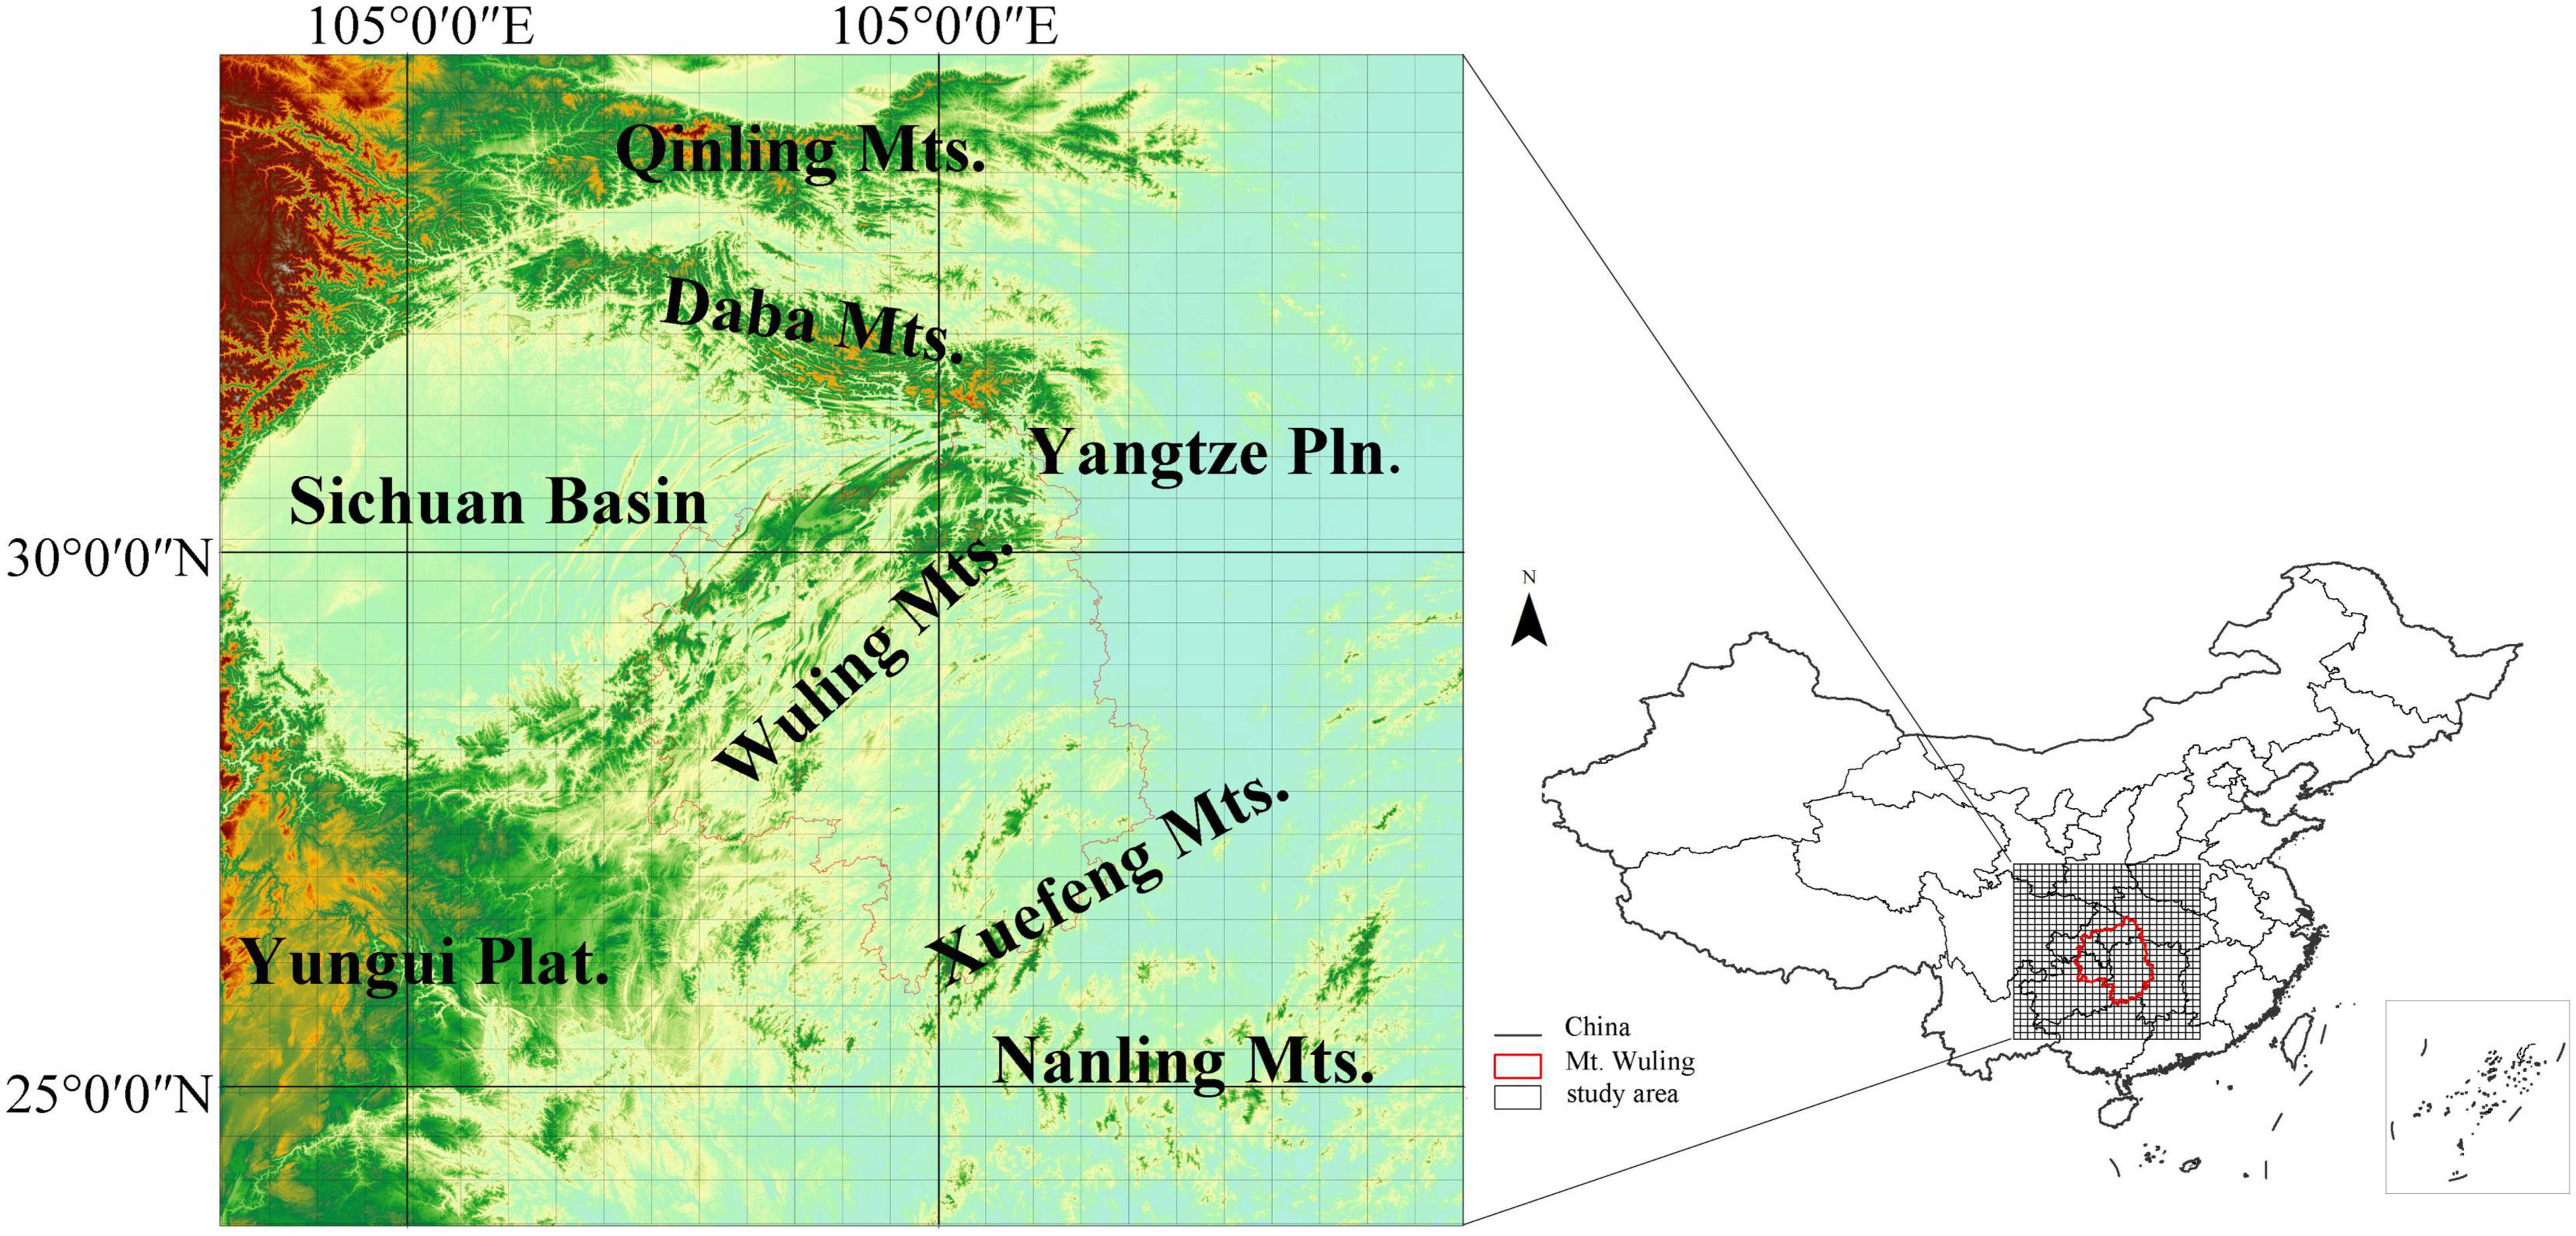
Figure 1. The location of the study region with a raster grid overlaid. The red line delineates the Wuling Mountains.
In this study, biodiversity and biogeographic patterns were assessed for Central China using a previously-compiled comprehensive atlas of woody plant species in China (Fang et al., 2011; Wang et al., 2011). Spatial analysis was used to examine large-scale spatial patterns and species exchanges. Specifically, the following hypotheses regarding exchanges of woody plant species in Central China were explored: (1) What is the distribution of woody plant diversity in Central China? (2) Are Wuling Mountains an important corridor for woody plant migration? (3) What are the limiting factors that affect woody plant distributions in Central China?
Materials and Methods
Study Area
This study was carried out in the Wuling Mountains and surrounding areas in Central China (Figure 1). The Wuling Mountains extend northeast from the Yunnan-Guizhou (Yungui) Plateau, covering an area of about 100,000 km2 from 27.28°N-30.05°N and 107.02°E-111.33°E and ranging from ca. 100–2,570 m in altitude (Chen et al., 2001). The mountain range belongs to the transitional region between Dongting Plain and Yunnan-Guizhou Plateau, joining the Qinling Mountains in the north (an important physical and geographical boundary in China) and the Nanling Mountains in the south (in the watershed between the Yangtze and Pearl River). This region experiences a subtropical monsoon humid climate; the mean annual temperature ranges from 13.1–17.5°C and annual precipitation from 1,061–1,500 mm (Chen et al., 2001). Broad-leaved evergreen forests, evergreen and deciduous broad-leaved mixed forests, deciduous broad-leaved forests and subalpine coniferous forests represent climax communities in the region, each distributed in a different altitudinal zone. The study region represents a hotspot for plant species diversity in Central China (Ying, 2001), and is known as a refuge for ancient plant species, such as Metasequoia glyptostroboides, Davidia involucrata and Liriodendron chinense (Qi et al., 1998).
Species Distribution Data
Species distribution data were extracted from a national database (Fang et al., 2011) containing county-level distribution data for a total of 11,405 woody species. There were 6,523 woody species identified in the study area, of which 2,853 are endemic species to China. To reduce sampling bias caused by unequal numbers of counties, we mapped the county-level distributions onto 2,500 km2 grid cells. A county list for each grid cell was created using the spatial link tool in ArcGIS, and a species list for each grid cell obtained by removing duplicates from the pooled species list for all counties assigned to the grid cell. The lists were then used to obtain a species-level presence-absence matrix for all 728 grid cells (Figure 1). Data manipulations were carried out in ArcGIS (10.2).
Species Richness Calculations
To evaluate spatial variation in species richness, the number of species was calculated for each cell, and these data used to obtain a map of woody plant α diversity in the region. Note the number of species in each grid cell was taken as the species richness of the cell.
To quantify spatial turnover in species composition, taxonomic turnover was calculated between each pair of grid cells. The Sørensen dissimilarity index (βsor) was used to measure taxonomic turnover (Baselga and Orme, 2012). βsor was calculated as:
where “a” is the number of shared species between two cells; “b” is the number of species unique to the least species rich cell; and “c” is the number of species unique to the most species rich cell (Baselga and Orme, 2012). βsor ranges from zero (if species composition is identical between grid cells) to one (if there are no shared species). Importantly, βsor is independent of differences in species richness among grid cells (Baselga and Orme, 2012; Leprieur and Oikonomou, 2014) and therefore provides an unbiased estimation of compositional turnover.
Maps of species turnover were generated using a moving-window algorithm: a cell was positioned in the lower left corner over cells in two directions (north, east) and the βsor calculated (for the pair) at several different scales.
Latitudinal (N-S) and longitudinal (E-W) beta diversity were estimated. In order to describe how βsor was related to distance in each case, the following formula was used:
where D is distance. The slope, k, represents the rate of change in species dissimilarity with distance and was used as a measure of beta diversity for each case. βNS and βEW represent beta diversity along latitudinal (north-south) and longitudinal (east-west) axes, respectively. This analysis was carried out at a 50 km scale.
The above analysis was completed in R 4.0.2 (R Core Team, 2016) using the “betapart” package (Baselga and Orme, 2012) and was visualized in ArcGIS (10.2).
Cluster Analysis and Redundancy Analysis
Seven hierarchical clustering algorithms were used to group study grid cells based on the chord distance matrix: (1) single linkage (SL), (2) complete linkage (CL), (3) weighted pair-group method using centroids (WPGMC), (4) unweighted pair-group method using arithmetic averages (UPGMA), (5) unweighted pair-group method using centroids (UPGMC), (6) weighted pair-group method using arithmetic averages (WPGMA), and (7) Ward’s minimum variance (ward.D2). Cophenetic correlation coefficients and Gower’s distance were used to select the most suitable clustering methods (Cai, 2020). Cophenetic correlation assesses the relationship between the original distance matrix and the cophenetic distance matrix. As the cophenetic correlation increases, Gower’s distance decreases. Therefore, higher cophenetic correlations are indicative of clustering results being more representative of the original chord distance matrix (Borcard et al., 2011). By comparing all algorithms, UPGMA was found to produce the best clustering results (Supplementary Table 1).
The optimal number of clusters was determined by applying the Kelley Gardner Sutcliffe penalty function; this function maximizes the differences between groups and the cohesiveness within groups, and its minimum value corresponds to the optimal number of clusters (Kelley et al., 1996). The Kelley-Gardner Sutcliffe penalty function was implemented using the “maptree” package (White and Gramacy, 2012) in R (4.0.2).
Canonical redundancy analysis (RDA) was used to illustrate relationships between the clusters and Bioclimatic variables. Nineteen Bioclimatic factors were extracted from WorldClim1 for use as explanatory variables (Supplementary Table 2). The expansion coefficients (vif) of each bioclimatic variables was calculated, and variables with strong collinearity removed. After variable reduction, six variables remained for use as explanatory variables in the RDA (Supplementary Table 3); species presence-absence data for each grid cell saved as the response variable (Fick and Hijmans, 2017). The significance of relationships was tested using Monte Carlo permutation tests. The above analyses were performed in R (4.0.2) using the “vegan” package (Dixon, 2003).
Results
α-Diversity Distribution Patterns
The number of species in each grid cell is shown in Figure 2A. Generally, species richness decreased from south to north; however, species richness on the Yangtze Plain and in the Sichuan Basin were lower than in other areas, while species richness was generally higher in the montane regions (Figure 2A). The grid cell with the greatest number (2,346) of species was located on Yungui Plateau, at the junction of Guizhou and Guangxi provinces.
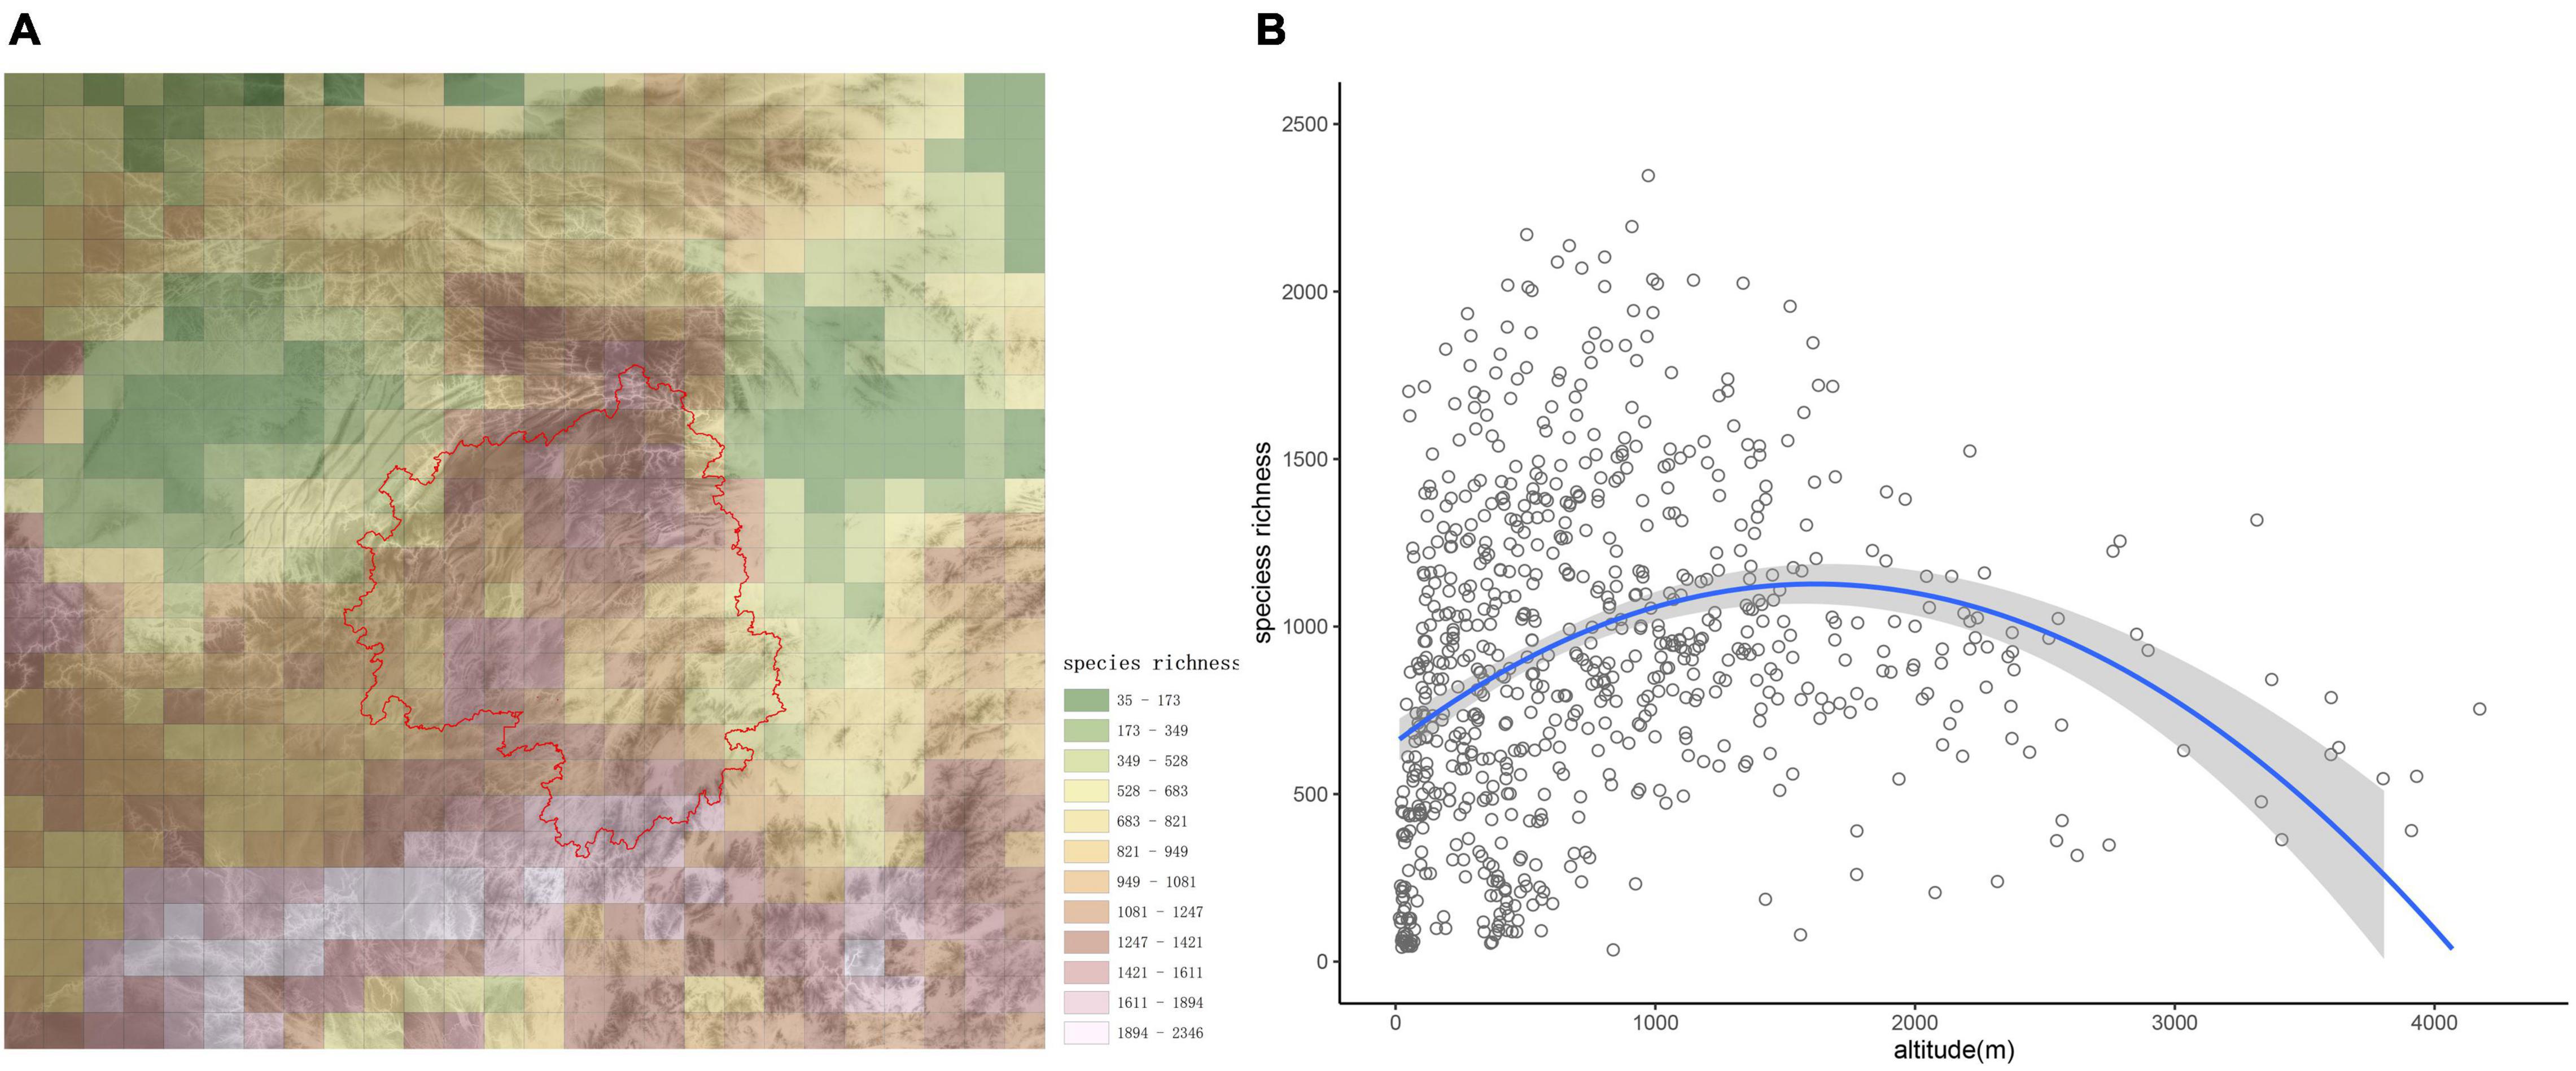
Figure 2. Species distribution patterns in the studied region. (A) α-diversity of woody plant species in the study area, with different colors indicating species richness categories. The base graphic is a topographic map, and the red line delineates Wuling Mountains. (B) Altitudinal patterns of species richness are presented for the study area. The regression equation was y = −0.0002x2 + 0.5848x + 654.82 (p < 0.001).
From the scatterplot in Figure 2B, species richness first increased with altitude, then decreased after about 1,500 m; therefore, species richness was maximized at mid-elevations. The high biodiversity observed in montane areas reflects the important role mountains play in biodiversity conservation.
β-Diversity Distribution Patterns
The spatial distribution of woody plant species turnover at different scales (50, 100, 150, and 200 km) revealed lower βsor diversity in montane areas (Figure 3). For Wuling Mountains, as compared to surrounding areas, latitudinal βsor diversity was lower at all scales; however, higher longitudinal βsor values were observed for some montane regions, especially at the junction of Wuling Mountains and Yangtze Plain (Figure 3). It is worth noting that βsor was significantly lower and species similarity significantly higher longitudinally vs. latitudinally in Wuling.
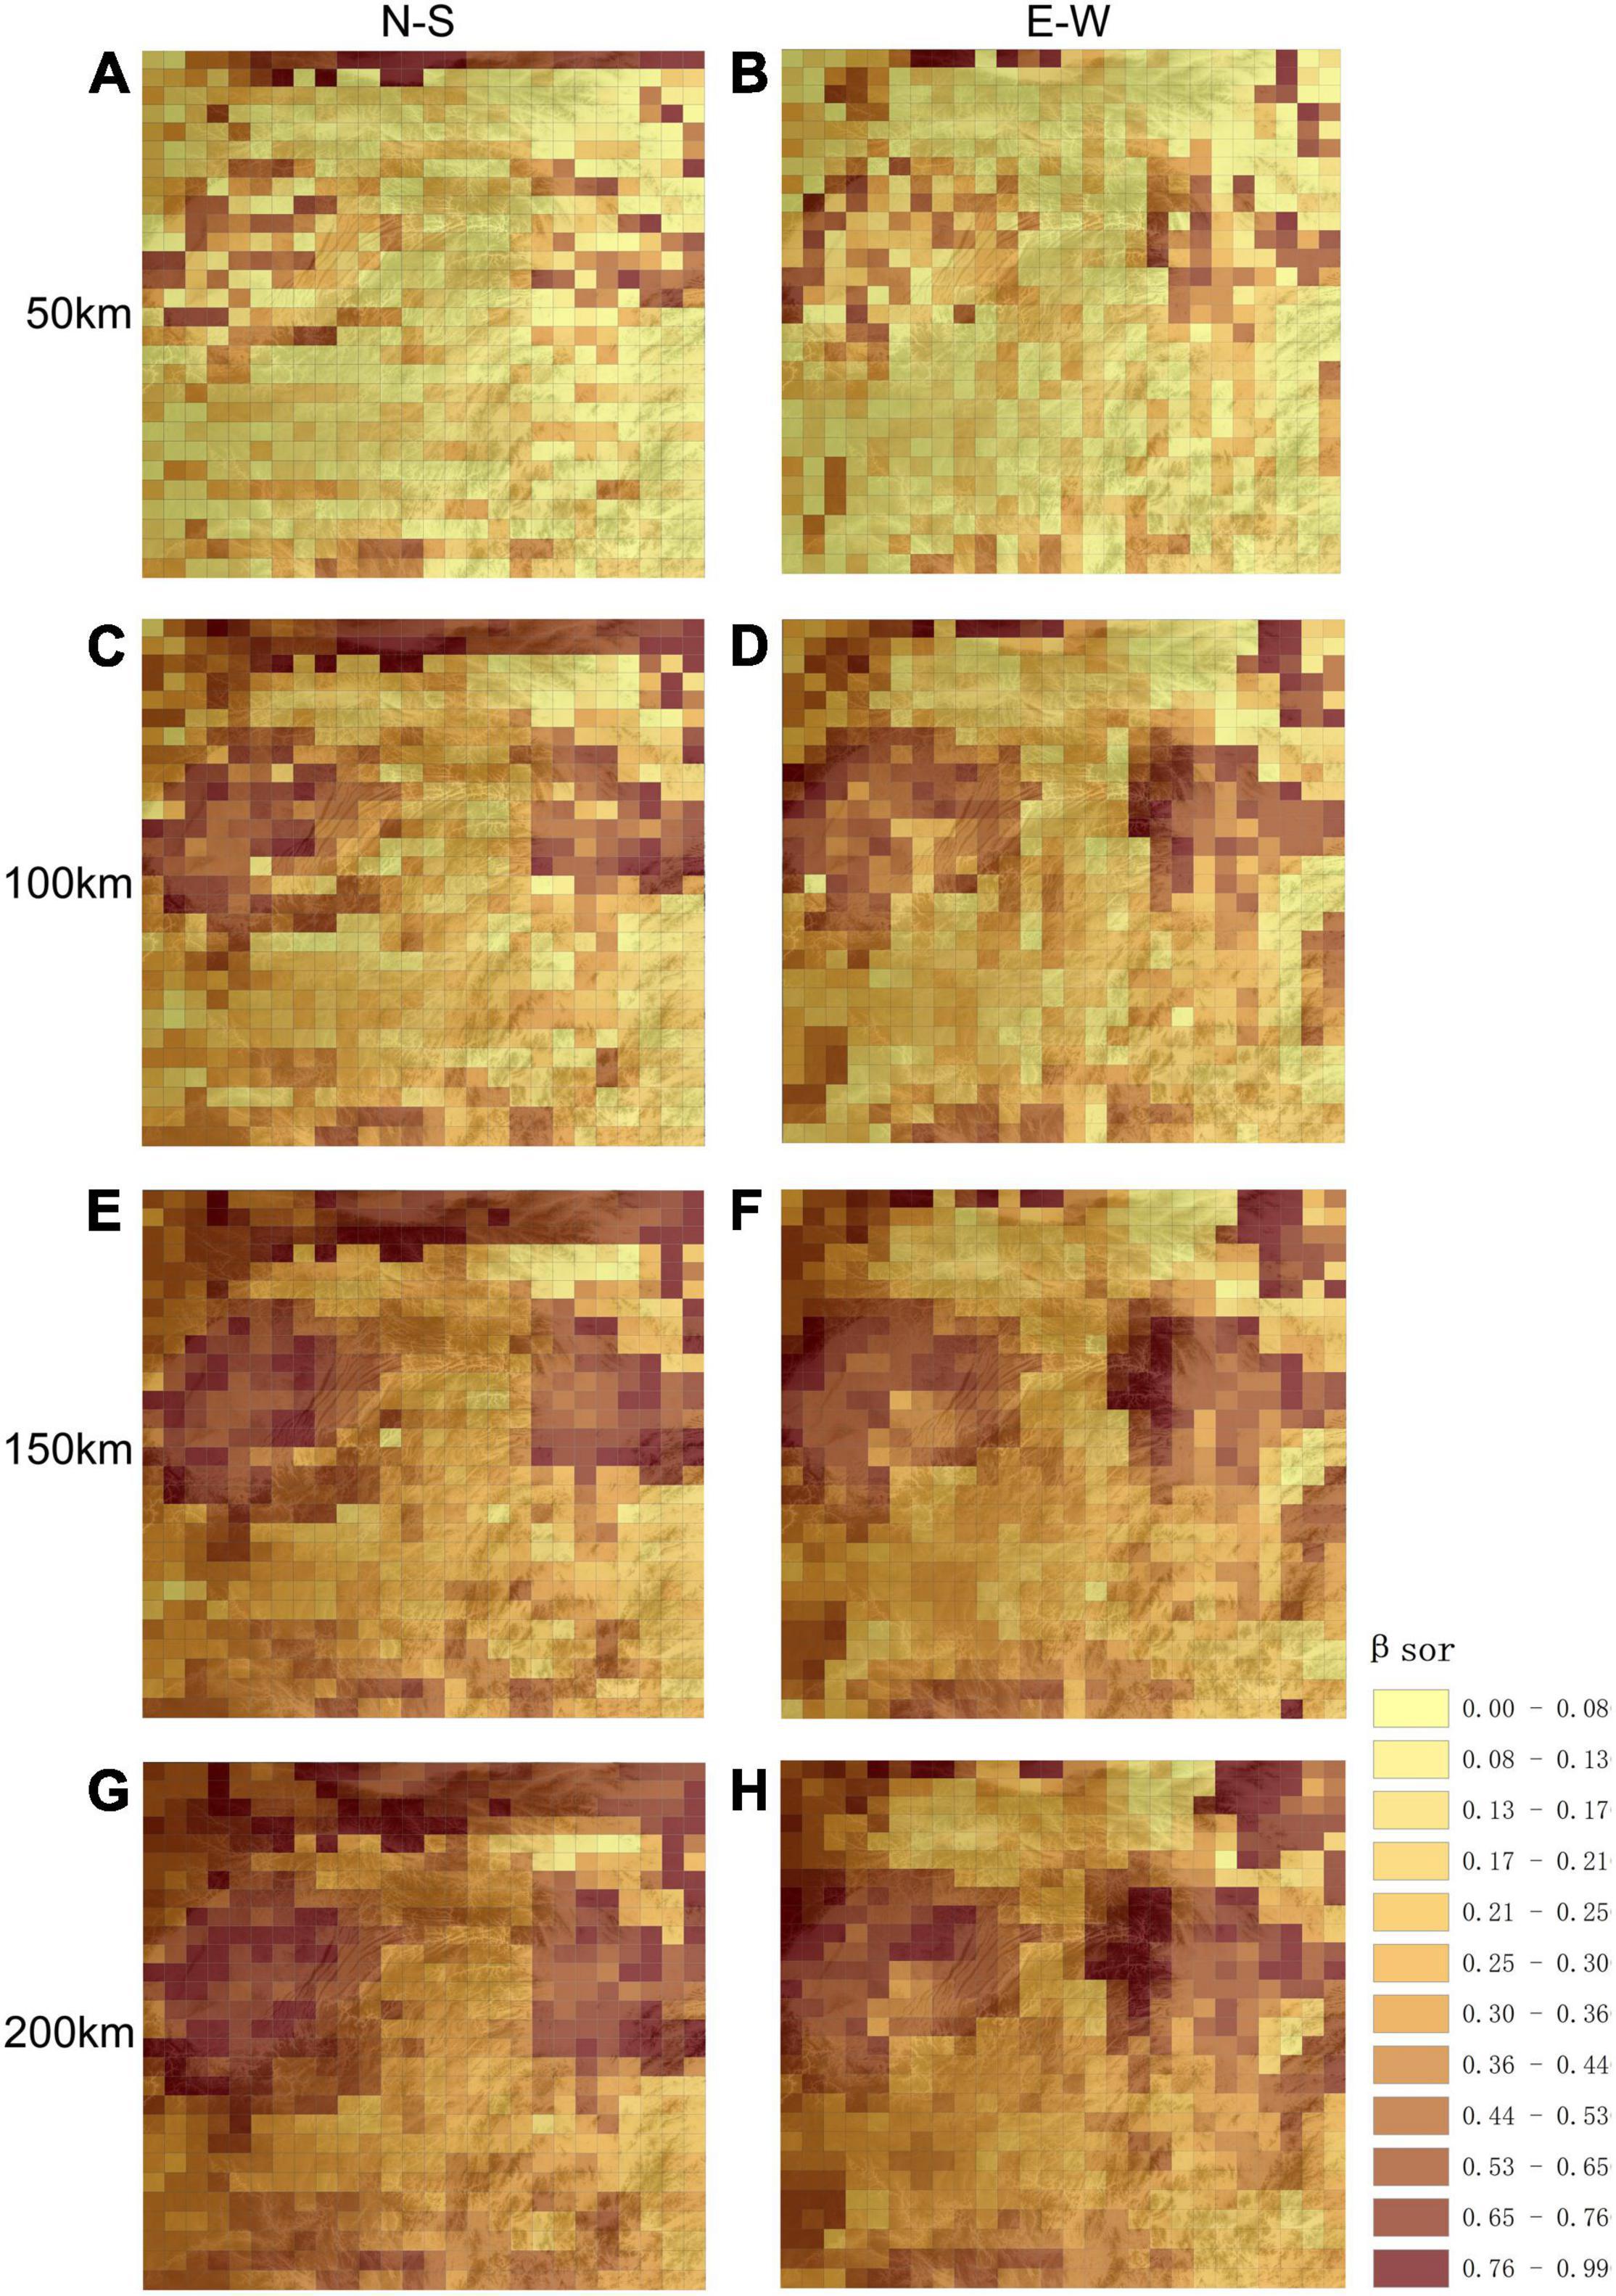
Figure 3. Spatial patterns in β-diversity at different scales and for different directions. (A,C,E,G) Represent longitudinal directional β-diversity at 50, 100, 150, and 200 km respectively; (B,D,F,H) represents latitudinal β-diversity at 50, 100, 150, and 200 km respectively. The base graphic is a topographic map.
For species turnover, βNS (Figure 4A, 0.4732 for 1,000 km) was higher than βEW (Figure 4B, 0.4153 for 1,000 km). At small scales, the difference between βNS and βEW was subtle, yet the intercept of Figure 4A is smaller than that of Figure 4B. Species similarity was slightly greater latitudinally vs. longitudinally at small scales. This indicates that dispersal may be limited longitudinally as compared to latitudinally. At larger scales, latitudinal beta diversity was higher, meaning that the terrain in Wuling Mountains supported a large communication of species.
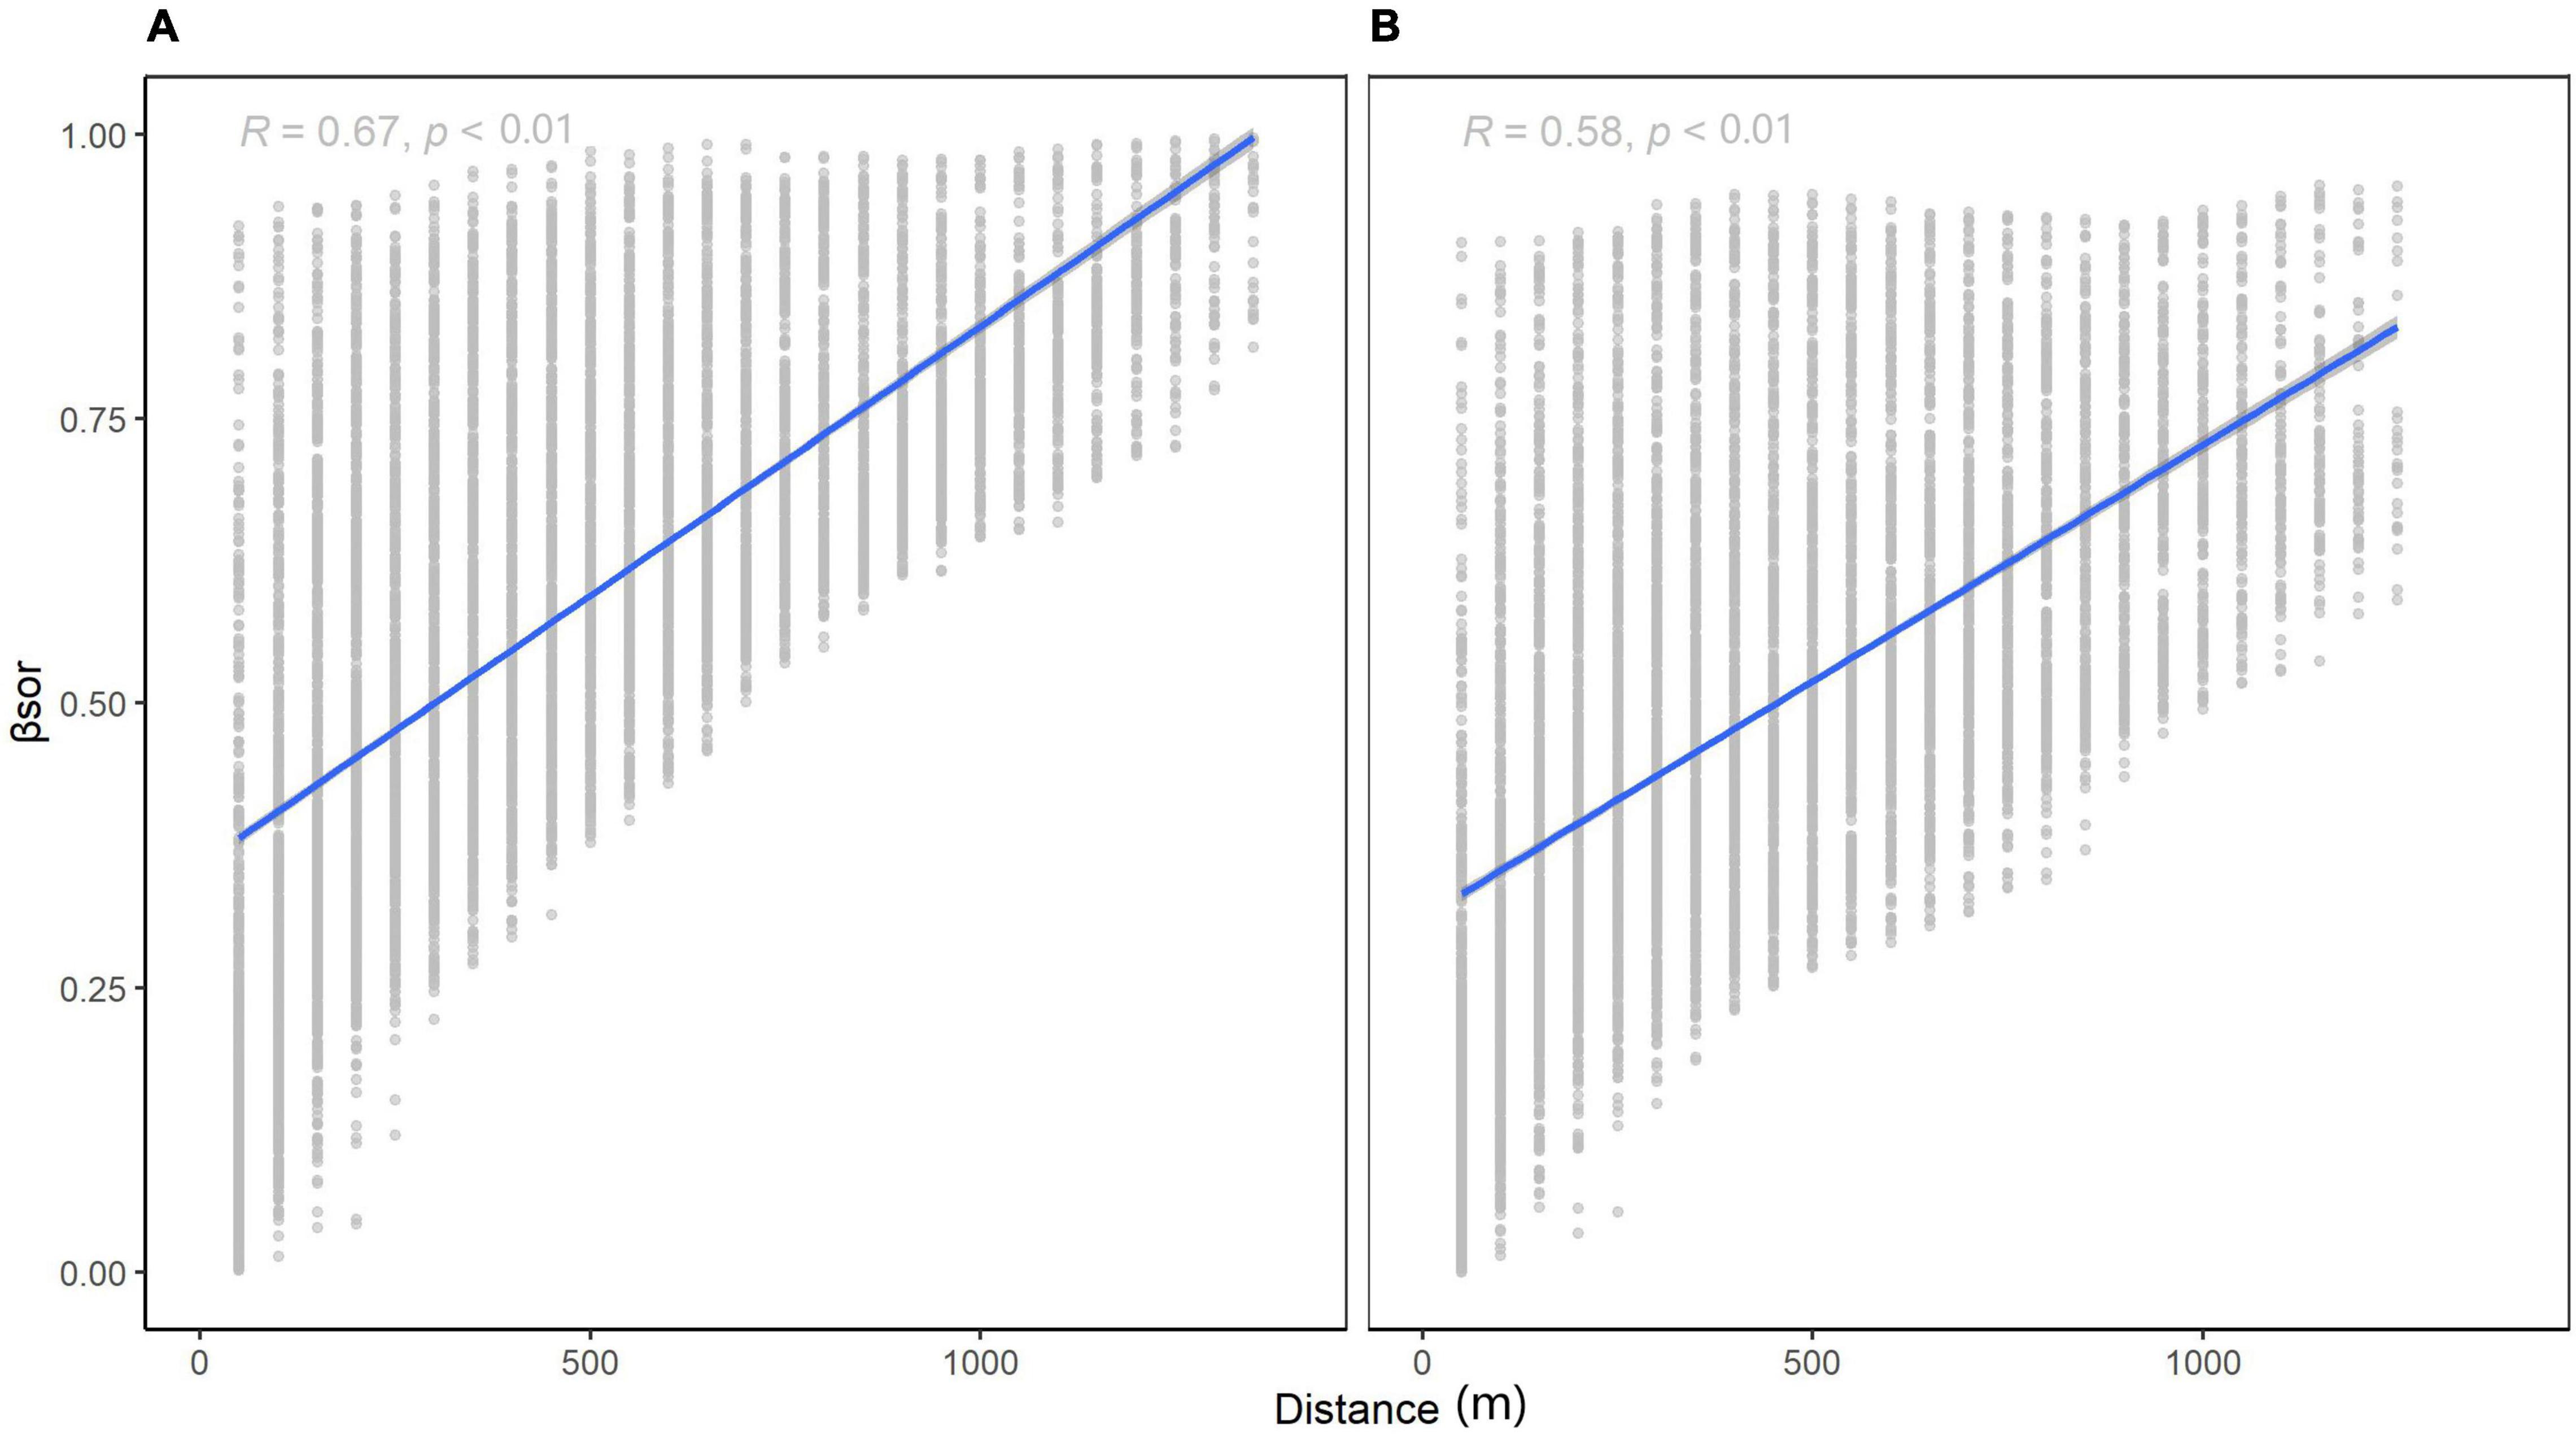
Figure 4. Relationship between β-diversity and distance for different directions: (A) longitudinal (k1000 = 0.4732) and (B) latitudinal (k1000 = 0.4153).
Geographical Regions and Community Ordination
Based on a chord distance matrix calculated from species presence-absence data, the study area was divided into six regions using UPGMA clustering (Figure 5). The cluster map was roughly consistent with the topography of the region. Therefore, the six regions were named after local topographic features as follows: the Wuling Mountains Region (W Mts.), Nanling-Xuefeng Mountains Region (N-X Mts.), Qinling-Daba Mountains Region (Q-D Mts.), Sichuan Basin Region (S Basin), Yangtze Plain Region (Y Pln.) and Yungui Plateau Region (Y-G plat.). The Wuling Mountains Region was adjacent to the other five regions, which were located (roughly) to the north (Q-D Mts.), northeast (Y Pln.), southeast (N-X Mts.), southwest (Y-G Plat.) and northwest (S Basin). The highest species diversity was observed in Nanling Mountains and the surrounding Yunnan-Guizhou Plateau with 1,200–2,300 species per grid cell. The Wuling Mountains Region also had high species diversity, with each grid cell containing 800–1,600 species of woody plants. Finally, the Qinling Mountains Region had the third highest species richness, after the two regions listed above, with about 400–900 species per grid cell.
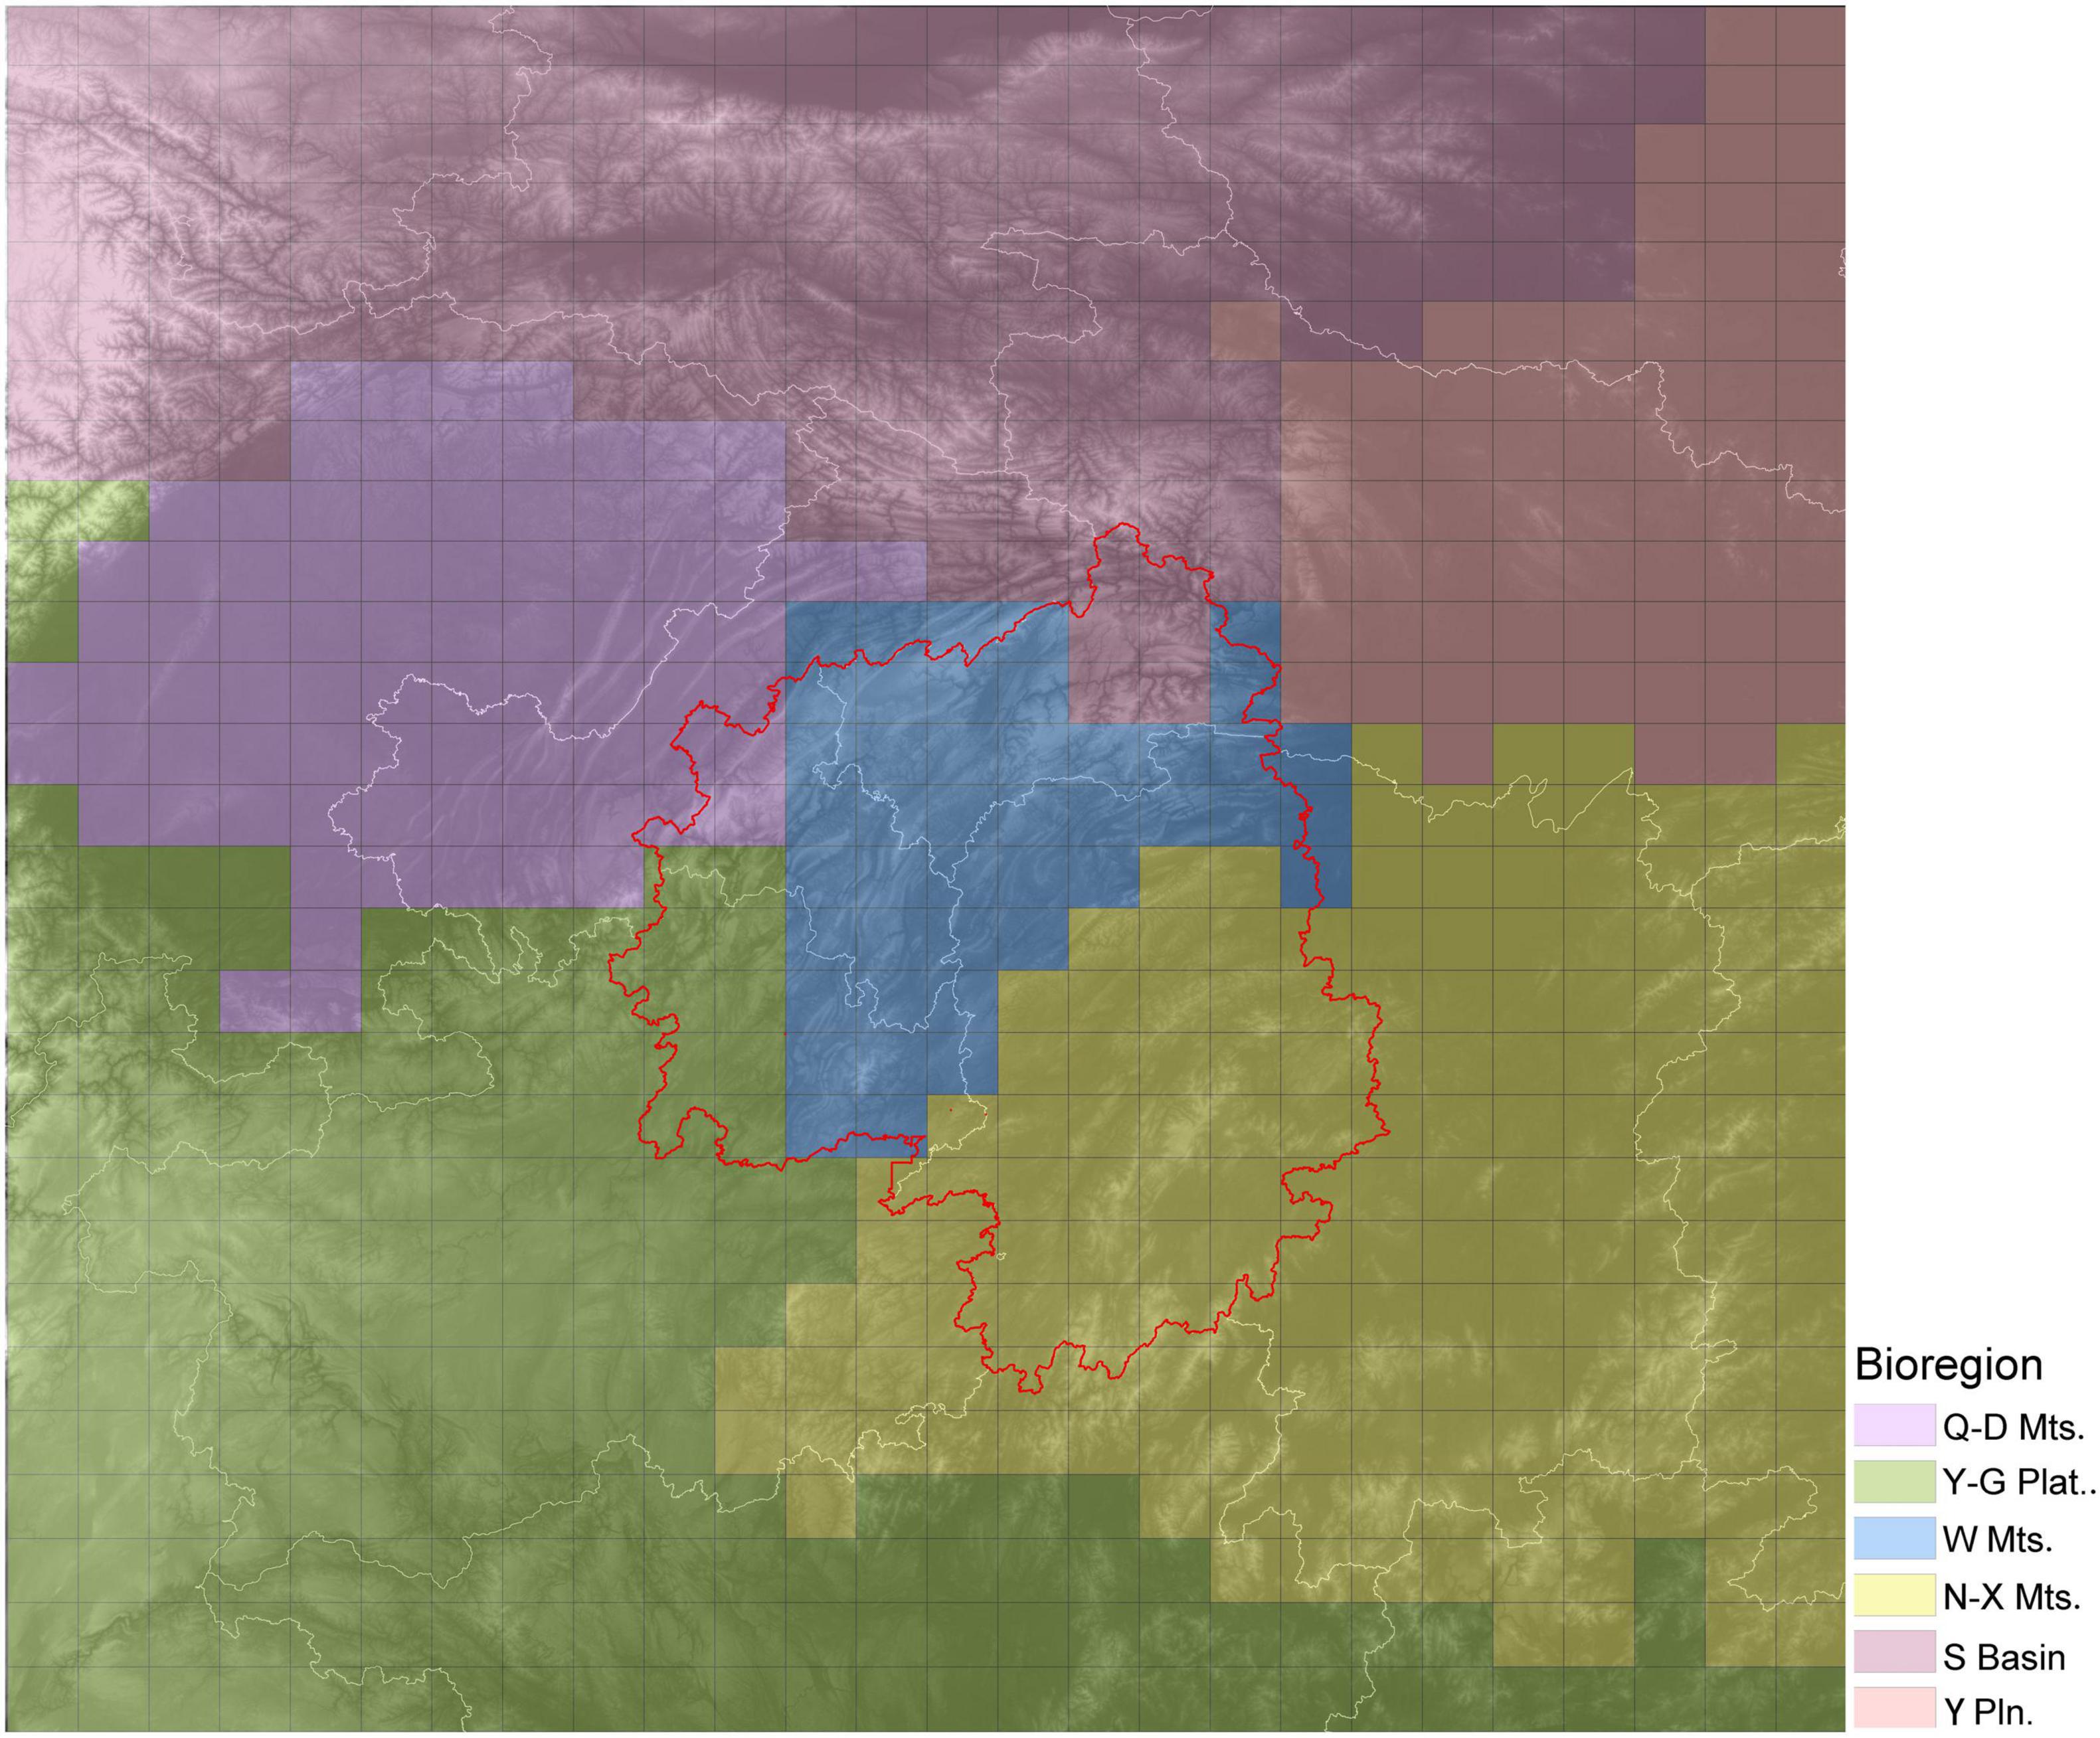
Figure 5. Biodiversity regions within the study area as determined for woody plant species. Different colors indicate different bioregions. The base graphic is a topographic map, and the red line delineates the Wuling Mountains.
Using data on the woody plant species composition of each region, a redundancy analysis (RDA) was performed using various environmental factors as explanatory variables in the regression analysis. The RDA ordination revealed continuous rather than discontinuous transitions among six regions. The first two RDA axes accounted for 77.74% of the variance (Figure 6). The samples from Wuling Mountains clustered in the center of those for the five other regions, suggesting that the woody plant community in Wuling was transitional among the regions.
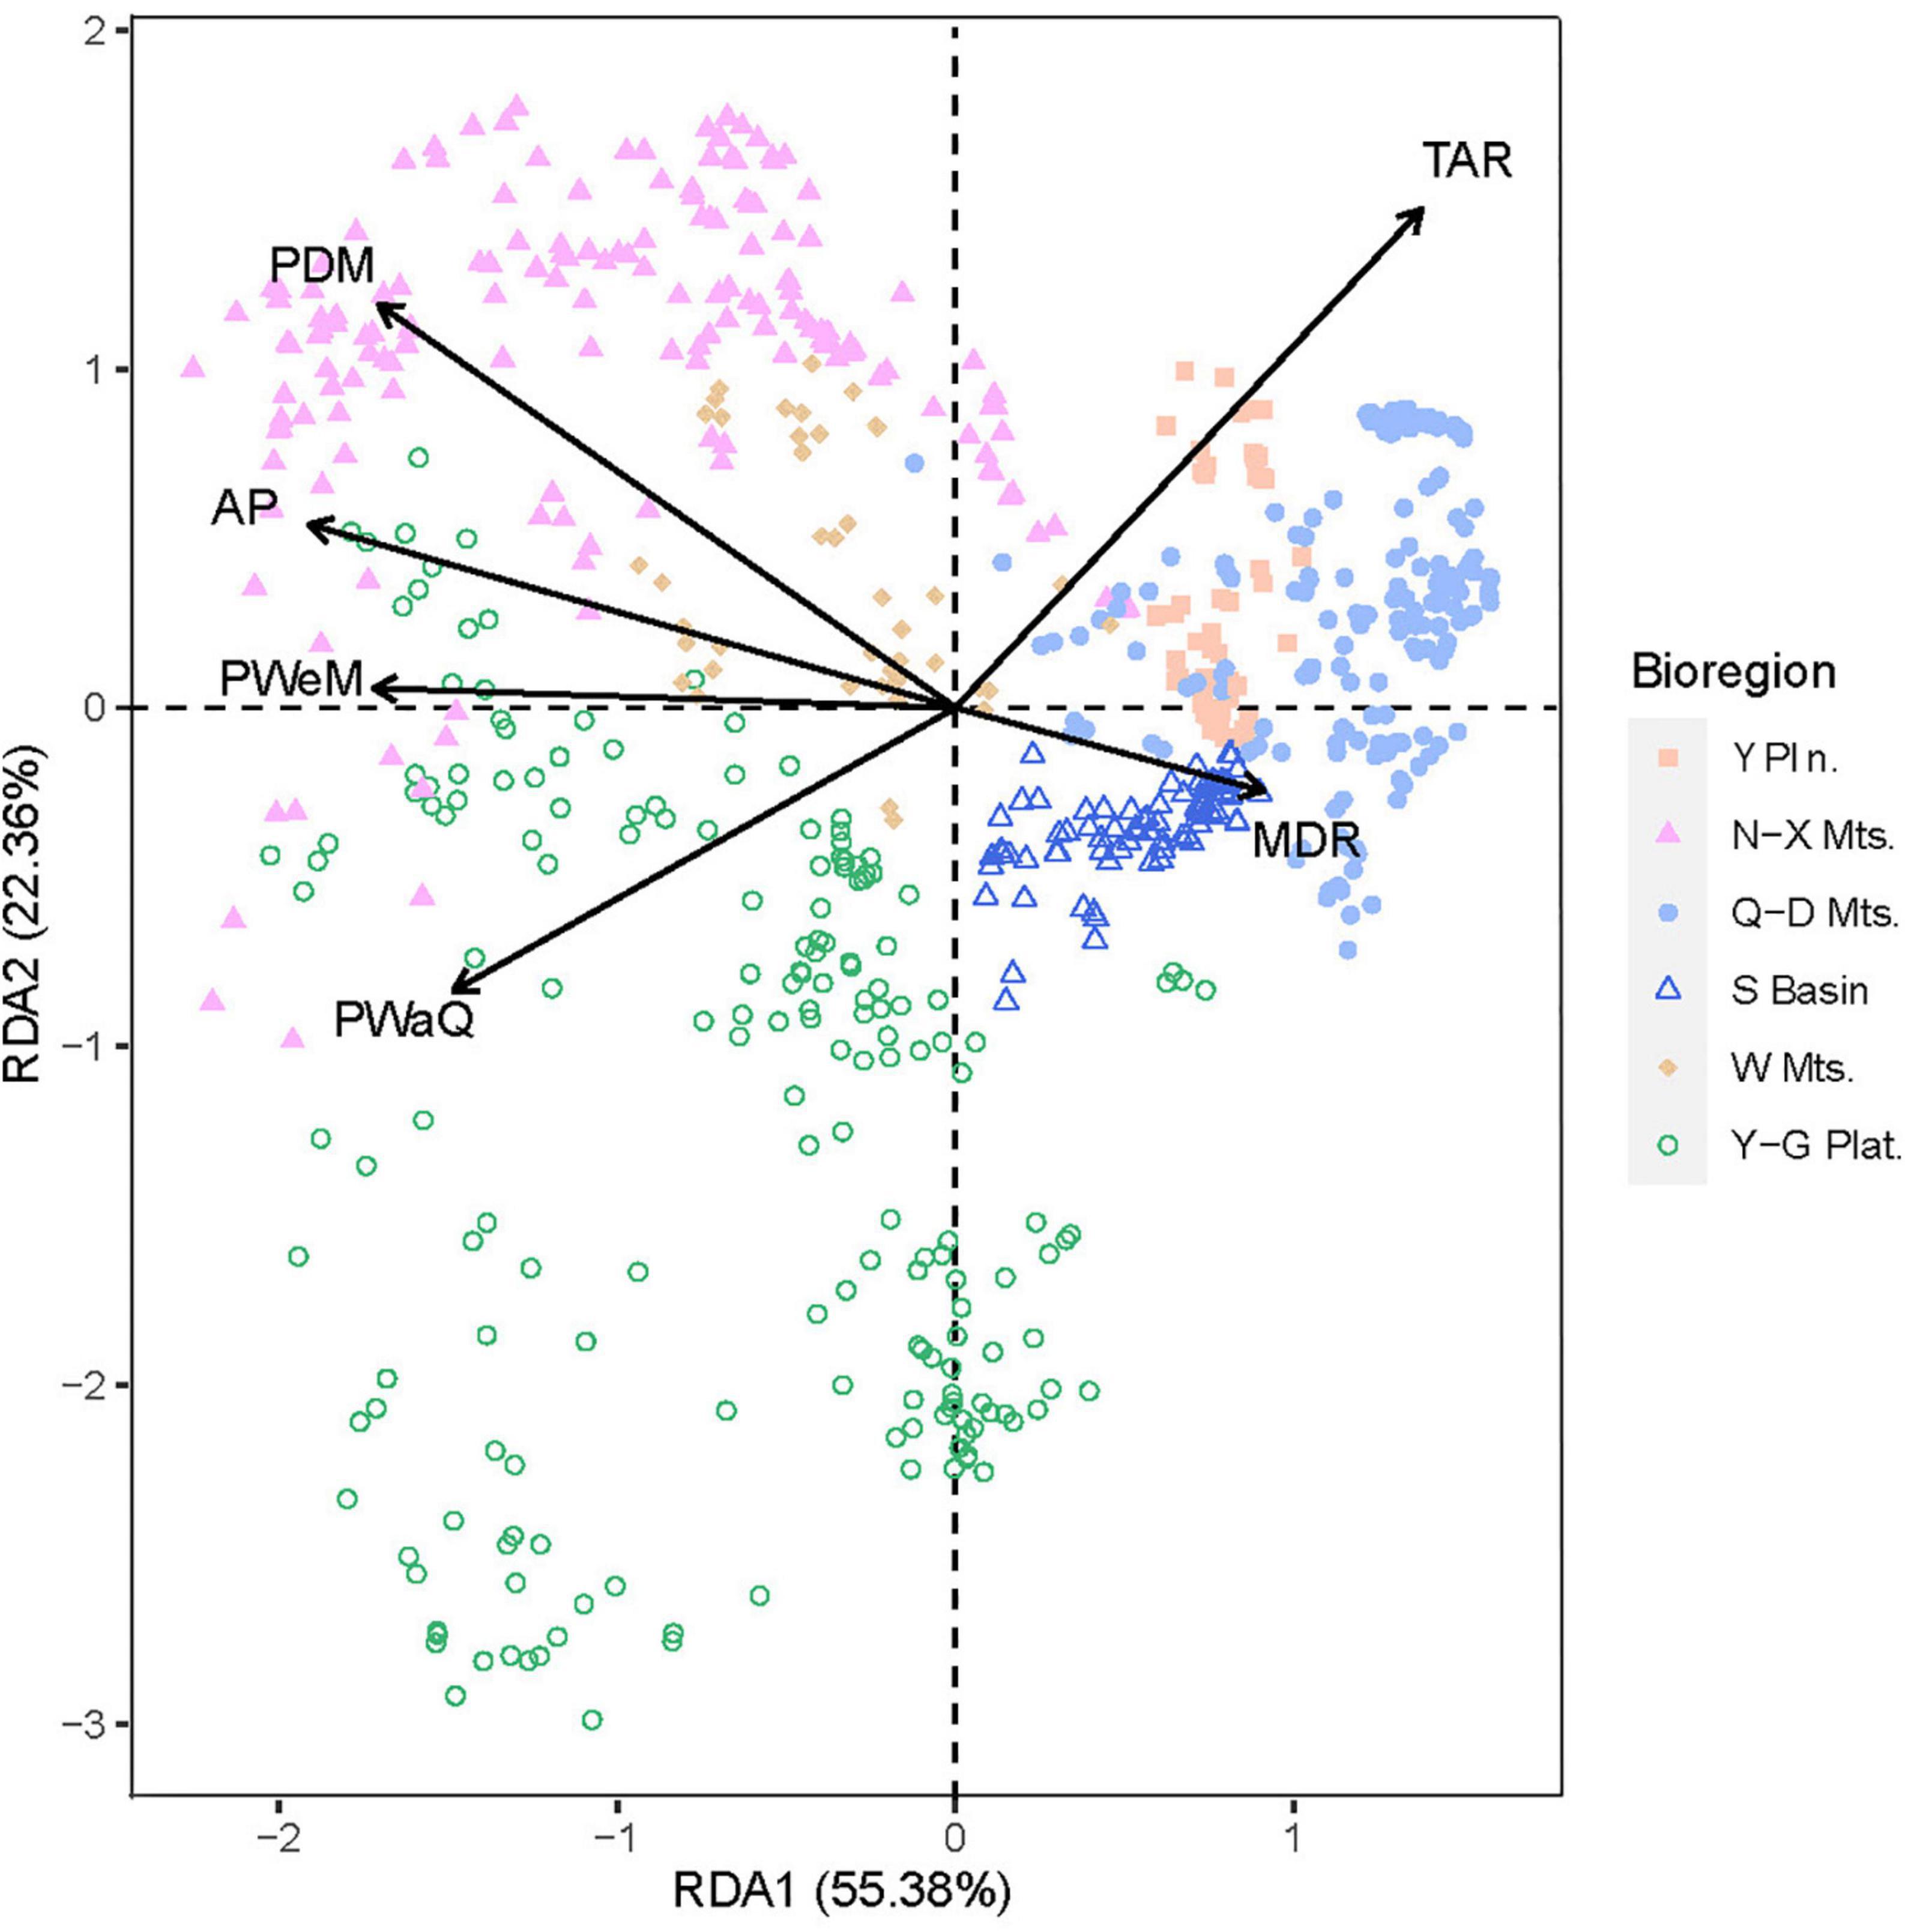
Figure 6. Ordination plot for a redundancy analysis (RDA) of species richness with several explanatory environmental variables. Sample points are grouped and colored by bioregion.
Discussion
Species distribution data serves as the basis of effective biodiversity conservation. Generally, latitudinal gradients are a prominent feature of plant species distributions (Willig et al., 2003; Hillebrand, 2004). Here, such gradients were described for Central China; however, the most striking feature of how biodiversity was distributed in this region is that woody plant diversity was disproportionately concentrated in the mountains, consistent with previous studies (Wang et al., 2012; Antonelli et al., 2018; Rahbek et al., 2019; Zhou et al., 2021). Wuling Mountains connects Northern and Southern Central China, bridging the plant species communities of these two disparate regions.
Mountains Are Critical for Biodiversity Conservation in Central China
In this study, woody species richness first increased with altitude and then decreased. The highest biodiversity was found at middle elevations. Plant species diversity was also higher in mountainous areas (including Qinling Mountains, Wuling Mountains, Nanling Mountains and Yungui Plateau) than on the plains (Yangtze Plain) or in basins (Sichuan Basin), consistent with an earlier study based on a county-level species distribution database for China (Tang et al., 2006). Topographical factors, especially elevation, were the most fundamental drivers of the distribution of woody plant diversity.
The six bioregions identified based on community composition were also strongly correlated with topography, further corroborating the importance of topography for structuring plant communities in the study area. The six regions included three mountainous regions (Wuling Mountains Region, Qinling-Daba Mountains Region and Nanling-Xuefeng Mountains Region), one basin (Sichuan Basin Region), one plain (Yangtze Plain Region) and one plateau (Yungui Plateau Region). Thus that topography drives species richness patterns in Central China.
Mountains, spanning latitudinal, longitudinal and elevational gradients (Wu et al., 2017), have profound impacts on the surrounding environment because they integrate natural and anthropogenic processes (Fang, 2004). The environmental complexity of mountainous regions tends to foster rich biodiversity. For example, elevational gradients can drive variation in temperature (He et al., 2017), humidity (Sewerniak and Puchałka, 2020) and species dispersal rates (Wang et al., 2012), providing a broad range of ecological niches for woody plant species. There are not only broad altitudinal gradients within mountainous regions, but also smaller-scale environmental gradients caused by local topographic variation. These diverse environments promote species differentiation and foster coexistence. For example, the geographical isolation imposed by mountain ranges can accelerates speciation. Considering anthropogenic factors, as higher altitudes are typically less accessibl, they tend to experience less human disturbance, allowing more primary community types and species to be preserved (Fang, 2004; Liu et al., 2009). Both Sichuan Basin and Yangtze Plain have long been affected by human activities; both regions contained fewer woody species than the three mountainous regions (Tang et al., 2006).
As an important refuge for terrestrial organisms, mountains harbor tremendous biodiversity providing future ecological security (Fang, 2004). However, montane environments are also extremely vulnerable to global climate change. It is therefore critical to study the ecology of key mountain ecosystems and to clarify their structure, processes and functions, in order to rationally develop these regions, as well as protect and utilize their resources.
A Corridor for Woody Species Dispersal in Central China
Harrison and Lawton (1992) proposed that longitudinal beta diversity should be greater than latitudinal beta diversity for many taxa in Great Britain, including plants, vertebrates and invertebrates. Qian et al. (2005) found this pattern held true for angiosperms both in Eastern Asia (2.6 times higher) and Eastern North America (3.3). They attributed this pattern to the strong correlation between latitude and climate (Qian et al., 2005). Using a more detailed dataset of woody species distributions, Wang et al. (2012) found that latitudinal beta diversity was much higher than longitudinal beta diversity across China. There are two possible explanations for this pattern: First, the environment changes more dramatically along latitudinal gradients versus longitudinal gradients (Fang, 1992). Second, China’s broadest mountains and largest rivers run in east-west directions; these landscape features act both as barriers to longitudinal (north-south) species dispersal and as corridors for latitudinal (east-west) species dispersal. Here, β-diversity in Central China was also found to differ with direction, but primarily latitudinally, and not longitudinally as in Wang et al. (2012).
In China, several large mountain ranges run from east-to-west, while Wuling Mountains run from the northeast-to-southwest (Wang et al., 2004), connecting the Qinling-Daba-Dabie Mountains in the north to the Nanling Mountains in the south. From both the α-diversity and β-diversity patterns seen here, as well as the community ordination, Wuling is central to species turnover in the region and provides a bridge for the exchange of species among surrounding areas. Chen et al. (2002) proposed that Wuling serves as a northern boundary for many tropical species with ranges located to the south. Similarly, Wuling might form a southern boundary for temperate species distributed to the north. For example, Wuling is the northern limit for species in the Annonaceae, Bretschneidera, Burmanniaceae, Melastoma, Planchonella and Rhodomyrtus. Roughly 109 species are distributed in the northern half of Wuling Mountains, while 67 species are distributed in the south (Chen et al., 2001). Therefore, the unique location and environments of Wuling Mountains have likely nurtured a variety of woody plant species; Wuling also serves as a corridor for species exchange from North to South China. A similar phenomenon has been described for Hengdun Mountains in plants and breeding birds (Qian et al., 2005; Wang et al., 2012; Wu et al., 2017). The Hengdun Mountains run in a north-south direction, blocking species dispersal along longitudinal gradients, while facilitating dispersal along latitudinal gradients (Qian et al., 2005), especially for species with small distributional ranges (Wang et al., 2012). Finally, species migrating west-to-east also are abundant in Wuling (Chen et al., 2002), which the Wuling may be a corridor for woody species dispersal in Central China.
Reasons of Wuling to Be a North-South Corridor in China
As shown in this study, Wuling Mountains represent a biodiversity hotspot in Central China, as well as a corridor for north-south species exchange. These geographical patterns may be a result of local geological history (Ricklefs, 1987), regional climatic variation (O’Brien, 2006; Warren et al., 2005; Currie et al., 2004), habitat heterogeneity (Kerr and Packer, 1997) and habitat changes caused by human activities, or some combination thereof (Pimm et al., 2014).
The Indosinian and Yanshanian movemens resulted in the Wuling was no longer invaded by the sea, and experiencing less disruption by Mesozoic intrusive rock activities (Chen et al., 2002). On the one hand, the crust was slowly uplifted by the extrusion of geological units, which laid the foundation for the derivation of As the earth’s crust was slowly uplifted in Wuling, together with the adjacent Kang-Dian and Cathaysian lands, this created a new space for the local paleoflora to occupy (Qi, 1990). Wuling became a refuge for quaternary glacial plants, enabling the Paleogene flora (e.g., boreotropical taxa) to persist minimally altered (Qi, 1990; Gong and Chen, 2006; Ye et al., 2019). The complex terrain created by the formation of Wuling supported the convergence of plants from north to south (Chen et al., 2002). Since the Cenozoic era, the climate in this region has also been relatively stable. In addition, Qin-Ba Mountain to the north serve as a barrier to cold air, protecting Wuling from harsh northerlies (Qi, 1990). The subtropical region of China, within with Wuling is located is little affected by the Siberian cold in winter, but significantly affected by the southeast ocean monsoon in summe; as such, temperatures in Wuling are ideal for plant life year-round (Zhong and Jiang, 1983). Furthermore, the Yunnan-Guizhou plateau promotes abundant precipitation in Wuling, supporting diverse plant communities (Zhong and Jiang, 1983). Precipitation in the driest month limits the distribution of woody plants in Wuling. Considering anthropogenic influences, Wuling is relatively undeveloped, with large economic gaps between Wuling and surrounding areas (Zheng, 2013), so the species diversity is less disturbed by economic development. Consequently, many ancient and rare species are preserved in Wuling, which also serves as a refuge for species from different areas in China, making Wuling a corridor of species gathering within Central China becoming a corridor of species gathering.
Conclusion
While Wuling has long been hypothesized to act as a corridor for species exchange, little quantitative research supports this hypothesis to date. To address this lack, this study quantitatively evaluated spatial patterns in diversity in the region, providing an overview of inter-regional species relationships. Located in the middle of Central China, Wuling Mountains play an important role in the exchange of woody plant species between the north and south. This study highlights the importance of the Wuling Mountains as a species corridor. Maintaining the ecological integrity of forests and strengthening biodiversity protections in Wuling will be critical to ensure long-term species conservation in Central China.
Data Availability Statement
The raw data supporting the conclusions of this article will be made available by the authors, without undue reservation.
Author Contributions
XQ and MJ designed the study. ZT, CW, TZ, YQ, and XQ collected the data. CW and XQ led the writing of the manuscript. All authors contributed critically to the drafts and gave final approval for publication.
Funding
This study was supported by the Strategic Priority Research Program of the Chinese Academy of Sciences (XDB31000000) and the National Natural Science Foundation of China (32171536 and 31670441).
Conflict of Interest
The authors declare that the research was conducted in the absence of any commercial or financial relationships that could be construed as a potential conflict of interest.
Publisher’s Note
All claims expressed in this article are solely those of the authors and do not necessarily represent those of their affiliated organizations, or those of the publisher, the editors and the reviewers. Any product that may be evaluated in this article, or claim that may be made by its manufacturer, is not guaranteed or endorsed by the publisher.
Acknowledgments
We would like to thank Zhiheng Wang from Peking University for his help with data collection.
Supplementary Material
The Supplementary Material for this article can be found online at: https://www.frontiersin.org/articles/10.3389/fevo.2022.837738/full#supplementary-material
Footnotes
References
Anderson, M. J., Crist, T. O., Chase, J. M., Vellend, M., Inouye, B. D., Freestone, A. L., et al. (2011). Navigating the multiple meanings of β diversity: a roadmap for the practicing ecologist. Ecol. Lett. 14, 19–28.
Antonelli, A., Kissling, W. D., Flantua, S. G. A., Bermúdez, M. A., Mulch, A., Muellner-Riehl, A. N., et al. (2018). Geological and climatic influences on mountain biodiversity. Nat. Geosci. 11, 718–725. doi: 10.1038/s41561-018-0236-z
Bănărescu, P. (1992). Zoogeography of fresh waters. Vol. 2: distribution and dispersal of freshwater animals in North America and Eurasia. J. N. Am. Benthol. Soc. 11:438.
Baselga, A., and Orme, C. D. L. (2012). betapart: an R package for the study of beta diversity. Methods Ecol. Evol. 3, 808–812.
Borcard, D., Gillet, F., and Legendre, P. (2011). Numerical Ecology With R. New York, NY: Springer Science & Business Media.
Cai, Q. (2020). Community Classification and Structures of Chinese Beech Forests and Ecological Niches of World’s Beech Species. Beijing: Peking University.
Chen, G., Liao, W., Ao, C., Liu, W., and Zhang, H. (2002). Studies on characters and feature of seed plants flora of Wulingshan region. Bull. Bot. Res. 22, 98–120.
Chen, G., Liao, W., and Zhang, H. (2001). Chracteristics of spermatophyte flora of Mt. Wulingshan region from central China and its phytogenographical significance. Acta Sci. Nat. Univ. Sunyatseni 40, 74–78.
Chown, S. L., and Gaston, K. J. (2000). Areas, cradles and museums: the latitudinal gradient in species richness. Trends Ecol. Evol. 15, 311–315. doi: 10.1016/s0169-5347(00)01910-8
Chung, M. Y., López-Pujol, J., and Chung, M. G. (2017). The role of the Baekdudaegan (Korean Peninsula) as a major glacial refugium for plant species: a priority for conservation. Biol. Conserv. 206, 236–248. doi: 10.1016/j.biocon.2016.11.040
Craw, D., Burridge, C. P., Upton, P., Rowe, D. L., and Waters, J. M. (2010). Evolution of biological dispersal corridors through a tectonically active mountain range in New Zealand. J. Biogeogr. 35, 1790–1802.
Currie, D., Mittelbach, G., Guegan, J., Hawkins, B., Field, R., Kaufman, D., et al. (2004). Predictions and tests of climate-based hypotheses of broad-scale variation in taxonomic richness. Ecol. Lett. 7, 1121–1134. doi: 10.1111/j.1461-0248.2004.00671.x
Currie, D. J., and Paquin, V. (1987). Large-scale biogeographical patterns of species richness of trees. Nature 329, 326–327.
Dixon, P. (2003). Vegan, a package of R functions for community ecology. J. Veg. Sci. 14, 927–930. doi: 10.1111/j.1654-1103.2003.tb02228.x
Fang, J. (1992). Study on the geographic elements affecting temperature distribution in China. Acta Ecol. Sin. 12, 97–104.
Fang, J. (2004). Exploring altitudinal patterns of plant diversity of China’s mountains. Biodivers. Sci. 12, 1–4.
Fang, J., Wang, Z., and Tang, Z. (2011). Atlas of Woody Plants in China: Distribution and Climate. Berlin: Springer.
Fick, S., and Hijmans, R. (2017). Worldclim 2: new 1km spatial resolution climate surfaces for global land areas. Int. J. Climatol. 37, 4302–4315.
Gaston, K. J., Davies, R. G., Orme, C., Olson, V. A., Thomas, G. H., Ding, T. S., et al. (2007). Spatial turnover in the global avifauna. Proc. Biol. Sci. 274, 1567–1574. doi: 10.1098/rspb.2007.0236
Gong, S., and Chen, G. (2006). Conservation and utilization of rare and endangered plants in Wuling mountain region. Guangxi Plants 26, 242–248.
Harrison, S., and Lawton, R. (1992). Beta diversity on geographic gradients in Britain. J. Anim. Ecol. 61, 151–158.
He, S., Zhong, Y., Sun, Y., Su, Z., Jia, X., Hu, Y., et al. (2017). Topography-associated thermal gradient predicts warming effects on woody plant structural diversity in a subtropical forest. Sci. Rep. 7:40387. doi: 10.1038/srep40387
Hillebrand, H. (2004). On the generality of the latitudinal diversity gradient. Am. Nat. 163, 192–211.
Kelley, L. A., Gardner, S. P., and Sutcliffe, M. J. (1996). An automated approach for clustering an ensemble of NMR-derived protein structures into conformationally related subfamilies. Protein Eng. 9, 1063–1065. doi: 10.1093/protein/9.11.1063
Kerr, J. T., and Packer, L. (1997). Habitat heterogeneity as a determinant of mammal species richness in high-energy regions. Nature 385, 252–254. doi: 10.1038/385252a0
Kraft, N. J. B., Sanders, N. J., Stegen, J. C., Anderson, M. J., Crist, T. O., Cornell, H. V., et al. (2011). Disentangling the drivers of β diversity along latitudinal and elevational gradients. Science 333, 1755–1758. doi: 10.1126/science.1208584
Kreft, H., and Jetz, W. (2007). Global patterns and determinants of vascular plant diversity. Proc. Natl. Acad. Sci. U.S.A. 104, 5925–5930. doi: 10.1073/pnas.0608361104
Lennon, J. J., Koleff, P., Greenwood, J. J. D., and Gaston, K. J. (2001). The geographical structure of British bird distributions: diversity, spatial turnover and scale. J. Anim. Ecol. 70, 966–979. doi: 10.1046/j.0021-8790.2001.00563.x
Leprieur, F., and Oikonomou, A. (2014). The need for richness-independent measures of turnover when delineating biogeographical regions. J. Biogeogr. 41, 417–420. doi: 10.1111/jbi.12266
Liu, Y., Zhang, J., and Yang, W. (2009). Responses of alpine biodiversity to climate change. Biodivers. Sci. 17, 88–96. doi: 10.3724/sp.j.1003.2009.08197
Lu, L., Mao, L.-F., Yang, T., Ye, J., Liu, B., Li, H.-L., et al. (2018). Evolutionary history of the angiosperm flora of China. Nature 554, 234–238. doi: 10.1038/nature25485
McDowall, R. M. (1990). New Zealand Freshwater Fishes: a Natural History and Guide. Auckland: Heinemann.
Mi, X., Feng, G., Hu, Y., Zhang, J., Chen, L., Corlett, R. T., et al. (2021). The global significance of biodiversity science in China: an overview. Nat. Sci. Rev. 8:nwab032. doi: 10.1093/nsr/nwab032
O’Brien, E. (2006). Biological relativity to water-energy dynamics. J. Biogeogr. 33, 1868–1888. doi: 10.1111/j.1365-2699.2006.01534.x
Orme, C., Davies, R., Burgess, M., Eigenbrod, F., Pickup, N., Olson, V., et al. (2005). Global hotspots of species richness are not congruent with endemism or threat. Nature 436, 1016–1019. doi: 10.1038/nature03850
Peters, M. K., Hemp, A., Appelhans, T., Behler, C., Classen, A., Detsch, F., et al. (2016). Predictors of elevational biodiversity gradients change from single taxa to the multi-taxa community level. Nat. Commun. 7:13736. doi: 10.1038/ncomms13736
Pimm, S., Jenkins, C., Abell, R., Brooks, T., Gittleman, J., Joppa, L., et al. (2014). The biodiversity of species and their rates of extinction, distribution, and protection. Science 344:1246752. doi: 10.1126/science.1246752
Qi, C., Yu, X., Xiao, Y., Cao, T., Zheng, Z., and Yin, G. (1995). A study of the flora of the seed plants from the floristic region of central China. Acta Bot. Yunnanica (Suppl. 7) 1, 55–92.
Qi, C., Yu, X., Zheng, Z., and Yin, G. (1998). Notes on endemic seed plants in the floristic region of central China. J. Cent. S. For. Univ. 18(Suppl.) 1–4.
Qian, H., Ricklefs, R. E., and White, P. S. (2005). Beta diversity of angiosperms in temperate floras of eastern Asia and Eastern North America. Ecol. Lett. 8, 15–22.
R Core Team (2016). R: A Language and Environment for Statistical Computing. Vienna: R Foundation for Statistical Computing.
Rahbek, C., Borregaard, M. K., Antonelli, A., Colwell, R. K., and Fjelds, J. (2019). Building mountain biodiversity: geological and evolutionary processes. Science 365, 1114–1119. doi: 10.1126/science.aax0151
Ricklefs, R. (1987). Community diversity: relative roles of local and regional processes. Science 235, 167–171. doi: 10.1126/science.235.4785.167
Sanders, N. J., and Rahbek, C. (2012). The patterns and causes of elevational diversity gradients. Ecography 35, 1–3.
Sewerniak, P., and Puchałka, R. (2020). Topographically induced variation of microclimatic and soil conditions drives ground vegetation diversity in managed Scots pine stands on inland dunes. Agric. For. Meteorol. 291:108054. doi: 10.1016/j.agrformet.2020.108054
Slechtova, V., Bohlen, J., Freyhof, J., Persat, H., and Delmastro, G. B. (2004). The Alps as barrier to dispersal in cold-adapted freshwater fishes? Phylogeographic history and taxonomic status of the bullhead in the Adriatic freshwater drainage. Mol. Phylogenet. Evol. 33, 225–239. doi: 10.1016/j.ympev.2004.05.005
Song, Y., Wang, X., and Yan, E. (2013). Evergreen Broad-Leaved Forest of China-Classification, Ecology, Conservation. Beijing: Science Press.
Taberlet, P., Fumagalli, L., Wust-Saucy, A.-G., and Cosson, J.-F. (1998). Comparative phylogeography and postglacial colonization routes in Europe. Mol. Ecol. 7, 453–464. doi: 10.1046/j.1365-294x.1998.00289.x
Tang, Z., Wang, Z., Zheng, C., and Fang, J. (2006). Biodiversity in China’s mountains. Front. Ecol. Environ. 4, 347–352. doi: 10.1890/1540-92952006004[0347:BICM]2.0.CO;2
Tuomisto, H. (2010). A diversity of beta diversities: straightening up a concept gone awry. Part 1. Defining beta diversity as a function of alpha and gamma diversity. Ecography 33, 2–22. doi: 10.1111/j.1600-0587.2009.05880.x
Tuomisto, H., Ruokolainen, K., and Yli-Halla, M. (2003). Dispersal, environment, and floristic variation of western Amazonian forests. Science 299, 241–244. doi: 10.1126/science.1078037
Wang, L., Jia, Y., Zhang, X., and Qin, H. (2015). Overview of higher plant diversity in China. Biodivers. Sci. 23, 217–224.
Wang, W. (1992). On some distribution patterns and some migration routes found in the Eastern Asian region. Acta Phytotaxonomica Sin. 30, 1–24. doi: 10.4324/9780429500190-1
Wang, X., Wang, Z., and Fang, J. (2004). Mountain ranges and peaks in China. Biodivers. Sci. 12, 206–212.
Wang, Z., Fang, J., Tang, Z., and Lin, X. (2011). Patterns, determinants and models of woody plant diversity in China. Proc. Biol. Sci. 278, 2122–2132. doi: 10.1098/rspb.2010.1897
Wang, Z., Fang, J., Tang, Z., and Shi, L. (2012). Geographical patterns in the beta diversity of China’s woody plants: the influence of space, environment and range size. Ecography 35, 1092–1102. doi: 10.1111/j.1600-0587.2012.06988.x
Warren, P., Evans, K., and Gaston, K. (2005). Species-energy relationships at the macroecological scale: a review of the mechanisms. Biol. Rev. 80, 1–25. doi: 10.1017/s1464793104006517
White, D., and Gramacy, R. (2012). Maptree: Mapping, Pruning, and Graphing Tree Models. Available online at: https://CRAN.R-project.org/package=maptree (accessed March 24, 2021).
Whittaker, R. H. (1960). Vegetation of the Siskiyou mountains, Oregon and California. Ecol. Monogr. 30, 279–338.
Williams, T. C., Williams, J. M., Williams, P. G., and Stokstad, P. (2001). Bird migration through a mountain pass studied with high resolution radar, ceilometers, and census. Auk 118, 389–403. doi: 10.1093/auk/118.2.389
Willig, M. R., Kaufman, D. M., and Stevens, R. D. (2003). Latitudinal gradients of biodiversity: pattern, process, scale, and synthesis. Annu. Rev. Ecol. Evol. Syst. 34, 273–309.
Wu, Y., DuBay, S., Colwell, R., Ran, J., and Lei, F. (2017). Mobile hotspots and refugia of avian diversity in the mountains of South-West China under past and contemporary global climate change. J. Biogeogr. 44, 615–626.
Ye, J., Lu, L., Liu, B., Yang, T., Zhang, J., Hu, H., et al. (2019). Phylogenetic delineation of regional biota: a case study of the Chinese flora. Mol. Phylogenet. Evol. 135, 222–229. doi: 10.1016/j.ympev.2019.03.011
Ying, T. (2001). Species diversity and distribution pattern of seed plants in China. Biodivers. Sci. 9, 393–398. doi: 10.17520/biods.2001058
Zheng, C. (2013). Study on the economic development of Wuling mountain area: based on the perspective of new economic geography. J. Southwest Univ. Natl. Humanit. Soc. Sci. Ed. 34, 136–143.
Zhong, M., and Jiang, S. (1983). Preliminary study on bryophytes in Fanjing mountain. Guizhou For. Sci. Technol. 4, 11–38.
Keywords: beta diversity, biodiversity hotspot, ecological corridor, mountains, species distribution, woody plants
Citation: Wang C, Zhou T, Qin Y, Zhou G, Fei Y, Xu Y, Tang Z, Jiang M and Qiao X (2022) Wuling Mountains Function as a Corridor for Woody Plant Species Exchange Between Northern and Southern Central China. Front. Ecol. Evol. 10:837738. doi: 10.3389/fevo.2022.837738
Received: 17 December 2021; Accepted: 12 January 2022;
Published: 18 February 2022.
Edited by:
Hang Sun, Kunming Institute of Botany, Chinese Academy of Sciences (CAS), ChinaReviewed by:
Rong Li, Kunming Institute of Botany, Chinese Academy of Sciences (CAS), ChinaErik Welk, Martin Luther University of Halle-Wittenberg, Germany
Copyright © 2022 Wang, Zhou, Qin, Zhou, Fei, Xu, Tang, Jiang and Qiao. This is an open-access article distributed under the terms of the Creative Commons Attribution License (CC BY). The use, distribution or reproduction in other forums is permitted, provided the original author(s) and the copyright owner(s) are credited and that the original publication in this journal is cited, in accordance with accepted academic practice. No use, distribution or reproduction is permitted which does not comply with these terms.
*Correspondence: Xiujuan Qiao, xjqiao@wbgcas.cn