Contributions to Satellite-Based Land Cover Classification, Vegetation Quantification and Grassland Monitoring in Central Asian Highlands Using Sentinel-2 and MODIS Data
 Harald Zandler
 Sorosh Poya Faryabi
 Stephane Ostrowski
- 1Working Group of Ecological Climatology, Institute of Geography, University of Bayreuth, Bayreuth, Germany
- 2Bayreuth Center of Ecology and Environmental Research (BayCEER), University of Bayreuth, Bayreuth, Germany
- 3Wildlife Conservation Society Afghanistan, Kabul, Afghanistan
- 4Wildlife Conservation Society (WCS), Bronx, NY, United States
The peripheral setting of cold drylands in Asian mountains makes remote sensing tools essential for respective monitoring. However, low vegetation cover and a lack of meteorological stations lead to uncertainties in vegetation modeling, and obstruct uncovering of driving degradation factors. We therefore analyzed the importance of promising variables, including soil-adjusted indices and high-resolution snow metrics, for vegetation quantification and classification in Afghanistan’s Wakhan region using Sentinel-2 and field data with a random forest algorithm. To increase insights on remotely derived climate proxies, we incorporated a temporal correlation analysis of MODIS snow data (NDSI) compared to field measured vegetation and MODIS-NDVI anomalies. Repeated spatial cross-validation showed good performance of the classification (80–81% overall accuracy) and foliar vegetation model (R2 0.77–0.8, RMSE 11.23–12.85). Omitting the spatial cross-validation approach led to a positive evaluation bias of 0.1 in the overall accuracy of the classification and 25% in RMSE of the cover models, demonstrating that studies not considering the spatial structure of environmental data must be treated with caution. The 500-repeated Boruta-algorithm highlighted MSACRI, MSAVI, NDVI and the short-wave infrared Band-12 as the most important variables. This indicates that, complementary to traditional indices, soil-adjusted variables and the short-wave infrared region are essential for vegetation modeling in cold grasslands. Snow variables also showed high importance but they did not improve the overall performance of the models. Single-variable models, which were restricted to areas with very low vegetation cover (<20%), resulted in poor performance of NDVI for cover prediction and better performance of snow variables. Our temporal analysis provides evidence that snow variables are important climate proxies by showing highly significant correlations of spring snow data with MODIS-NDVI during 2001–2020 (Pearson’s r 0.68) and field measured vegetation during 2006, 2007, 2016 and 2018 (R 0.3). Strong spatial differences were visible with higher correlations in alpine grasslands (MODIS NDVI: 0.72, field data: 0.74) compared to other regions and lowest correlations in riparian grasslands. We thereby show new monitoring approaches to grassland dynamics that enable the development of sustainable management strategies, and the mitigation of threats affecting cold grasslands of Central Asia.
1 Introduction
Grasslands cover over 40% of the Earth’s terrestrial surface and support the livelihoods of more than two billion people (Hewins et al., 2018; Squires et al., 2018). Large parts of respective environments are classified as drylands or cold drylands that provide vital ecosystem services and serve as important regulators of the climate system (Suttie et al., 2005; Burrell et al., 2018; Smith et al., 2019). Unfortunately, many known drivers of land use change, habitat fragmentation and associated biodiversity loss are increasingly present in drylands and threaten the key services they provide to mankind (Zhang et al., 2021). Change in precipitation and temperature results in altered hydrothermal conditions and biochemical cycles, affecting the species richness, diversity, growth, health and biomass productivity (Paruelo et al., 1999; Dingaan and du Preez 2013; Wu et al., 2014). Qualitative and quantitative information on grassland, shrub steppes and alpine meadows that compose cold drylands, is therefore a prerequisite for landscape scale conservation measures, for grazing management and for the assessment of degradation vulnerability and fodder availability (Vanselow et al., 2018). Furthermore, land cover data and respective changes are important indicators for assessing the United Nation’s Sustainable Development Goals (Prince 2019).
Because of the peripheral setting of cold drylands, a large part of their monitoring has to be conducted using regionally adapted remote sensing methods. However, remote sensing faces major challenges in these regions due to low vegetation cover and signal to noise ratio, high shares of non-photosynthetic plant tissue and soil background reflectance, and large spatial heterogeneity (Eisfelder et al., 2012; Smith et al., 2019; Zhang et al., 2019). Additionally, reliable spatial climate datasets and variables are necessary to assess potential drivers of vegetation change, but the scarcity of climate infrastructure in respective regions leads to limitations in the availability of long term climate data for vegetation monitoring (Zandler et al., 2019, 2020). Despite the high ecological and societal relevance of these drylands, research and remote sensing algorithms that are adapted to the specific situation in this particular regions are still limited (Smith et al., 2019; Wang et al., 2019), and studies in Asia’s cold grasslands are particularly scarce (Hu and Hu 2019).
New monitoring approaches are necessary to increase knowledge on spatio-temporal vegetation dynamics in cold arid and semi-arid areas, and to enable sustainable conservation strategies in these regions. Existing research on remote sensing approaches indicates that the coverage of various spectral domains, including the red-edge (Ren et al., 2011; Eisfelder et al., 2012; Li et al., 2012, Li et al., 2017; Schumacher et al., 2016) or the short-wave infrared region (SWIR) (Asner et al., 2000; Oldeland et al., 2010; Zandler et al., 2015b; Ren et al., 2018), improve dryland modeling. Soil adapted indices were also considered as important in rangeland research (Zandler et al., 2015b; Fern et al., 2018; Ren et al., 2018) although some studies showed contrary results (Baghi and Oldeland 2019). In addition to these variables that are designed to directly detect biophysical vegetation properties, snow is an important plant moisture source in cold drylands (Peng et al., 2010). Therefore, remotely sensed snow variables may be important vegetation proxies and have the potential to contribute to vegetation analysis and monitoring in respective regions (Wang et al., 2013, Wang et al., 2018; Qiu et al., 2019; Zandler et al., 2020). However, only a limited number of studies tested the potential of respective variables for both classification and modeling. In order to contribute to this high priority research topic, we examine following research questions in a remote, high elevation, cold rangeland area of Central Asia with still limited human footprint (Smallwood and Shank 2019) and with continental relevance as a “water tower of Asia” (Viviroli et al., 2007): What is the importance of adapted remote sensing based indices and snow variables in modeling vegetation classes and vegetation cover in cold grasslands? What are central issues for remote sensing based analysis in these regions? What is the potential of snow variables in explaining field and satellite based vegetation anomalies? How can respective approaches contribute to improve the conservation of cold drylands?
Numerous machine-learning algorithms for modeling and assessing related research questions have been proposed and tested in remote sensing literature. Commonly applied methods for classification or regression include random forest (RF), conventional decision trees, support vector machines (SVM), maximum likelihood classifiers, Mahalanobis distance, artificial neural networks, fuzzy adaptive resonance theory-supervised predictive mapping, K-nearest neighbors, boosting techniques with decision trees, quadratic discriminant analysis, Extreme Gradient Boosting and many more (Grabska et al., 2020; Lapini et al., 2020; Raab et al., 2020; Talukdar et al., 2020). Among respective methods, RF is considered as the most widely used classification algorithm (Phan et al., 2020) and a large number of recent studies state good or better performance of the RF approach compared to other techniques (Verrelst et al., 2019; Diesing 2020; Lapini et al., 2020; Talukdar et al., 2020). Furthermore, various studies confirmed the robustness of the RF algorithm (Raab et al., 2020). More recently, deep-learning methods based on neural networks, such as convolutional neural networks (CNN) or recurrent neural networks, showed good potential and some studies found increased performance compared to previously mentioned, non-deep classifiers (Zhang et al., 2020a, Zhang et al., 2020b.; Thorp and Drajat 2021). The majority of these approaches utilized high-resolution data and some studies state that traditional methods such as RF or SVM show similar performance to CNNs with medium resolution sensors (Li et al., 2020). Respective research indicates that the RF algorithm is still widely used, robust and among the best performing techniques among recent remote sensing approaches using medium resolution imagery. Therefore, we apply this method for both classification and cover modeling of vegetation to provide insights on satellite based monitoring approaches in cold grasslands.
2 Materials and Methods
2.1 Study Area
Our research focusses on the Eastern Wakhan in Afghanistan, a 200 km long and about 65 km broad area sharing international borders with China, Pakistan and Tajikistan (Figure 1), which was formally designated as a national park in 2014. This resulted in financial support to management by the government, instigated the development of a management plan and the implementation of regulations. Main measures were a ban on hunting and that several areas and zones benefitted from additional preservation activities including reduced livestock grazing. Illegal hunting was also increasingly monitored and anti-poaching actions were implemented.
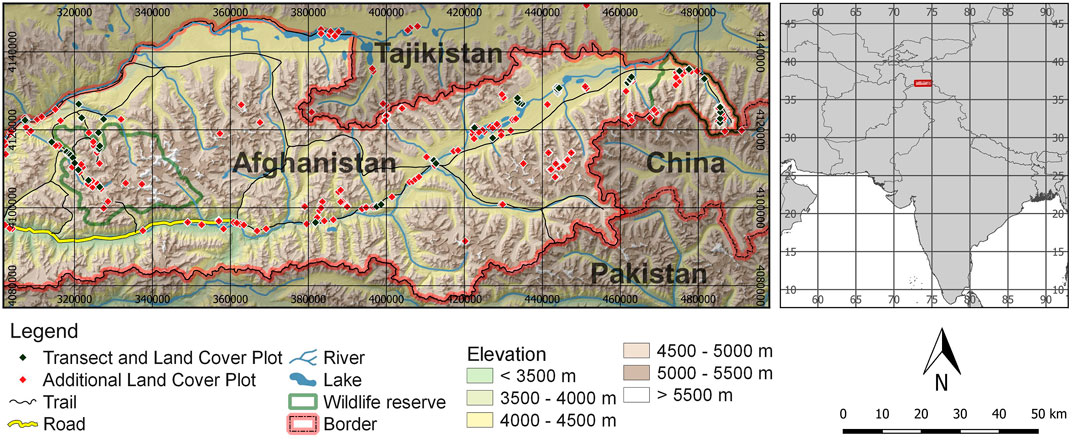
FIGURE 1. Overview of the research area and field plots used for this study. The panel on the right shows the location of the region in Eastern Afghanistan. DEM: NASA (2013), borders: GADM (2018).
This area, located at altitudes between 2,900 m and 6,300 m, is at the junction of the Pamir, Hindukush and Karakoram mountain ranges and is characterized by an arid to semi-arid cold climate. Yearly average temperatures range between −1°C and −3°C, and precipitation sums are around 200 mm in the valleys (Pohl et al., 2015; Zandler et al., 2019). Winter temperatures are cold with subzero temperatures from October until March, with averages around −15°C to −5°C and absolute extremes reaching down to −60°C, whereas in summer, averages are around 10°C and mean maxima reaching about 26°C (State Administration for Hydrometeorology of the Republic of Tajikistan 2013; Metrak et al., 2015; Zandler et al., 2019). Summerly frost and snow events occur repeatedly. Due to the location at a climatological divide, precipitation spatially varies and originates both from the Westerlies with maxima in spring and from the Indian Summer Monsoon with maxima in summer. Zonal climate conditions and local water availability influence vegetation communities that comprise riparian grasslands, Salix riparian communities, salt grass communities, dwarf-shrub deserts and steppes, alpine grasslands and nival scree vegetation communities (Figure 2). Average vegetation cover shows large differences, with values mostly below 20% in steppe communities and above 20% in riparian or alpine grasslands. The region is characterized as one of the few global “essential water towers” with superior importance for the population and ecosystems in the watershed (Viviroli et al., 2007; Smith and Bookhagen 2020). It forms the headwaters of the Amu-Darya, a river that provides water for millions of people downstream (Unger-Shayesteh et al., 2013). The biological significance of the area is illustrated by high diversity of the flora, with about 20% of endemic species (Soelberg and Jäger 2016) such as the extremely rare Epilobium thermophilum Paulsen, Astragalus bahrakianus, Hymenolaena badachshanica, Holosteum kobresietorum K.H. Rechinger, and several endemic Nepeta or Cousinia spp. (Breckle et al., 2013), and fauna, with several rare or vulnerable species such as the snow leopard (Panthera uncia), the Marco Polo sheep (Ovis ammon polii), Siberian ibex (Capra sibirica), urial (Ovis vignei), and large-billed reed warbler (Acrocephalus orinus) (Smallwood and Shank 2019). Similar to large parts of other Asian grasslands and rangelands (Zou et al., 2019), livestock husbandry is the most important economic activity in the region.
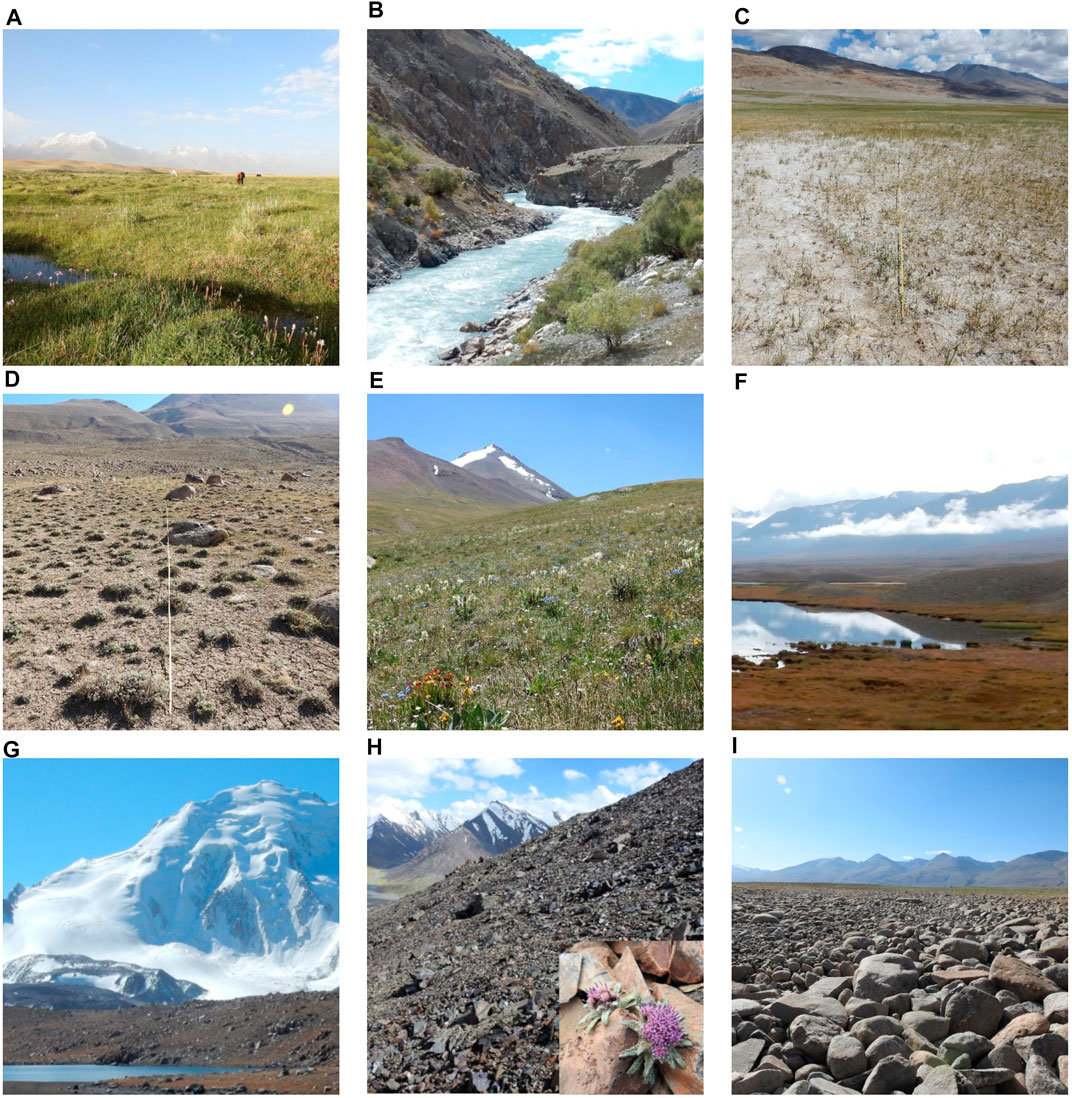
FIGURE 2. Vegetation communities and land cover classes of this study: (A) Riparian grasslands (72 plots), (B) Salix riparian communities (18 plots), (C) salt grass communities (22 plots), (D) dwarf-shrub deserts and steppes (125 plots), (E) alpine grasslands (58 plots), (F) water surfaces (51 plots), (G) snow and ice (30 plots), (H) dark rocks and scree (32 plots), (I) bright rocks and scree (15 plots).
2.2 General Approach and Field Data
To cover the different remote sensing fields relevant for conservation in cold grasslands, our study is structurally divided in three parts: The modeling of vegetation communities, the quantification of foliar vegetation cover and the analysis of temporal snow and vegetation anomalies.
The majority of field data to train and evaluate the models was acquired during the years 2016 and 2018. Fifty meter transects were used for vegetation cover measurements. Transect locations were selected to match long term monitoring locations that were originally established in 2006 and 2007 (Bedunah 2006, Bedunah 2008) to generate temporally consistent values. Additional sampling followed a two-step, stratified random sampling approach to consider ecological and statistical representativeness, as well as resource constraints (Roleček et al., 2007 cf.; Zandler et al., 2015b). First, vegetation stands were preferentially selected to achieve sufficient spatial coverage and distribution among all vegetation communities. Transects were then established using probability sampling with an adapted random walk approach. Foliar cover of living vegetation in percent was measured using the line and point intercept techniques and averaged per transect (Mueller-Dombois and Ellenberg 1974). In total, 93 transects were mapped (cf. Figure 1). Transect ends were used as spatial reference for field mapped vegetation cover. Thereby, point estimates of 186 vegetation cover plots were derived. Information from these transects was also used to create a spatial field dataset for vegetation communities and other land cover classes. Delimitation of vegetation communities followed Vanselow (2011), who created a sophisticated vegetation classification in a similar region of the adjacent Tajik Pamirs using hierarchical cluster analysis. To increase information for mostly unvegetated land cover classes (bright and dark rock and scree areas) and extend data for some undersampled classes, additional plots where mapped in the field. Water and snow or ice plots were included by digitizing respective land classes using a satellite image (n = 81). In total, 423 land cover plots that covered nine different land cover classes were mapped (cf. Figure 2). Furthermore, a small number of previously mapped field plots from 2006 to 2007 (n = 76) was additionally used for temporal anomaly evaluation (Bedunah 2009).
2.3 Satellite Images and Preprocessing
We utilized Level-1C satellite images of the Sentinel-2 sensor (ESA 2020a), acquired on 20th of July 2016 and 15th of July 2018, for land cover classification and vegetation cover modeling (Figure 3). Respective dates were chosen based on minimum cloud cover and as it corresponds to the peak of the regional vegetation period during July and August (Zandler et al., 2020). Calculation of Bottom-Of-Atmosphere reflectance was performed using the Sen2Cor software (ESA 2020b). Bands with 10 m and 20 m resolution were selected for the final analysis. For calculation of Sentinel-2 snow data, we used all available images from March to May, resulting in a total of 37 images, and applied a dense cloud masking approach. To derive elevation information for the land cover classification, the SRTM dataset with a resolution of 30 m was utilized (NASA 2013). MODIS indices of the products MOD13Q1 (Didan 2015) and MOD10A1 V6 (Hall and Riggs 2016) were applied to derive vegetation and snow long-term anomalies for 2001-2020, respectively. The MOD13Q1 data has a spatial resolution of 250 m and delivers Normalized Difference Vegetation Index (NDVI) data at a 16-days interval. Thereby, the product is generated based on best values of a daily NDVI series, i.e. including low cloud coverage and high NDVI values (Didan 2015). The MOD10A1 V6 dataset is based on the Normalized Difference Snow Index (NDSI, Table 1).
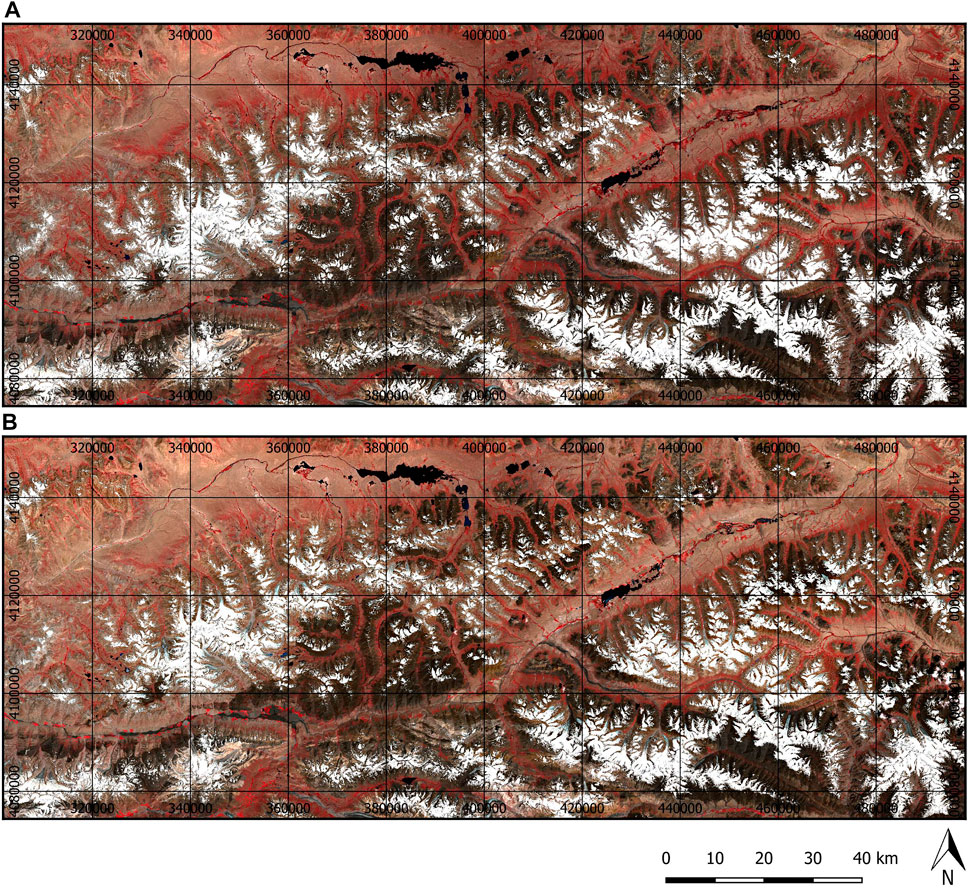
FIGURE 3. Comparison of false color composites (Bands 8-4-3) of (A) 20th of July 2016 and (B) 15th of July 2018 using Bottom-Of-Atmosphere reflectance derived from the Sentinel-2 Level-1C product with the Sen2Cor software.
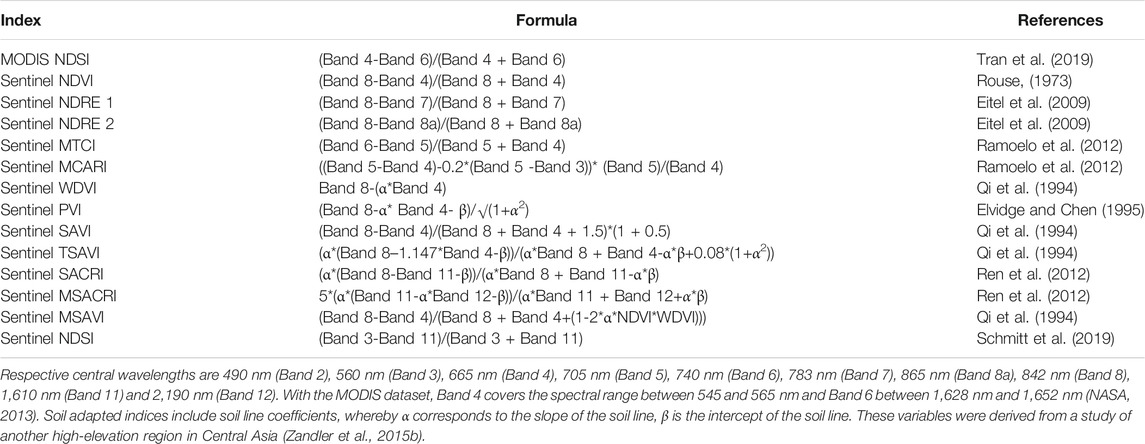
TABLE 1. Overview of utilized vegetation indices. Band designations refer to bands of the Sentinel-2 sensor as outlined in ESA (2015) if not stated otherwise.
The product has a nominal spatial resolution of 500 m and contains NDSI, missing data, water and cloud values on a daily basis (Hall and Riggs 2016). To generate a continuous daily NDSI time series, cloud and other invalid pixels where removed using a simple gap-filling algorithm (cf. Zandler et al., 2020). All pixels with more than 60% missing data, which corresponded to approximately 5% of the research area, were masked for the analysis. Gaps in the NDSI time series were linearly interpolated. For the beginning and the end of the time series, the relevant closest value was used. This simple approach was selected as it is considered as effective, reproducible, transferable and independent (cf. Salomonson and Appel 2006). Finally, both MODIS products were averaged to monthly values.
2.4 Remote Sensing Variables
For Sentinel based applications, we used all 10 m and 20 m bands and a number of vegetation indices as potential predictors in both of our modeling approaches (Table 1). We included the NDVI as one of the most frequently used variables for remote sensing studies in our analysis (Bannari et al., 1995). As red-edge bands were found to greatly improve remote sensing based analysis in drylands (Ren et al., 2011; Schumacher et al., 2016; Li et al., 2017) and the Sentinel-2 sensor offers several bands in this region, we also included two versions of a Normalized Difference Red Edge Index (NDRE) in our analysis. Additionally, the MERIS Terrestrial Chlorophyll Index (MTCI) was included as a red edge based index. Similarly, the Modified Chlorophyll Absorption Index (MCARI) was calculated as it performed well in biomass modeling in a comparable region (Zandler et al., 2015b) and because it covers the non-green or structural parts of vegetation (Ren et al., 2018).
Soil adapted indices, either based on fixed adjustment parameters or on the soil line concept (Qi et al., 1994; Bannari et al., 1995), are considered to be particularly suitable for low vegetation cover conditions. Therefore, several such indices, such as the Weighted Difference Vegetation Index (WDVI) or the Perpendicular Vegetation Index (PVI), were used for modeling and classification in this approach. Further indices that where designed to be robust against soil brightness variations and may be advantageous in cold drylands are the Soil-Adjusted Vegetation Index (SAVI, Huete 1988) and the Transformed SAVI (TSAVI, Qi et al., 1994). We included two additional indices that showed reasonable performance for detecting dry vegetation matter in other environments: the Soil-Adjusted Corn Residue Index (SACRI) and the Modified Soil-Adjusted Crop Residue Index (MSACRI) (Li and Guo 2018; Ren et al., 2018). Finally, we calculated Modified SAVI (MSAVI), as recent research showed that this index may provide an improved vegetation signal compared to traditional indices as it is more robust to soil noise (Vanselow and Samimi 2014; Vanselow et al., 2018; Wu et al., 2019).
Sentinel NDSI was calculated in analogy to the MODIS products. As the majority of snowfall in the region occurs in spring and respective season showed to be particularly important for vegetation in existing research (Pohl et al., 2015; Zandler et al., 2020), we averaged snow related metrics of Sentinel and MODIS for the months of March, April and May. For MODIS, we calculated anomalies as the deviation from the 2001–2020 mean. For Sentinel, we calculated the average NDSI for 2018 only, as almost no satellite images were available in 2016 during the relevant period. Topography is important for the water budget. Therefore, it influences the distribution of vegetation communities in arid regions (Sternberg and Shoshany 2001; Vanselow and Samimi 2014). Accordingly, we included the variables elevation in meters, slope in degrees, cosine and sine of aspect in radians (referred to as “northerness” and “eastness” respectively, ranging e.g., from −1 for southern orientation to +1 for northern orientation) for the land cover classification using the SRTM data.
2.5 Models and Statistical Analysis
The generated products were combined in different ways for modeling approaches and anomaly calculations (Figure 4). For remote sensing based vegetation mapping with many possible predictor variables, a large number of potentially useful models exist (Zandler et al., 2015b; Verrelst et al., 2019). In cold drylands, existing studies showed good performance of LASSO for vegetation quantification (Zandler et al., 2015b), whereas the RF approach (Breiman 2001) was frequently and successfully used for vegetation quantification (Vanselow and Samimi 2014; Schumacher et al., 2016) and classification (Kraudzun et al., 2014; Hu and Hu 2019; Zhang et al., 2019). To allow for good comparability between modeling of vegetation quantities and vegetation classes, as well as with other research approaches, we selected the RF approach for multivariate models in this study (Breiman 2001; James et al., 2013). We used the standard definition of model parameters because other studies indicate very limited impact of parameter tuning on model performance (Diesing 2020). An evaluation of the performance and the modeling errors needs to consider spatial dependence of samples and independence of training and test data (Brenning 2012). Existing research showed that single splits into training and test datasets have high variance and do not provide robust accuracy assessments (Lyons et al., 2018). Furthermore, the spatial structure that is characteristic for data of drylands and other environments requires a spatial validation approach. Therefore, we performed a spatial, 100-repeated 10-fold cross-validation with k-means clustering (Ruß and Brenning 2010) using the R-package sperrorest (Brenning 2012) for land cover modeling and classification, as respective technique resulted in robust accuracy metrics in existing research (Zandler et al., 2015b; Lyons et al., 2018). To compare results to simple non-spatial cross-validation, a methodology still frequently applied in grassland studies, we also ran the models without the spatial validation approach. Variable importance assessment was performed using the Boruta algorithm as existing research provides evidence that it is the most powerful method with large sets of predictor variables (Degenhardt et al., 2019). Thereby, we applied the Boruta R-package (Kursa and Rudnicki 2010) with a p value of 0.05 and 500 importance source runs and repeated the whole calculation 500 times to account for stochastic variability due to the random forest classifier (cf. Zandler et al., 2020). Finally, we derived the importance scores averaged over all importance source runs and repetitions. For vegetation cover modeling, we also tested single predictor variable models to compare the snow variable with the commonly used NDVI in regions with very low vegetation cover (<20%). For this approach, we selected an ordinary least squares approach with the same cross-validation procedure.
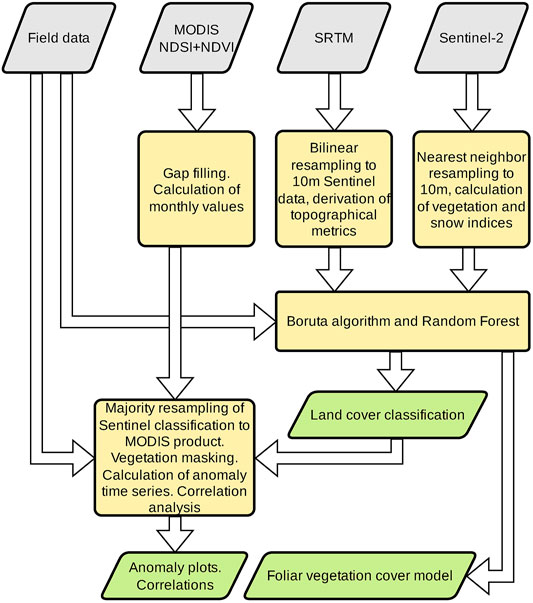
FIGURE 4. Methodological overview of the utilized products, processing and outputs.
For the temporal analysis of snow and NDVI anomalies, we used Pearson’s correlation to compare the time series anomalies as we expect linear relations between respective variables (Wang et al., 2018; Chen et al., 2020). Thereby, MODIS NDSI anomalies were calculated for spring and MODIS NDVI anomalies were averaged over the peak of the vegetation period (July, August). The latter period was used to maximize the vegetation signal (cf. Zandler et al., 2020). Furthermore, we correlated respective satellite based anomalies with field data measurements. All temporal analysis and the vegetation cover model were restricted to vegetated areas as given by the land cover classification. To convert the high-resolution Sentinel-2 classification to the coarser MODIS dataset, we applied a majority-resampling method, i.e. we assigned those classes to the MODIS pixels that showed the maximum number of pixels in the original classification. It is important to state that different resampling approaches may lead to small variations in the results, but we selected this method as other studies showed small variations of about one percentage point across their tested resolutions with this approach (Oyana et al., 2014). For temporal anomalies, the land cover classes riparian grasslands, Salix riparian communities and salt grass communities were summarized to one class riparian areas due to their ecological dependencies of azonal ground or surface water.
3 Results
3.1 Land Cover Classification
The land cover classification showed well-defined vegetation communities and partly zonal distributions of vegetation classes (Figure 5).
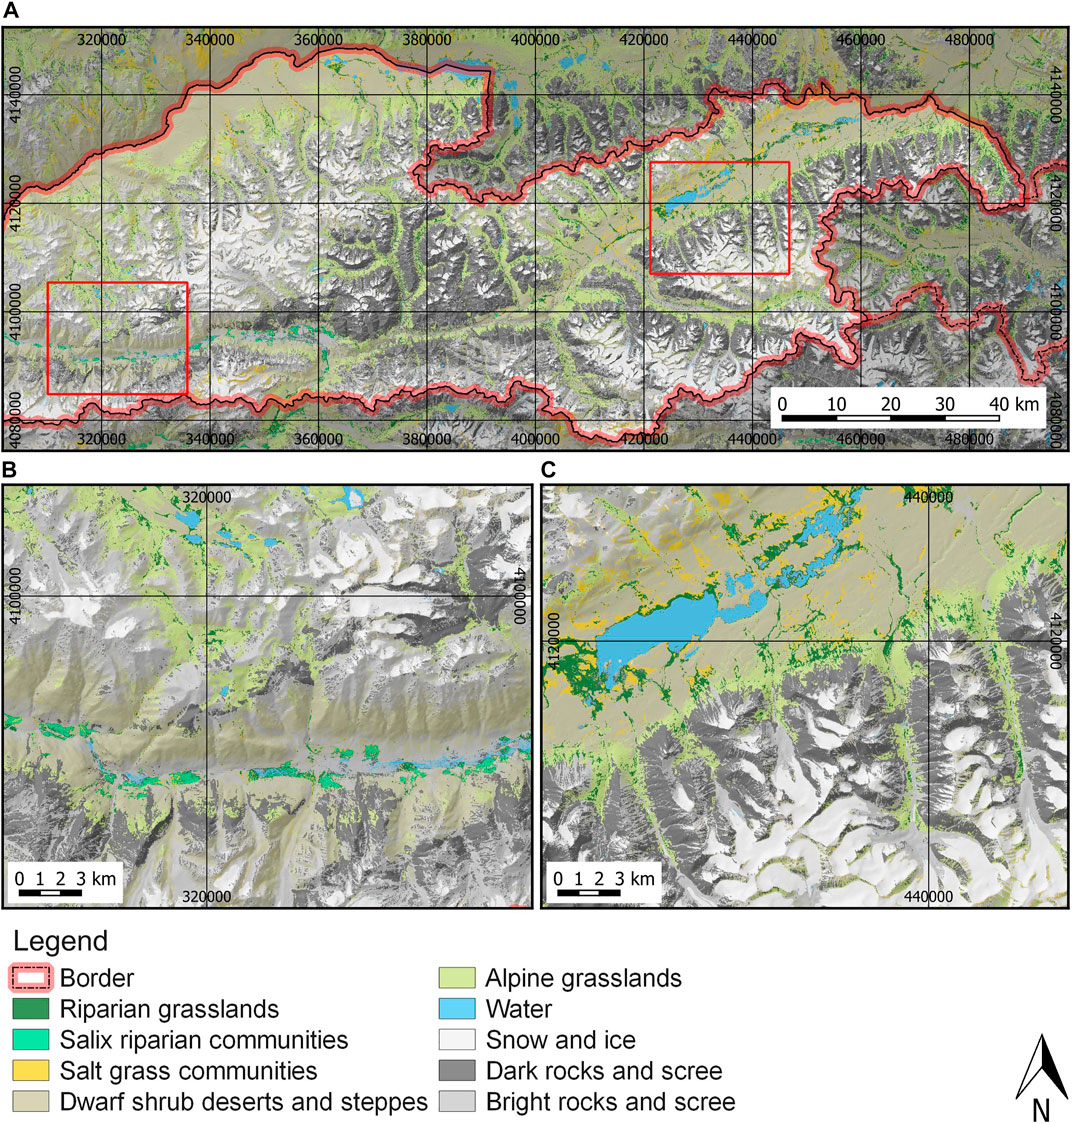
FIGURE 5. Overview of modeled vegetation classes for the year 2018 including NDSI as a snow variable (A), with details of the lower regions in the South-West with Salix riparian communities (B) and the lakes in the East with adjacent Salt grass communities (C).
The overall cross-validated accuracy of the models ranged between 80% in 2018 and 81% in 2016 and was highly significant (Table 2). There was no difference in performance measures with our without snow variables. If spatial cross-validation was ignored, accuracy measures were about ten percentage points higher. Accuracy measures showed some variations between classes. Dwarf-shrub deserts and steppes, water, snow and dark rock and scree classes had highest accuracies in both years with balanced values above 85% (Table 3, Table 4). Riparian grasslands and alpine grasslands resulted in relatively high performances with minimum balanced accuracy of 69%. Salix riparian communities and salt grass communities showed higher errors and minima of balanced accuracies around 40%. Salix riparian communities were mainly confused with riparian grasslands, and salt grass communities with dwarf-shrub steppes and deserts. These classes performed much better in 2018, whereas the bright rocks and scree class performed worse in 2018. However, alpine meadows, riparian grasslands and dwarf-shrub deserts performed better in 2016. In summary, yearly differences were small with slightly better performance of the vegetation classes in 2016.
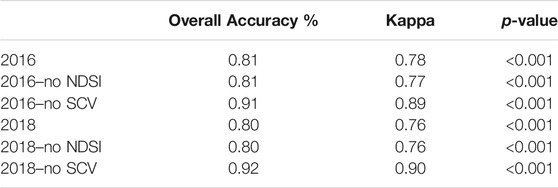
TABLE 2. Overall performance of the land cover classification and comparison to performance assessment without spatial cross-validation. Models without snow variables are labeled with “no NDSI.” All p-values were very highly significant.
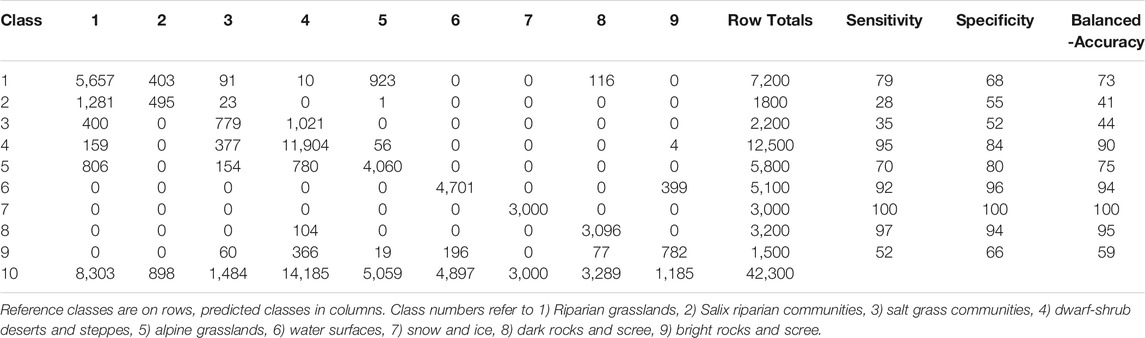
TABLE 3. Confusion matrix of test data summed over all repetitions and folds for the 2016 model including snow variables.
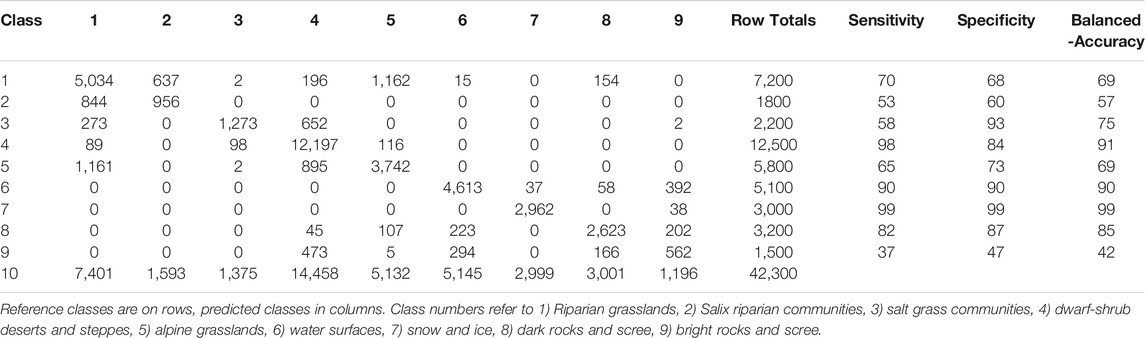
TABLE 4. Confusion matrix of test data summed over all repetitions and folds for the 2018 model including snow variables.
Elevation, MSACRI, SACRI and slope were among the five most important variables according to the repeated Boruta algorithm in both years (Figure 6). No variable was considered as unimportant in both years, but the variable “northerness” was relatively close to the maximum of the randomly shuffled shadow variables. The NDVI and the snow variable NDSI were also among the ten most important variables, whereby the latter ranked higher in both years. Sentinel-2 Band 12 and MSAVI also showed high importance scores. All other predictors showed larger variability between the years.
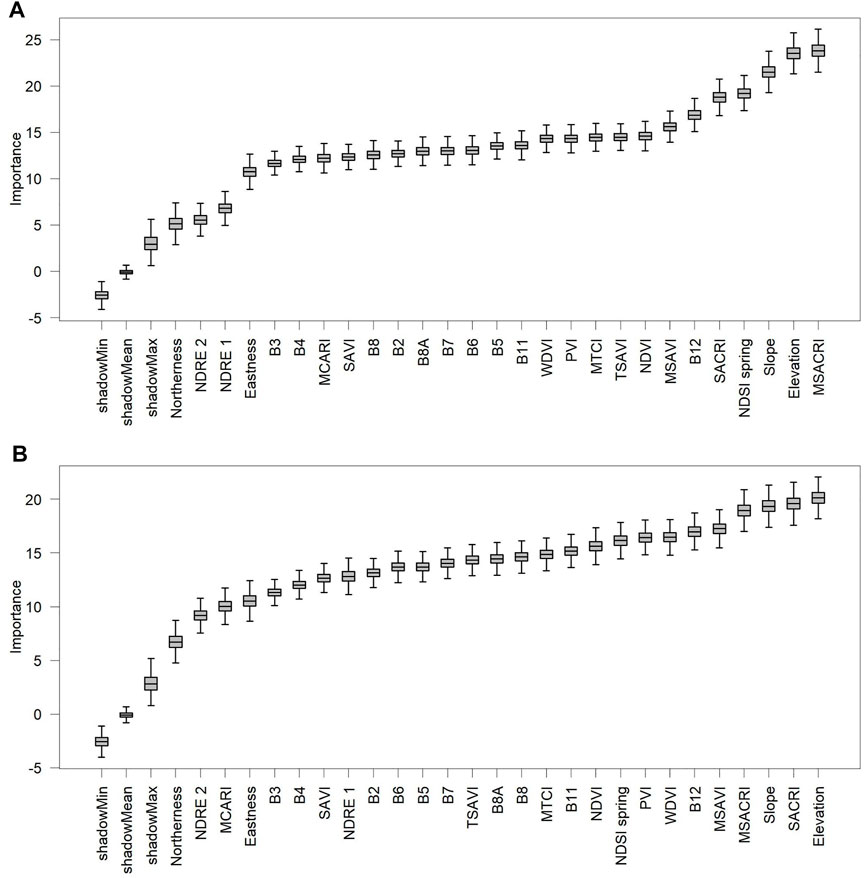
FIGURE 6. Variable importance for the land cover classification derived from a 500-repeated Boruta algorithm in 2016 (A) and 2018 (B).
3.2 Foliar Vegetation Cover Model
Cross-validated R2 values of multivariate models ranged between 0.77 (2016) to 0.80 (2018) and showed RMSE values of 11.23 percentage points in 2018, compared to a standard deviation of measured cover of 24.81%, and 12.85 percentage points in 2016, compared to a standard deviation of measured cover of 27.03% (Table 5). All multivariate models showed a small negative bias. Performance differences between models with snow variables and models without snow variables were minimal for multivariate models. If spatial cross-validation was not performed, performance measures increased by about 0.1 in R2 and three cover percentage points in RMSE due to positive spatial evaluation bias. Models with only one predictor and limited to low vegetation cover regions (<20%) showed better performance of NDSI compared to NDVI by about 0.3 in R2 and 0.6 in RMSE. Furthermore, single NDVI models did not result in suitable models if compared to the field-measured standard deviation. Maps of modeled foliar vegetation cover showed larger values near rivers or lakes and in higher elevations (Figure 7).
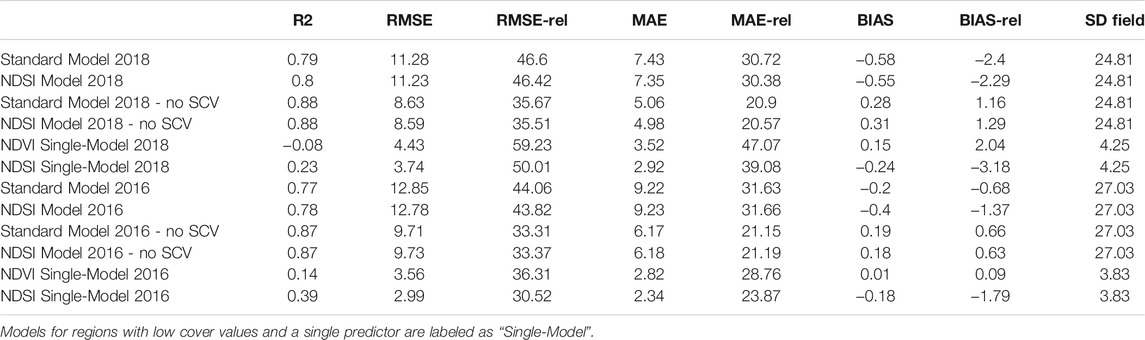
TABLE 5. Performance measures of the foliar vegetation cover models with data from the years 2016 and 2018 and comparison to performance assessment without spatial cross-validation (labeled “No SCV”). Standard models are models without snow variables in contrast to models that include NDSI as a predictor.
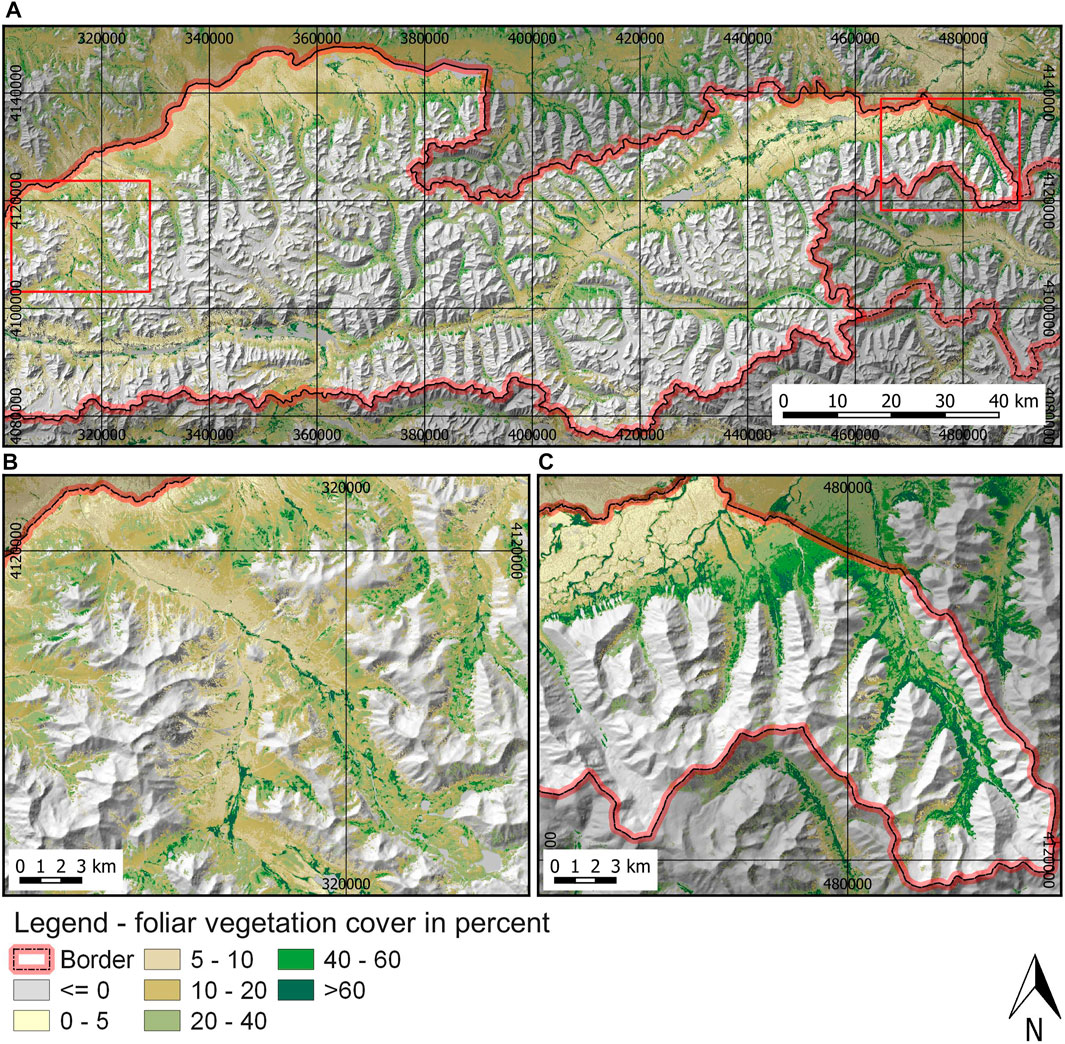
FIGURE 7. Overview of modeled foliar vegetation cover for the year 2018 (A), with details of parts of the Big Pamir wildlife reserve in the West (B) and the Teggermansu wildlife reserve in the East of the research area (C).
MSACRI was the most important variable in both years according to the 500-repeated variable importance assessment (Figure 8). Generally, almost all variables were considered important for the cover model, with the exception of NDRE 2 in 2016, which did not result in higher importance scores than randomly shuffled shadow variables. Importance of other variables was comparable between the years with some differences. Generally, Band 2, 4 and 12, TSAVI, NDVI, MTCI and MSAVI were among the ten most important predictors in both years. Other variables showed higher differences between the years.
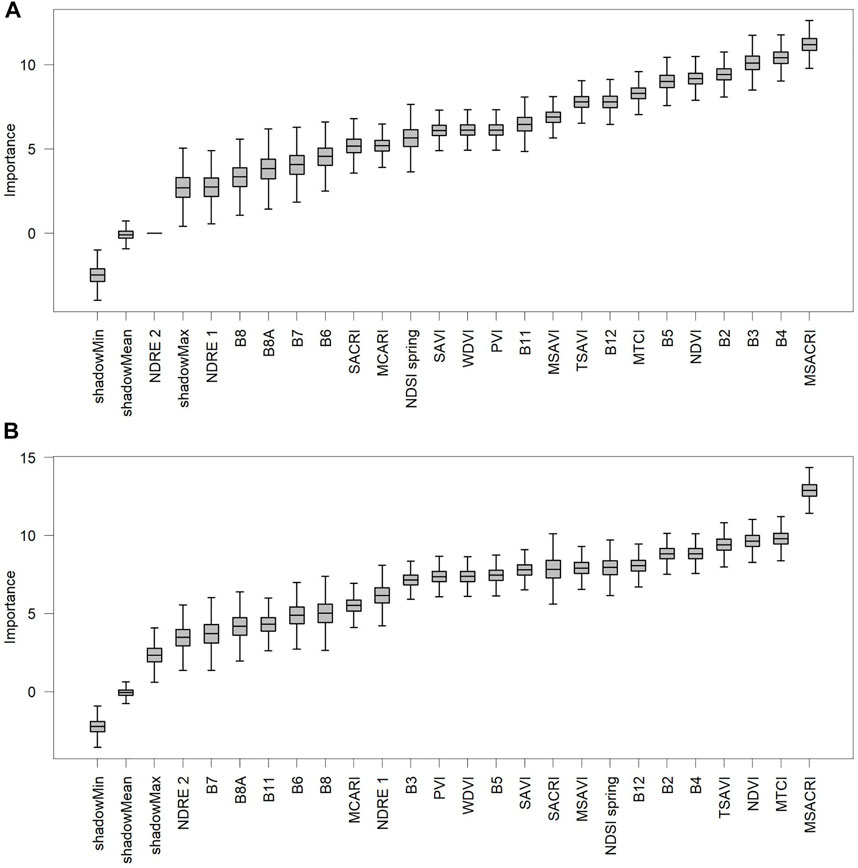
FIGURE 8. Variable importance for the foliar vegetation model derived from a 500-repeated Boruta algorithm in 2016 (A) and 2018 (B).
3.3 Snow and Vegetation Anomalies
MODIS based snow and NDVI anomalies 2001–2020 showed largely similar variations over time (Figure 9). Median values of field-measured foliar vegetation cover anomalies had a comparable pattern to NDSI variations. MODIS based correlations were positive and highly significant with overall Pearson’s r of 0.68 (Table 6). Separate analysis of different vegetation communities showed that riparian areas and dwarf-shrub steppes had similar overall correlations, but alpine grasslands had much higher correlation values. The correlation of MODIS spring NDSI and field measured foliar vegetation cover anomalies was relatively high in alpine grasslands (r of 0.74), but showed much lower correlations in dwarf-shrub steppes and no significant correlation in riparian areas.
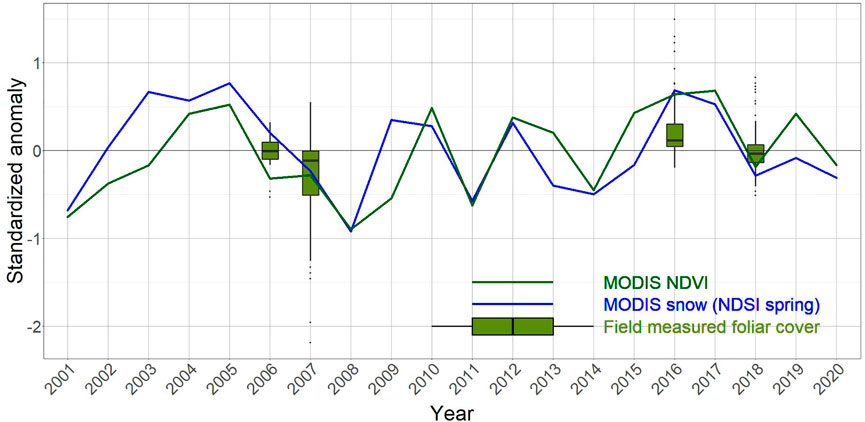
FIGURE 9. Standardized anomaly time series of MODIS NDVI during the peak of the vegetation period (July, August) and MODIS NDSI in spring (March-May) compared to field-measured foliar vegetation cover in July and August.
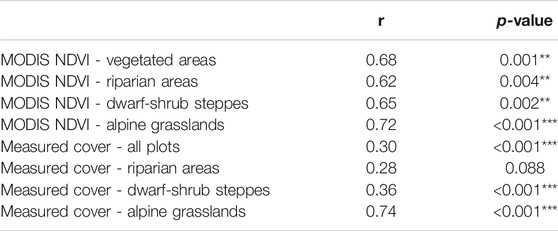
TABLE 6. Results of Pearson correlation analysis of MODIS time series raster anomalies 2001-2020 averaged over the whole area (MODIS) and correlation between MODIS NDSI anomalies and field-measured foliar vegetation anomalies for the years 2006,2007,2016 and 2018 (measured cover). Asterisks indicate significant correlations.
4 Discussion
4.1 Performance of Models
To our knowledge, this research study is the first that systematically evaluates remote sensing variables for both vegetation classification and vegetation quantification in Asia’s cold drylands and during different years. The general performance of the models was good for the 2 years with similar or better accuracies if compared to other dryland studies (Vanselow and Samimi 2014; Wang et al., 2019; Zhang et al., 2019). However, direct quantitative comparisons between studies from different regions and with different research designs are generally problematic (Zandler et al., 2015b).
Regarding the vegetation classification, a notable difference in accuracies between different classes was visible. It showed highest errors in some ground water influenced classes such as Salix riparian communities, which were confused with riparian meadows, and salt grass communities, which were often classified as dwarf shrub steppes. This may be mainly caused by the fact that respective classes frequently form a small-scale mosaic with various transitions depending on the water table and micro relief (Mętrak et al., 2017), which makes accurate classification difficult due to the spatial resolution and spectral ambiguousness (Smith et al., 2019). Similarly, related spectral signals of alpine grasslands and riparian grasslands due to conformity of a number of plant genera most likely increased errors in respective classes. Nevertheless, the predominant vegetation communities showed good performance measures with very high accuracies of dwarf-shrub steppes compared to existing research (Vanselow and Samimi 2014; Hu and Hu 2019). Future approaches may further benefit from combining respective non-deep learning techniques with neural network based approaches and high-resolution imagery (Li et al., 2020; Thorp and Drajat 2021).
The temporal evaluation showed that yearly performance differences were small in total, but some classes, such as Salix riparian communities, salt grass communities and bright rocks and scree showed stronger variations in performance between the years. This may be explained by different weather patterns, whereby 2016 was relatively wet and 2018 a much drier year in comparison (Figure 9). High water availability in 2016, also due to meltwater, may have led to increased plant vigor and greenness in shallower rooted riparian grasslands, which increased spectral similarity to the deep rooted Salix riparian communities, characterized by dense vegetation and very high greenness. In the case of salt grass communities, which were increasingly confused with dwarf shrub deserts and steppes in 2016, the higher water availability may have disproportionally enhanced greenness in the steppe communities due to higher forb cover, also increasing spectral similarity. However, the greener conditions in dwarf shrub steppes in 2016 may have contributed to the separation to bright rocks, which was worse in 2018. Finally, drier conditions may have led to more confusion between the rock classes in 2018, as soil moisture increases the effectiveness of the infrared reflectance region and has various impacts on vegetation indices (Tucker and Miller 1977; Todd and Hoffer 1998).
Our comparison of the spatial cross-validation approach with ordinary, non-spatial cross-validation underlined the need to consider spatial auto-correlation in evaluation approaches with clustered data in general, but especially in Asia’s cold grasslands. Our analysis shows that ignoring spatial effects in the evaluation may lead to positive evaluation bias of around 0.1 in R2 and an underestimation of 25% in RMSE and over 30% in MAE. Respective results are supported by remote sensing studies of other regions (Mayr et al., 2018; Meyer et al., 2019; Fauvel et al., 2020). This reinforces that remote sensing studies without spatial validation approaches have to be treated with caution in case of clustered field data.
4.2 Importance of Predictor Variables
Importance assessment showed a noticeable emphasis on indices including background information as the most relevant predictors but covered different wavelengths. In all years and models, MSACRI was among the most important variables. The reasons for the relevance of this predictor may be a result of the incorporated soil correction (Fern et al., 2018) and the coverage of non-photosynthetic vegetation signals with the index (Ren et al., 2018). Influence of soil is considered as a main obstacle in remote sensing of drylands and specific methods are necessary to account for the background influence on the spectrum (Eisfelder et al., 2012; Smith et al., 2019). Although living vegetation was the dependent variable, the coverage of senescent vegetation, litter and woody vegetation parts, which are captured by MSACRI (via the inclusion of SWIR spectral bands), contributed to the total vegetation signal and was highly important for vegetation modeling in this environment (Zandler et al., 2015a; Ren et al., 2018). Other predictors that showed high importance in all assessments were the MSAVI, Band 12 and the NDVI. The SWIR Band 12 further supports the relevance of covering vegetation signals of lignin or cellulose. The prominence of the SWIR for vegetation analysis in drylands, and the better ability to capture vegetation cover differences compared to traditional indices is also supported by research on drylands from other continents (Poitras et al., 2018). Therefore, our results propose that including SWIR bands and indices in remote sensing based research studies is of high relevance to Asia’s grasslands. The importance of MSAVI is additional evidence that the incorporation of soil-adjusted indices greatly improves vegetation models (Svinurai et al., 2018). However, also the commonly used index NDVI was highly important in all approaches. Both MSAVI and NDVI include red and infrared bands, which shows that this spectral region is continuously essential for remote sensing-based vegetation analysis in cold grasslands. These results also raise expectations of new index adjustment methods for dryland research such as soil adapted indices that combine near infrared and SWIR bands (Chen X. et al., 2019).
Although medium-resolution studies analyzed vegetation-snow relationships in the past (Wang et al., 2013, 2018), this is the first study that tests higher-resolution snow variables for vegetation modeling and classification in cold grasslands. It is noteworthy that although snow variables were considered as important for vegetation models and were frequently found in the top ten regarding median importance scores, their removal did not lead to lower performance of the multivariate models. Therefore, other indices or bands may substitute respective snow information for spatial modeling of vegetation. However, the importance assessment shows the high relevance of snow variables for vegetation communities and vegetation cover in cold drylands, and provides evidence that temporal anomalies of higher-resolution snow variables may serve as important climate proxies in the future. The relatively low temporal resolution of Sentinel-2 imagery prior to the year 2018, which was greatly improved with the launch of the Sentinel-2B satellite in 2017 (ESA 2020a), prevented temporal analysis of this variable in this study. Linear, single variable models had a very low performance in general, but showed that in regions with very low cover values (<20% cover), NDSI was a better proxy of vegetation cover than the NDVI. This may be explained by strong soil background reflectance, resulting in a greater impact on NDVI variability than the marginal vegetation signal of scarce vegetation (Smith et al., 2019). This shows the importance of snow cover algorithms for products with high spatial and temporal resolutions (Piazzi et al., 2019). However, it is important to consider that snow variables are not directly related to vegetation properties and hence, their application for vegetation modeling is generally limited.
Most red-edge based indices were situated at the lower end of the median importance range in this study. This is in contrast to existing research approaches that reported good performance of this spectral region in grassland modeling (Sibanda et al., 2017; Lin et al., 2019; Filho et al., 2020), although some studies only stated insignificant contribution of red-edge bands (Cai et al., 2020). However, the MTCI, which uses the two lower wavelength red-edge bands, was among the ten best variables in almost all models. Therefore, the selection of the appropriate red-edge bands may be crucial in modeling vegetation of different grasslands. The lower resolution of the red-edge bands (20 m) compared to infrared and red bands (10 m) may also be a reason for the lower importance of red-edge indices in this region with high spatial heterogeneity and small-scale vegetation patterns (cf. Zarco-Tejada et al., 2018).
4.3 Temporal Correlation of Vegetation and Snow Anomalies
Existing research showed a positive relationship between vegetation and snow cover derived from MODIS in cold drylands of other regions (Wang et al., 2013, Wang et al., 2018), which is in agreement with this study. Regarding different land cover classes, our results also confirm that the strongest coupling of snow to vegetation occurs in alpine grasslands. In contrast to existing research, which reported no correlation between snow variables and vegetation proxies in shrub steppes (Wang et al., 2018), the satellite based analysis showed a strong positive correlation in our research area.
In addition to satellite based NDVI data, we also analyzed the correlation of snow variables with field-measured vegetation anomalies, a subject hitherto rarely studied. Respective results confirmed the satellite based analysis, providing valuable field evidence for the applicability of snow variables in assessing vegetation dynamics. The main reason for stronger coupling of snow and vegetation in alpine grasslands may be found in the species composition, with larger shares of grasses that show faster reaction times to water variability in the upper soil layer than woody vegetation with deeper rooting plants (Li et al., 2013). Furthermore, snow cover may also have a positive effect on plants due to an insulation effect during the cold season in higher altitudes (Wang et al., 2013, Wang et al., 2018) and some studies also stated increased climate sensitivity of vegetation in higher elevations (Li et al., 2019). Dwarf-shrub steppes also showed correlations with snow but the strength of the correlation was lower. A main reason for this is the longer response times of woody vegetation to weather variability and the relative drought tolerance of dwarf-shrubs (Zhu et al., 2019). Finally, field based anomalies in riparian areas showed no correlation with NDSI variations and the lowest correlations for the NDVI time series. This may be caused by lower direct coupling to atmospheric water amounts and higher influence of ground water, glacial melt water variations or other hydrological impacts in other parts of the watershed (cf. Zandler et al., 2020).
Our results thereby show that although snow variables are not applicable to model vegetation communities that are influenced by surface or ground water, they serve as important indirect climate proxies for vegetation monitoring. The main advantage of this variable compared to other climate elements is that snow is detectable using high-resolution remote sensing methods. This may provide a new spatial level of vegetation monitoring in Asia’s cold drylands with Sentinel-2 or even higher resolution data such as PlanetScope or SkySat. The presented snow-vegetation relationship may also be of high relevance for grassland management and premature determination of livestock stocking rates based on spring snow conditions.
4.4 Remote Sensing and Mitigation of Infrastructure Encroachment and Land-Use Impacts in Cold Drylands
Remote sensing is one of the main tools available for mapping and monitoring vegetation, land cover and associated patterns of biodiversity across large landscape scales (Wang and Gamon 2019). Data derived from the present study support that remote sensing could provide accurate qualitative and quantitative information on the land cover of cold drylands. In Asia, these ecosystems are currently exposed to an unprecedented level of human-induced vegetation change and various disturbances resulting from the Belt and Road Initiative (BRI), potentially the largest infrastructure development once in a lifetime (Ascensão et al., 2018; Lechner et al., 2018). The expansion of land transportation infrastructure from China to Europe across the cold drylands of Central Asia and the induced land disturbance, including raw material extraction and the associated fragmentation of surrounding landscapes, will degrade ecosystem services in one of the main “water towers” of Asia. These impacts will potentially push some fragilized ecosystems to abrupt changes in quality and functionality (Leadley et al., 2014), resulting in unknown consequences for the populations in the watershed. Stakeholders must therefore carefully consider trade-offs between economic gains and ecosystem loss and plan effects mitigation or alternative solutions that minimize impacts (Hughes 2019).
The first step to reduce impacts associated with transportation infrastructure development is to determine where they are likely to occur, and to which extent they may affect the functionality of the landscape. Remote sensing tools assessed in the present paper offer the capability and spatial accuracy necessary to meaningfully model impact on cold drylands and associated biodiversity, and support the development of mitigation strategies. These remote sensing tools are also available to help BRI developers integrate the cumulative effects of climate change and ecological interactions (e.g., livestock grazing) into the needed risk assessment matrix. They help strengthen and lend credibility to the use of best practices such as strategic environmental and social assessments (Ascensão et al., 2018), and science-based pre-assessment of land cover and biodiversity impacts, even before investments are made for environmental impact assessment studies. Furthermore, respective tools may contribute to disentangle effects of climate change and human induced activities which had severe impacts on cold drylands in the past decades (Wu et al., 2014; Mirzabaev et al., 2016; Chen T. et al., 2019).
The comparison of remote sensing based environmental variables to usage intensity indicators such as livestock grazing density may provide important insights and support development of sustainable and biodiversity-inclusive grazing schemes. Satellite based models can also help characterize pasture quality, livestock and wildlife carrying capacity, seasonal forage distributions, optimal timing for grazing and serve as valuable foundation for decision makers in respective environments (Egeru et al., 2015).
5 Conclusion
This study showed that in addition to variables covering the near infrared wavelengths, soil adjustment methods and the SWIR spectral regions are particularly important for land cover classification and vegetation quantification in cold grassland environments. High-resolution snow variables were considered important in all models, which illustrates the relevance of snow for vegetation of respective ecosystems. The comparison of spatial cross-validation compared to ordinary cross-validation provided further evidence for the necessity of validation approaches that consider spatial patterns in respective ecosystems with clustered data. Temporarily, snow anomalies were highly and positively correlated to NDVI and field measured vegetation anomalies. Respective insights contribute to the understanding of grasslands by highlighting important variables and remotely sensed climate proxies. The relevance of snow variables also indicates that future research may greatly benefit from longer time series of high spatiotemporal-resolution satellite data in understanding grassland dynamics in Asia’s cold drylands. The results of presented research supports that remote-sensing models can accurately predict the qualitative and quantitative features of vegetation in cold drylands.
Data Availability Statement
The datasets presented in this article are not readily available because access to raw field data is restricted by the involved organizations and authorities and may be availalbe on request. All utilized raster datasets are available for download free of charge from the respective sources in the reference list. Requests to access the datasets should be directed to SF, spoyafaryabi@wcs.org.
Author Contributions
HZ designed the study, conducted the analysis and wrote major parts of the manuscript. SF contributed to the discussion and coordinated parts of the fieldwork. SO contributed to writing, to the discussion, specification of research questions and reviewed the manuscript.
Funding
Field work of the study was supported by the UNDP GEF grant AA/Pj/PIMS: 00076820/0088001/5038; and Fondation Segré grant “Transboundary Conservation of Mountain Monarchs in Afghanistan and Pakistan”. This publication was funded by the Deutsche Forschungsgemeinschaft (DFG, German Research Foundation)—491183248 and by the Open Access Publishing Fund of the University of Bayreuth, and the European Union project “Improving participatory management and efficiency of rangeland and watershed focusing on Wakhan, Yakawlang, Kahmard and Saighan Districts (Contract ACA/2018/399-742)”.
Conflict of Interest
The authors declare that the research was conducted in the absence of any commercial or financial relationships that could be construed as a potential conflict of interest.
Publisher’s Note
All claims expressed in this article are solely those of the authors and do not necessarily represent those of their affiliated organizations, or those of the publisher, the editors and the reviewers. Any product that may be evaluated in this article, or claim that may be made by its manufacturer, is not guaranteed or endorsed by the publisher.
Acknowledgments
We thank the Government of Afghanistan and GEF/UNDP for granting the Wildlife Conservation Society to execute the project “Establishing integrated models for protected areas and their co-management in Afghanistan,” under which the study was carried out. Special thanks go to Richard Paley, Country Director of WCS Afghanistan for his inspiring leadership, and Ismaily, Salahudin Ismaily, Ali Madad Rajabi, Shanbe Shirzad, Ayan Big, Aziz Big, Karmal, the WCS Kabul and Wakhan teams for their invaluable support on the ground. We are also grateful to the Afghan people for their hospitality and support during the fieldwork. We also want to thank the cited dataset creators for making satellite imagery freely available. Finally, we thank the four reviewers for their time and effort in reviewing and improving the manuscript.
Supplementary Material
The Supplementary Material for this article can be found online at: https://www.frontiersin.org/articles/10.3389/fenvs.2022.684589/full#supplementary-material.
References
Ascensão, F., Fahrig, L., Clevenger, A. P., Corlett, R. T., Jaeger, J. A. G., Laurance, W. F., et al. (2018). Environmental Challenges for the Belt and Road Initiative. Nat. Sustain. 1, 206–209. doi:10.1038/s41893-018-0059-3
Asner, G. P., Wessman, C. A., Bateson, C. A., and Privette, J. L. (2000). Impact of Tissue, Canopy, and Landscape Factors on the Hyperspectral Reflectance Variability of Arid Ecosystems. Remote Sensing Environ. 74, 69–84. doi:10.1016/s0034-4257(00)00124-3
Bannari, A., Morin, D., Bonn, F., and Huete, A. R. (1995). A Review of Vegetation Indices. Remote Sensing Rev. 13, 95–120. doi:10.1080/02757259509532298
Bedunah, D. J. (2009). Description of Wakhan Corridor Vegetation and Land Classes Delineated in the Supervised Land Classification Wildlife Conservation Society Report. Available at: https://global.wcs.org/DesktopModules/Bring2mind/DMX/Download.aspx?EntryId=6275&PortalId=87&DownloadMethod=attachment&test=1 (Accessed January 20, 2021).
Bedunah, D. J. (2006). Rangeland Assessment of the Wakhan - 2006 Interim Report. Wildl. Conservation Soc. Rep. Available at: http://pdf.usaid.gov/pdf_docs/pnadj591.pdf (Accessed January 20, 2021).
Bedunah, D. J. (2008). Rangeland Assessment of the Wakhan Corridor Study Areas - Results from the 2007 Field SeasonWildlife Conservation Society Report. Available at: https://global.wcs.org/DesktopModules/Bring2mind/DMX/Download.aspx?EntryId=6444&PortalId=87&DownloadMethod=attachment&test=1 (Accessed January 20, 2021).
Breckle, S. W., Hedge, I. C., and Rafiqpoor, M. D. (2013). Vascular Plants of Afghanistan - an Augmented Checklist. Bonn: Scientia Bonnensis.
Brenning, A. (2012). “Spatial Cross-Validation and Bootstrap for the Assessment of Prediction Rules in Remote Sensing: the R Package Sperrorest,” in Geoscience and Remote Sensing Symposium (IGARSS), 2012 IEEE International (IEEE). Available at: http://ieeexplore.ieee.org/xpls/abs_all.jsp?arnumber=6352393 (Accessed August 6, 2015).
Burrell, A. L., Evans, J. P., and Liu, Y. (2018). “The Addition of Temperature Significantly Improves the Detection of Land Degradation in Cold Drylands Using the TSS-RESTREND Methodology,” in IGARSS 2018 - 2018 IEEE International Geoscience and Remote Sensing Symposium (Valencia: IEEE, 4853.doi:10.1109/IGARSS.2018.8519288
Cai, Y., Zhang, M., and Lin, H. (2020). Estimating the Urban Fractional Vegetation Cover Using an Object-Based Mixture Analysis Method and Sentinel-2 MSI Imagery. IEEE J. Sel. Top. Appl. Earth Observations Remote Sensing 13, 341–350. doi:10.1109/JSTARS.2019.2962550
Chen, T., Bao, A., Jiapaer, G., Guo, H., Zheng, G., Jiang, L., et al. (2019a). Disentangling the Relative Impacts of Climate Change and Human Activities on Arid and Semiarid Grasslands in Central Asia during 1982-2015. Sci. Total Environ. 653, 1311–1325. doi:10.1016/j.scitotenv.2018.11.058
Chen, X., Guo, Z., Chen, J., Yang, W., Yao, Y., Zhang, C., et al. (2019b). Replacing the Red Band with the Red-SWIR Band (0.74ρred+0.26ρswir) Can Reduce the Sensitivity of Vegetation Indices to Soil Background, 15.
Chen, Z., Wang, W., and Fu, J. (2020). Vegetation Response to Precipitation Anomalies under Different Climatic and Biogeographical Conditions in China. Sci. Rep. 10, 830. doi:10.1038/s41598-020-57910-1
Degenhardt, F., Seifert, S., and Szymczak, S. (2019). Evaluation of Variable Selection Methods for Random Forests and Omics Data Sets. Brief. Bioinform. 20, 492–503. doi:10.1093/bib/bbx124
Didan, K. (2015). MOD13Q1 MODIS/Terra Vegetation Indices 16-Day L3 Global 250m SIN Grid V006 [Data Set]. Sioux Falls, South Dakota: NASA EOSDIS Land Processes DAAC. [Accessed January 20, 2021].
Diesing, M. (2020). Deep-sea Sediments of the Global Ocean. Geosciences – Mar. Geology. doi:10.5194/essd-2020-22
Dingaan, M. N. V., and du Preez, P. J. (2013). Grassland Communities of Urban Open Spaces in Bloemfontein, Free State, South Africa. Koedoe 55, 01–08. doi:10.4102/koedoe.v55i1.1075
Egeru, A., Wasonga, O., Mburu, J., Yazan, E., Majaliwa, M. G. J., MacOpiyo, L., et al. (2015). Drivers of Forage Availability: An Integration of Remote Sensing and Traditional Ecological Knowledge in Karamoja Sub-region, Uganda. Pastoralism 5, 19. doi:10.1186/s13570-015-0037-6
Eisfelder, C., Kuenzer, C., and Dech, S. (2012). Derivation of Biomass Information for Semi-arid Areas Using Remote-Sensing Data. Int. J. Remote Sensing 33, 2937–2984. doi:10.1080/01431161.2011.620034
Eitel, J. U. H., Long, D. S., Gessler, P. E., Hunt, E. R., and Brown, D. J. (2009). Sensitivity of Ground-Based Remote Sensing Estimates of Wheat Chlorophyll Content to Variation in Soil Reflectance. Soil Sci. Soc. Am. J. 73, 1715–1723. doi:10.2136/sssaj2008.0288
Elvidge, C. D., and Chen, Z. (1995). Comparison of Broad-Band and Narrow-Band Red and Near-Infrared Vegetation Indices. Remote Sensing Environ. 54, 38–48. doi:10.1016/0034-4257(95)00132-K
ESA (2020a). Data of the ESA Sentinel-2 Sensor. Available at: https://earth.esa.int/web/guest/missions/esa-operational-eo-missions/sentinel-2 (Accessed January 20, 2021).
ESA (2020b). Sen2Cor Atmospheric Correction Software. Available at: http://step.esa.int/main/third-party-plugins-2/sen2cor/(accessed [Accessed January 20, 2021).
Fauvel, M., Lopes, M., Dubo, T., Rivers-Moore, J., Frison, P.-L., Gross, N., et al. (2020). Prediction of Plant Diversity in Grasslands Using Sentinel-1 and -2 Satellite Image Time Series. Remote Sensing Environ. 237, 111536. doi:10.1016/j.rse.2019.111536
Fern, R. R., Foxley, E. A., Bruno, A., and Morrison, M. L. (2018). Suitability of NDVI and OSAVI as Estimators of Green Biomass and Coverage in a Semi-arid Rangeland. Ecol. Indicators 94, 16–21. doi:10.1016/j.ecolind.2018.06.029
GADM (2018). Administrative Areas of All Countries. Available at: https://gadm.org/license.html (Accessed February 16, 2021).
Gholami Baghi, N., and Oldeland, J. (2019). Do soil-adjusted or Standard Vegetation Indices Better Predict above Ground Biomass of Semi-arid, Saline Rangelands in North-East Iran? Int. J. Remote Sensing 40, 8223–8235. doi:10.1080/01431161.2019.1606958
Grabska, E., Frantz, D., and Ostapowicz, K. (2020). Evaluation of Machine Learning Algorithms for Forest Stand Species Mapping Using Sentinel-2 Imagery and Environmental Data in the Polish Carpathians. Remote Sensing Environ. 251, 112103. doi:10.1016/j.rse.2020.112103
Guerini Filho, M., Kuplich, T. M., and Quadros, F. L. F. D. (2020). Estimating Natural Grassland Biomass by Vegetation Indices Using Sentinel 2 Remote Sensing Data. Int. J. Remote Sensing 41, 2861–2876. doi:10.1080/01431161.2019.1697004
Hall, D. K., and Riggs, G. A. (2016). MOD10A1 MODIS/Terra Snow Cover Daily L3 Global 500m SIN Grid, Version 6. Boulder, Colorado: NASA National Snow and Ice Data Center Distributed Active Archive Center (Accessed January 20, 2021).
Hewins, D. B., Lyseng, M. P., Schoderbek, D. F., Alexander, M., Willms, W. D., Carlyle, C. N., et al. (2018). Grazing and Climate Effects on Soil Organic Carbon Concentration and Particle-Size Association in Northern Grasslands. Sci. Rep. 8, 1336. doi:10.1038/s41598-018-19785-1
Hu, Y., and Hu, Y. (2019). Land Cover Changes and Their Driving Mechanisms in Central Asia from 2001 to 2017 Supported by Google Earth Engine. Remote Sensing 11, 554. doi:10.3390/rs11050554
Huete, A. R. (1988). A Soil-Adjusted Vegetation index (SAVI). Remote Sensing Environ. 25, 295–309. doi:10.1016/0034-4257(88)90106-X
Hughes, A. C. (2019). Understanding and Minimizing Environmental Impacts of the Belt and Road Initiative. Conservation Biol. 33, 883–894. doi:10.1111/cobi.13317
James, G., Witten, D., Hastie, T., and Tibshirani, R. (2013). An Introduction to Statistical Learning. New York, NY: Springer New York. Available at: http://link.springer.com/10.1007/978-1-4614-7138-7 (Accessed July 30, 2015).
J. M. Suttie, S. G. Reynolds, and C. Batello (Editors) (2005). Grasslands of the World (Rome, Italy: Food and Agriculture Organization of the United Nations).
Kraudzun, T., Vanselow, K. A., and Samimi, C. (2014). Realities and Myths of the Teresken Syndrome - an Evaluation of the Exploitation of dwarf Shrub Resources in the Eastern Pamirs of Tajikistan. J. Environ. Manage. 132, 49–59. doi:10.1016/j.jenvman.2013.10.019
Kursa, M. B., and Rudnicki, W. R. (2010). Feature Selection with theBorutaPackage. J. Stat. Soft. 36. doi:10.18637/jss.v036.i11
Lapini, A., Pettinato, S., Santi, E., Paloscia, S., Fontanelli, G., and Garzelli, A. (2020). Comparison of Machine Learning Methods Applied to SAR Images for Forest Classification in Mediterranean Areas. Remote Sensing 12, 369. doi:10.3390/rs12030369
Leadley, P., Proença, V., Fernández-Manjarrés, J., Pereira, H. M., Alkemade, R., Biggs, R., et al. (2014). Interacting Regional-Scale Regime Shifts for Biodiversity and Ecosystem Services. BioScience 64, 665–679. doi:10.1093/biosci/biu093
Lechner, A. M., Chan, F. K. S., and Campos-Arceiz, A. (2018). Biodiversity Conservation Should Be a Core Value of China's Belt and Road Initiative. Nat. Ecol. Evol. 2, 408–409. doi:10.1038/s41559-017-0452-8
Li, L., Zhang, Y., Wu, J., Li, S., Zhang, B., Zu, J., et al. (2019). Increasing Sensitivity of alpine Grasslands to Climate Variability along an Elevational Gradient on the Qinghai-Tibet Plateau. Sci. Total Environ. 678, 21–29. doi:10.1016/j.scitotenv.2019.04.399
Li, W., Dong, R., Fu, H., Wang, J., Yu, L., and Gong, P. (2020). Integrating Google Earth Imagery with Landsat Data to Improve 30-m Resolution Land Cover Mapping. Remote Sensing Environ. 237, 111563. doi:10.1016/j.rse.2019.111563
Li, X.-Y., Zhang, S.-Y., Peng, H.-Y., Hu, X., and Ma, Y.-J. (2013). Soil Water and Temperature Dynamics in Shrub-Encroached Grasslands and Climatic Implications: Results from Inner Mongolia Steppe Ecosystem of north China. Agric. For. Meteorology 171-172 (172), 20–30. doi:10.1016/j.agrformet.2012.11.001
Li, X., Chen, G., Liu, J., Chen, W., Cheng, X., and Liao, Y. (2017). Effects of RapidEye Imagery's Red-Edge Band and Vegetation Indices on Land Cover Classification in an Arid Region. Chin. Geogr. Sci. 27, 827–835. doi:10.1007/s11769-017-0894-6
Li, X., Gao, Z., Bai, L., and Huang, Y. (2012). “Potential of High Resolution RapidEye Data for Sparse Vegetation Fraction Mapping in Arid Regions,” in Geoscience and Remote Sensing Symposium (IGARSS), 2012 IEEE International (IEEE). Available at: http://ieeexplore.ieee.org/xpls/abs_all.jsp?arnumber=6351548 (Accessed March 27, 2014).
Li, Z., and Guo, X. (2018). Non-photosynthetic Vegetation Biomass Estimation in Semiarid Canadian Mixed Grasslands Using Ground Hyperspectral Data, Landsat 8 OLI, and Sentinel-2 Images. Int. J. Remote Sensing 39, 6893–6913. doi:10.1080/01431161.2018.1468105
Lin, S., Li, J., Liu, Q., Li, L., Zhao, J., and Yu, W. (2019). Evaluating the Effectiveness of Using Vegetation Indices Based on Red-Edge Reflectance from Sentinel-2 to Estimate Gross Primary Productivity. Remote Sensing 11, 1303. doi:10.3390/rs11111303
Lyons, M. B., Keith, D. A., Phinn, S. R., Mason, T. J., and Elith, J. (2018). A Comparison of Resampling Methods for Remote Sensing Classification and Accuracy Assessment. Remote Sensing Environ. 208, 145–153. doi:10.1016/j.rse.2018.02.026
Mayr, M. J., Vanselow, K. A., and Samimi, C. (2018). Fire Regimes at the Arid Fringe: A 16-year Remote Sensing Perspective (2000-2016) on the Controls of Fire Activity in Namibia from Spatial Predictive Models. Ecol. Indicators 91, 324–337. doi:10.1016/j.ecolind.2018.04.022
Mętrak, M., Chachulski, Ł., Navruzshoev, D., Pawlikowski, P., Rojan, E., Sulwiński, M., et al. (2017). Nature's Patchwork: How Water Sources and Soil Salinity Determine the Distribution and Structure of Halophytic Plant Communities in Arid Environments of the Eastern Pamir. PLoS ONE 12, e0174496. doi:10.1371/journal.pone.0174496
Metrak, M., Sulwinski, M., Chachulski, L., Wilk, M., and Suska-Malawska, M. (2015). “Creeping Environmental Problems in the Pamir Mountains: Landscape Conditions, Climate Change, Wise Use and Threats,” in Climate Change Impacts on High-Altitude Ecosystems. Editors M. Öztürk, K. R. Hakeem, I. Faridah-Hanum, and R. Efe (Cham: Springer International Publishing), 665–694. doi:10.1007/978-3-319-12859-7_28
Meyer, H., Reudenbach, C., Wöllauer, S., and Nauss, T. (2019). Importance of Spatial Predictor Variable Selection in Machine Learning Applications - Moving from Data Reproduction to Spatial Prediction. Ecol. Model. 411, 108815. doi:10.1016/j.ecolmodel.2019.108815
Mirzabaev, A., Ahmed, M., Werner, J., Pender, J., and Louhaichi, M. (2016). Rangelands of Central Asia: Challenges and Opportunities. J. Arid Land 8, 16. doi:10.1007/s40333-015-0057-5
Mueller-Dombois, D., and Ellenberg, H. (1974). Aims and Methods of Vegetation Ecology. New York: Wiley.
Nasa, J. P. L. (2013). “NASA Shuttle Radar Topography Mission Global 1 Arc Second Data Set,” in NASA EOSDIS Land Processes DAAC. doi:10.5067/MEaSUREs/SRTM/
Oldeland, J., Dorigo, W., Wesuls, D., and Jürgens, N. (2010). Mapping Bush Encroaching Species by Seasonal Differences in Hyperspectral Imagery. Remote Sensing 2, 1416–1438. doi:10.3390/rs2061416
Oyana, T. J., Johnson, S. J., and Wang, G. (2014). Landscape Metrics and Change Analysis of a National Wildlife Refuge at Different Spatial Resolutions. Int. J. Remote Sensing 35, 3109–3134. doi:10.1080/01431161.2014.903443
Paruelo, J. M., Lauenroth, W. K., Burke, I. C., and Sala, O. E. (1999). Grassland Precipitation-Use Efficiency Varies across a Resource Gradient. Ecosystems 2, 64–68. doi:10.1007/s100219900058
Peng, S., Piao, S., Ciais, P., Fang, J., and Wang, X. (2010). Change in winter Snow Depth and its Impacts on Vegetation in China. Glob. Change Biol. doi:10.1111/j.1365-2486.2010.02210.x
Phan, T. N., Kuch, V., and Lehnert, L. W. (2020). Land Cover Classification Using Google Earth Engine and Random Forest Classifier-The Role of Image Composition. Remote Sensing 12, 2411. doi:10.3390/rs12152411
Piazzi, G., Tanis, C., Kuter, S., Simsek, B., Puca, S., Toniazzo, A., et al. (2019). Cross-Country Assessment of H-SAF Snow Products by Sentinel-2 Imagery Validated against In-Situ Observations and Webcam Photography. Geosciences 9, 129. doi:10.3390/geosciences9030129
Pohl, E., Knoche, M., Gloaguen, R., Andermann, C., and Krause, P. (2015). Sensitivity Analysis and Implications for Surface Processes from a Hydrological Modelling Approach in the Gunt Catchment, High Pamir Mountains. Earth Surf. Dynam. 3, 333–362. doi:10.5194/esurf-3-333-2015
Poitras, T. B., Villarreal, M. L., Waller, E. K., Nauman, T. W., Miller, M. E., and Duniway, M. C. (2018). Identifying Optimal Remotely-Sensed Variables for Ecosystem Monitoring in Colorado Plateau Drylands. J. Arid Environments 153, 76–87. doi:10.1016/j.jaridenv.2017.12.008
Prince, S. D. (2019). Challenges for Remote Sensing of the Sustainable Development Goal SDG 15.3.1 Productivity Indicator. Remote Sensing Environ. 234, 111428. doi:10.1016/j.rse.2019.111428
Qi, J., Chehbouni, A., Huete, A. R., Kerr, Y. H., and Sorooshian, S. (1994). A Modified Soil Adjusted Vegetation index. Remote sensing Environ. 48, 119–126. doi:10.1016/0034-4257(94)90134-1
Qiu, B., Li, W., Wang, X., Shang, L., Song, C., Guo, W., et al. (2019). Satellite-observed Solar-Induced Chlorophyll Fluorescence Reveals Higher Sensitivity of alpine Ecosystems to Snow Cover on the Tibetan Plateau. Agric. For. Meteorology 271, 126–134. doi:10.1016/j.agrformet.2019.02.045
Raab, C., Riesch, F., Tonn, B., Barrett, B., Meißner, M., Balkenhol, N., et al. (2020). Target‐oriented Habitat and Wildlife Management: Estimating Forage Quantity and Quality of Semi‐natural Grasslands with Sentinel‐1 and Sentinel‐2 Data. Remote Sens Ecol. Conserv 6, 381–398. doi:10.1002/rse2.149
Ramoelo, A., Skidmore, A. K., Cho, M. A., Schlerf, M., Mathieu, R., and Heitkönig, I. M. A. (2012). Regional Estimation of savanna Grass Nitrogen Using the Red-Edge Band of the Spaceborne RapidEye Sensor. Int. J. Appl. Earth Observation Geoinformation 19, 151–162. doi:10.1016/j.jag.2012.05.009
Ren, H., Zhang, B., and Guo, X. (2018). Estimation of Litter Mass in Nongrowing Seasons in Arid Grasslands Using MODIS Satellite Data. Eur. J. Remote Sensing 51, 222–230. doi:10.1080/22797254.2017.1418186
Ren, H., Zhou, G., Zhang, F., and Zhang, X. (2012). Evaluating Cellulose Absorption index (CAI) for Non-photosynthetic Biomass Estimation in the Desert Steppe of Inner Mongolia. Chin. Sci. Bull. 57, 1716–1722. doi:10.1007/s11434-012-5016-3
Ren, H., Zhou, G., and Zhang, X. (2011). Estimation of green Aboveground Biomass of Desert Steppe in Inner Mongolia Based on Red-Edge Reflectance Curve Area Method. Biosyst. Eng. 109, 385–395. doi:10.1016/j.biosystemseng.2011.05.004
Roleček, J., Chytrỳ, M., Hájek, M., Lvončík, S., and Tichỳ, L. (2007). Sampling Design in Large-Scale Vegetation Studies: Do Not Sacrifice Ecological Thinking to Statistical Purism. Folia Geobotanica 42, 199–208.
Rouse, J. W. (1973). Monitoring the vernal Advancement and Retrogradation (green Wave Effect) of Natural Vegetation. Greenbelt, MD, USA: NASA/GSFCT Type II Report.
Ruß, G., and Brenning, A. (2010). “Spatial Variable Importance Assessment for Yield Prediction in Precision Agriculture,” in Advances in Intelligent Data Analysis IX. Editors P. R. Cohen, N. M. Adams, and M. R. Berthold (Springer Berlin Heidelberg, 184–195.doi:10.1007/978-3-642-13062-5_18
Salomonson, V. V., and Appel, I. (2006). Development of the Aqua MODIS NDSI Fractional Snow Cover Algorithm and Validation Results. IEEE Trans. Geosci. Remote Sensing 44, 1747–1756. doi:10.1109/TGRS.2006.876029
Schmitt, M., Hughes, L. H., Qiu, C., and Zhu, X. X. (2019). AGGREGATING CLOUD-FREE SENTINEL-2 IMAGES WITH GOOGLE EARTH ENGINE. ISPRS Ann. Photogramm. Remote Sens. Spat. Inf. Sci. IV-2/W7, 145–152. doi:10.5194/isprs-annals-IV-2-W7-145-2019
Schumacher, P., Mislimshoeva, B., Brenning, A., Zandler, H., Brandt, M., Samimi, C., et al. (2016). Do Red Edge and Texture Attributes from High-Resolution Satellite Data Improve Wood Volume Estimation in a Semi-arid Mountainous Region? Remote Sensing 8, 540. doi:10.3390/rs8070540
Sibanda, M., Mutanga, O., and Rouget, M. (2017). Testing the Capabilities of the New WorldView-3 Space-Borne Sensor's Red-Edge Spectral Band in Discriminating and Mapping Complex Grassland Management Treatments. Int. J. Remote Sensing 38, 1–22. doi:10.1080/01431161.2016.1259678
Smallwood, P. D., and Shank, C. C. (2019). “From Buffer Zone to National Park: Afghanistan's Wakhan National Park,” in Collateral Values Landscape Series. Editors T. R. Lookingbill, and P. D. Smallwood (Cham: Springer International Publishing), 213–233. doi:10.1007/978-3-030-18991-4_10
Smith, T., and Bookhagen, B. (2020). Assessing Multi-Temporal Snow-Volume Trends in High Mountain Asia from 1987 to 2016 Using High-Resolution Passive Microwave Data. Front. Earth Sci. 8, 559175. doi:10.3389/feart.2020.559175
Smith, W. K., Dannenberg, M. P., Yan, D., Herrmann, S., Barnes, M. L., Barron-Gafford, G. A., et al. (2019). Remote Sensing of Dryland Ecosystem Structure and Function: Progress, Challenges, and Opportunities. Remote Sensing Environ. 233, 111401. doi:10.1016/j.rse.2019.111401
Soelberg, J., and Jäger, A. K. (2016). Comparative Ethnobotany of the Wakhi Agropastoralist and the Kyrgyz Nomads of Afghanistan. J. Ethnobiol. Ethnomedicine 12. doi:10.1186/s13002-015-0063-x
Squires, V. R., Dengler, J., Feng, H., and Hua, L. (2018). Grasslands of the World: Diversity, Management and Conservation. 1st ed. Boca Raton: Taylor & Francis.
State Administration for Hydrometeorology of the Republic of Tajikistan, (2013). Climatic Dataset for the Pamir Region Acquired from the Tajik Hydrometeorological Service. Tajikistan: Dushanbe.
Sternberg, M., and Shoshany, M. (2001). Influence of Slope Aspect on Mediterranean Woody Formations: Comparison of a Semiarid and an Arid Site in Israel. Ecol. Res. 16, 335–345. doi:10.1046/j.1440-1703.2001.00393.x
Svinurai, W., Hassen, A., Tesfamariam, E., and Ramoelo, A. (2018). Performance of Ratio-Based, Soil-Adjusted and Atmospherically Corrected Multispectral Vegetation Indices in Predicting Herbaceous Aboveground Biomass in a Colophospermum Mopane Tree-Shrub savanna. Grass Forage Sci. 73, 727–739. doi:10.1111/gfs.12367
Talukdar, S., Singha, P., Mahato, S., ShahfahadPal, S., Pal, S., Liou, Y.-A., et al. (2020). Land-Use Land-Cover Classification by Machine Learning Classifiers for Satellite Observations-A Review. Remote Sensing 12, 1135. doi:10.3390/rs12071135
Thorp, K. R., and Drajat, D. (2021). Deep Machine Learning with Sentinel Satellite Data to Map Paddy rice Production Stages across West Java, Indonesia. Remote Sensing Environ. 265, 112679. doi:10.1016/j.rse.2021.112679
Todd, S. W., and Hoffer, R. M. (1998). Responses of Spectral Indices to Variations in Vegetation Cover and Soil Background. Photogrammetric Eng. Remote Sensing 64, 7
Tran, H., Nguyen, P., Ombadi, M., Hsu, K.-L., Sorooshian, S., and Qing, X. (2019). A Cloud-free MODIS Snow Cover Dataset for the Contiguous United States from 2000 to 2017. Sci. Data 6, 13. doi:10.1038/sdata.2018.300
Tucker, C. J., and Miller, L. D. (1977). Soil Spectra Contributions to Grass Canopy Spectral Reflectance. Photogrammetric Eng. Remote Sensing 43, 6
Unger-Shayesteh, K., Vorogushyn, S., Farinotti, D., Gafurov, A., Duethmann, D., Mandychev, A., et al. (2013). What Do We Know about Past Changes in the Water Cycle of Central Asian Headwaters? A Review. Glob. Planet. Change 110, 4–25. doi:10.1016/j.gloplacha.2013.02.004
Vanselow, K. A. (2011). The High-Mountain Pastures of the Eastern Pamirs (Tajikistan): an Evaluation of the Ecological Basis and the Pasture Potential. Available at: http://d-nb.info/1010705040/(Accessed October 17, 2013).
Vanselow, K. A., Zandler, H., and Samimi, C. (2018). “Methods of Assessing Vegetation Dynamics and Pasture Potentials in High Mountain Regions,” in Novel Methods and Results of Landscape Research in Europe, Central Asia and Siberia (Moscow, Russia: Landscape Monitoring and Modelling (ВНИИ агрохимии, Vol. III, 209–213. doi:10.25680/1490.2018.71.71.003
Vanselow, K., and Samimi, C. (2014). Predictive Mapping of Dwarf Shrub Vegetation in an Arid High Mountain Ecosystem Using Remote Sensing and Random Forests. Remote Sensing 6, 6709–6726. doi:10.3390/rs6076709
Verrelst, J., Malenovský, Z., Van der Tol, C., Camps-Valls, G., Gastellu-Etchegorry, J.-P., Lewis, P., et al. (2019). Quantifying Vegetation Biophysical Variables from Imaging Spectroscopy Data: A Review on Retrieval Methods. Surv. Geophys. 40, 589–629. doi:10.1007/s10712-018-9478-y
Viviroli, D., Dürr, H. H., Messerli, B., Meybeck, M., and Weingartner, R. (2007). Mountains of the World, Water Towers for Humanity: Typology, Mapping, and Global Significance. Water Resour. Res. 43, 13. doi:10.1029/2006WR005653
Wang, H., Han, D., Mu, Y., Jiang, L., Yao, X., Bai, Y., et al. (2019). Landscape-level Vegetation Classification and Fractional Woody and Herbaceous Vegetation Cover Estimation over the Dryland Ecosystems by Unmanned Aerial Vehicle Platform. Agric. For. Meteorology 278, 107665. doi:10.1016/j.agrformet.2019.107665
Wang, K., Zhang, L., Qiu, Y., Ji, L., Tian, F., Wang, C., et al. (2013). Snow Effects on alpine Vegetation in the Qinghai-Tibetan Plateau. Int. J. Digital Earth 8, 58–75. doi:10.1080/17538947.2013.848946
Wang, R., and Gamon, J. A. (2019). Remote Sensing of Terrestrial Plant Biodiversity. Remote Sensing Environ. 231, 111218. doi:10.1016/j.rse.2019.111218
Wang, X., Wu, C., Peng, D., Gonsamo, A., and Liu, Z. (2018). Snow Cover Phenology Affects alpine Vegetation Growth Dynamics on the Tibetan Plateau: Satellite Observed Evidence, Impacts of Different Biomes, and Climate Drivers. Agric. For. Meteorology 256-257 (257), 61–74. doi:10.1016/j.agrformet.2018.03.004
Wu, J., Shen, Z., Shi, P., Zhou, Y., and Zhang, X. (2014). Effects of Grazing Exclusion on Plant Functional Group Diversity of Alpine Grasslands along a Precipitation Gradient on the Northern Tibetan Plateau. Arctic, Antarctic, Alpine Res. 46, 419–429. doi:10.1657/1938-4246-46.2.419
Wu, Z., Lei, S., Bian, Z., Huang, J., and Zhang, Y. (2019). Study of the Desertification index Based on the Albedo-MSAVI Feature Space for Semi-arid Steppe Region. Environ. Earth Sci. 78, 232. doi:10.1007/s12665-019-8111-9
Xiuping, Z., Dunjiang, S., and Shaofeng, C. (2019). Ecological Carrying Capacity of Grasslands and Animal Husbandry Sustainability in Central Asia. J. Resour. Ecol. 10, 598–604. doi:10.5814/j.issn.1674-764x.2019.06.004
Zandler, H., Brenning, A., and Samimi, C. (2015a). Potential of Space-Borne Hyperspectral Data for Biomass Quantification in an Arid Environment: Advantages and Limitations. Remote Sensing 7, 4565–4580. doi:10.3390/rs70404565
Zandler, H., Brenning, A., and Samimi, C. (2015b). Quantifying dwarf Shrub Biomass in an Arid Environment: Comparing Empirical Methods in a High Dimensional Setting. Remote Sensing Environ. 158, 140–155. doi:10.1016/j.rse.2014.11.007
Zandler, H., Haag, I., and Samimi, C. (2019). Evaluation Needs and Temporal Performance Differences of Gridded Precipitation Products in Peripheral Mountain Regions. Sci. Rep. 9, 15118. doi:10.1038/s41598-019-51666-z
Zandler, H., Senftl, T., and Vanselow, K. A. (2020). Reanalysis Datasets Outperform Other Gridded Climate Products in Vegetation Change Analysis in Peripheral Conservation Areas of Central Asia. Sci. Rep. 10, 22446. doi:10.1038/s41598-020-79480-y
Zarco-Tejada, P. J., Hornero, A., Hernández-Clemente, R., and Beck, P. S. A. (2018). Understanding the Temporal Dimension of the Red-Edge Spectral Region for Forest Decline Detection Using High-Resolution Hyperspectral and Sentinel-2a Imagery. ISPRS J. Photogrammetry Remote Sensing 137, 134–148. doi:10.1016/j.isprsjprs.2018.01.017
Zhang, B., Zhao, L., and Zhang, X. (2020a). Three-dimensional Convolutional Neural Network Model for Tree Species Classification Using Airborne Hyperspectral Images. Remote Sensing Environ. 247, 111938. doi:10.1016/j.rse.2020.111938
Zhang, J., Okin, G. S., and Zhou, B. (2019). Assimilating Optical Satellite Remote Sensing Images and Field Data to Predict Surface Indicators in the Western U.S.: Assessing Error in Satellite Predictions Based on Large Geographical Datasets with the Use of Machine Learning. Remote Sensing Environ. 233, 111382. doi:10.1016/j.rse.2019.111382
Zhang, R., Wang, J., and Niu, S. (2021). Toward a Sustainable Grazing Management Based on Biodiversity and Ecosystem Multifunctionality in Drylands. Curr. Opin. Environ. Sustainability 48, 36–43. doi:10.1016/j.cosust.2020.09.005
Zhang, X., Han, L., Han, L., and Zhu, L. (2020b). How Well Do Deep Learning-Based Methods for Land Cover Classification and Object Detection Perform on High Resolution Remote Sensing Imagery? Remote Sensing 12, 417. doi:10.3390/rs12030417
Keywords: central asia, vegetation monitoring, dryland remote sensing, grasslands, snow, vegetation modeling, rangeland conservation
Citation: Zandler H, Faryabi SP and Ostrowski S (2022) Contributions to Satellite-Based Land Cover Classification, Vegetation Quantification and Grassland Monitoring in Central Asian Highlands Using Sentinel-2 and MODIS Data. Front. Environ. Sci. 10:684589. doi: 10.3389/fenvs.2022.684589
Received: 23 March 2021; Accepted: 11 February 2022;
Published: 03 March 2022.
Edited by:
Jianshuang Wu, Institute of Environment and Sustainable Development in Agriculture (CAS), ChinaReviewed by:
D. Amarsaikhan, Mongolian Academy of Sciences (MAS), MongoliaYuke Zhou, Institute of Geographic Sciences and Natural Resources Research (CAS), China
Xun Zhang, Beijing Technology and Business University, China
Copyright © 2022 Zandler, Faryabi and Ostrowski. This is an open-access article distributed under the terms of the Creative Commons Attribution License (CC BY). The use, distribution or reproduction in other forums is permitted, provided the original author(s) and the copyright owner(s) are credited and that the original publication in this journal is cited, in accordance with accepted academic practice. No use, distribution or reproduction is permitted which does not comply with these terms.
*Correspondence: Harald Zandler, harald.zandler@uni-bayreuth.de