Pressure Calibration of Large-Volume Press: A Case Study of Hinged 6-8 Type Large-Volume High-Pressure Apparatus
 Dongsheng Ren1
  Heping Li2*
- 1Institute of Geology, China Earthquake Administration, Beijing, China
- 2Institute of Geochemistry, Chinese Academy of Sciences, Guiyang, China
In this study, methods for the pressure calibration of 6–8 static high-pressure apparatus were investigated. The relationship between the pressure of DS 6 × 1,400 t pressing oil and the chamber pressure was calibrated using water, ZnTe, ZnS, and GaAs at room temperature. Also, the relationship between the pressure of the DS 6 × 1,400 t pressing oil and the chamber pressure was calibrated by the phase transition experiments using KCl, LiCl, KCl + LiCl, and quartz-coesite at high temperatures. We found a linear relationship between the chamber pressure and the oil pressure at room temperature. However, when the temperature and pressure increased to certain values, the chamber pressure and the oil pressure deviated from the linear relationship.
Introduction
High-pressure geoscience is the study area on the physicochemical properties of matters at high pressure including the mechanical, thermal, optical, electrical, and magnetic properties of matters as well as the microstructure, equation of state, and phase transition of matters. It also provides theoretical and experimental bases for the discovery of new phenomena, new laws, and the synthesis of new materials at high pressure. The production of static high temperature and high pressure depends on various high-pressure apparatus such as anvil devices including the piston cylinder and diamond anvil cell. Multi-anvil instruments are comprised of the quaternary-plane anvil and senary-plane anvil assemblies. Nevertheless, among various large-volume, multi-anvil static high-pressure assemblies, due to the wide range of temperatures and pressures that can be obtained and the ease of the combination with various in-situ measurement techniques, 6–8 high-pressure assemblies are becoming increasingly important in the fields of Earth and planetary physics, mineralogy, and petrology. The pressure and temperature of 6–8 large-volume high-pressure assemblies can reach up to several tens GPa and 2,500°C, respectively. However, they use solid as a pressure-transfer medium whose internal friction is large. As a result, the pressure calibration of their chamber is required (Baumann, et al., 2015; Klier, et al., 2015; Richter, et al., 2016).
Currently, methods for large-volume pressure calibration can be divided into pressure calibrations at room temperature and high temperatures. The main methods of the pressure calibration at room temperature are the phase transition, the X-ray cell parameter measurement, and the fluorescence manometry. The principle of the phase transition method is to establish the relationship between the chamber pressure and the load by determining the resistance mutation or the metallization pressure transition point of known metals or semiconductors such as Bi, Tl, Cs, Ba, Sn, ZnSe, ZnS, and GaAs. The X-ray cell parameter measurements are used to determine the variation of cell parameters of matters with a known equation of state at high pressure to calibrate the cavity pressure. The fluorescence manometry uses the fluorescence spectral lines of R1 = 694.2 nm and R2 = 692.9 nm of ruby at room temperature and ambient pressure. As the pressure increases, the spectral lines move in the direction of longer wavelengths. The linear relationship between the R1 spectral wavelength and the pressure is dp/dλ = 2.740 ± 0.016 GPa/nm for the chamber pressure calibration (Hülsmans, et al., 2015; Morales, et al., 2015; Wang, et al., 2015; Klemm, et al., 2020; Kosari, et al., 2020).
Pressure measurement at high temperatures is more complex than that at room temperature. The physical properties and the state changes of matters are not only controlled by the pressure but also affected by the temperature. So it is necessary to obtain the relationship between the temperature and the pressure when the phase transition, fusion, or decomposition reaction of the calibrated matter occurs. This relationship can be used as the basis for the pressure calibration. In the measurement process, the temperature at which the material or physical state of the calibrated matter changes is measured at several pressures of the force load. The corresponding chamber pressure is calculated by the relational equation to obtain the relationship between the force load pressure and the chamber pressure. Thermocouples are generally used for temperature measurement in large-volume press. In the case of happening of phase transition, fusion, or other reactions in the matter, the thermoelectric potential changes abruptly. So thermocouples can be used to determine the temperature at which the phase transition, fusion, or decomposition occurs, and the products can be analyzed to verify that this reaction has occurred. Commonly used pressure calibration methods at high temperatures include the phase transition method and the high-pressure fusion curve method (Kawazoe, et al., 2008; Farla, et al., 2015; Farla, et al., 2017). When the phase transition of the matter occurs, the relationship between the temperature and the pressure is called the phase transition equation. The phase transition reactions used for the pressure calibration at high temperatures include quartz-coesite, coesite-stishovite,
In this study, the pressure calibration methods commonly used in existing large-volume multi-anvil static high-pressure assemblies were employed to conduct systematic pressure calibration experiments for the hinged 6 × 1,400 t 6-8 high-pressure assembly using various methods. The relationship between the chamber pressure and the oil pressure of this large-volume assembly was established for a specific sample size at different temperatures (Room-T∼1,500°C).
Experimental
Instrument
The DS 6 × 1,400 t large-volume assembly was comprised of the pressing body, the oil tank system, and the control system. The pressing body extruded the sample assembly through the pressing anvil. The oil tank system provided the force source to push the pressing anvil. The control system set the temperature and pressure program for the experiment. The six hydraulic cylinders were interconnected by a hinge and all pistons were controlled by the same oil pump. The first-stage anvil was made of tungsten carbide with a Co content of 8 wt% and the edge length was 43.5 mm. The multimeter model used to measure the variation of the resistance of the sample was Agilen-34401A.
Method
The pressure calibration of the first-stage anvil at room temperature was conducted based on the water-ice phase transition where water was sealed in a copper tube as the starting material. The pressure calibration of the first-stage anvil at high temperatures was conducted using KCl, LiCl, and KCl + LiCl (molar mass ratio = 1: 1). The high-purity starting material was purchased from Aladdin, and the starting material with a particle size of 200 μm was pressed into a cylinder with a diameter of 4 mm and a height of 8 mm by a powder press. The second-stage anvil was made of the WC alloy with a single cubic side length of 25.4 mm and a truncated triangular side length of 5 mm. The octahedral pressure transfer medium was made of MgO +5% Cr2O3 with a side length of 10 mm. The pressure calibration of the second-stage anvil at room temperature was performed by using ZnTe with the I-II conversion pressure of 5 GPa, the II-III conversion pressure of 8.9–9.5 GPa, the ZnTe semiconductor/metal conversion pressure of 11.5–13 GPa, the ZnS semiconductor/metal conversion pressure of 15.6 GPa, and the GaAs semiconductor/metal conversion pressure of 18.8 GPa for the chamber pressure.
The phase transition material used for the pressure calibration at high temperatures was a quartz-coesite with a quartz particle size of 150 um. This was pressed into a sample with a diameter of 2 mm and a height of 2 mm by a press. The samples were assembled as shown in Figure 1.
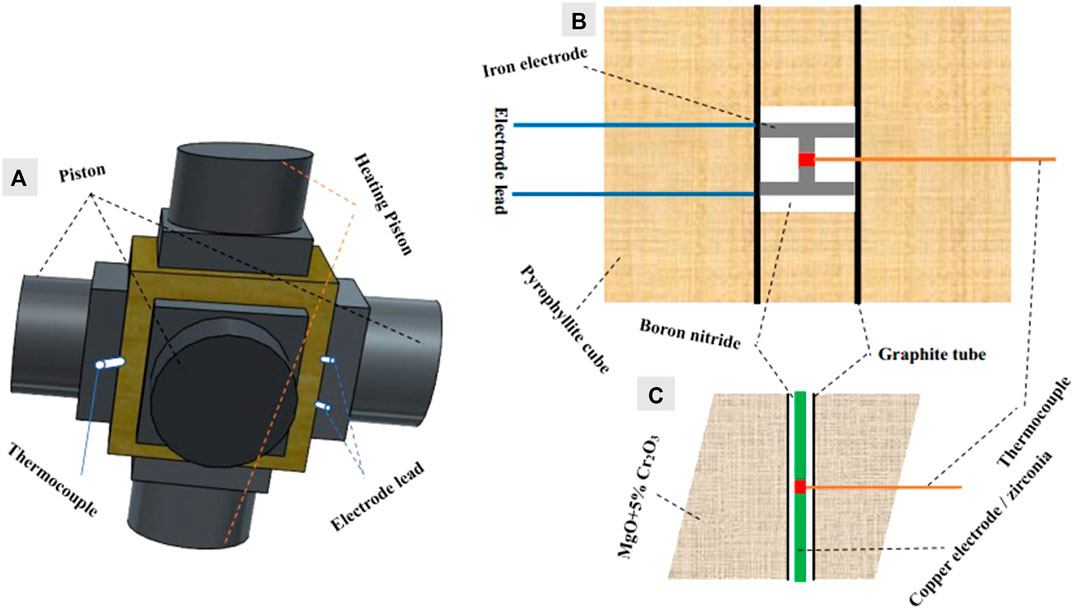
FIGURE 1. Sample assembly drawing; (A) drawing of the large-volume pressing assembly, (B) drawing of the first-stage anvil pressure calibration assembly, and (C) drawing of the second-stage anvil pressure calibration assembly.
The pressure calibration method for the first-stage and second-stage anvils at room temperature was to increase the oil pressure of the large-volume assembly at a rate of 10
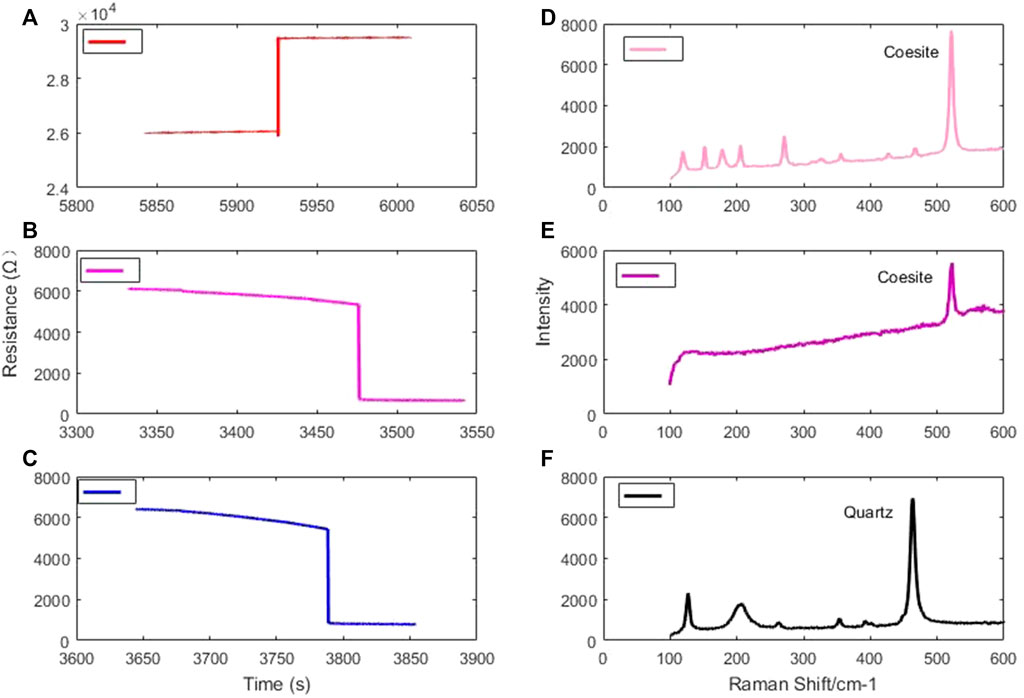
FIGURE 2. (A) Time trend of water resistance, (B) Time trend of ZnS resistance, (C) Time trend of KCl resistance at an oil pressure of 10 MPa, (D) Raman spectrum of the experimental product of the phase transition of quartz at 1,000°C, (E) Raman spectrum of the experimental product of the phase transition of quartz at 1,500°C, and (F) Raman spectrum of quartz before the phase transition.
For instance, the KCl fusion at an oil pressure of 10 MPa in the first-stage anvil is shown in Figure 2C. The pressure calibration for the second-stage anvil at high temperatures was achieved using the phase transition of the quartz-coesite. At 1,000°C, the coesite was found in the product when the oil pressure reached 3 MPa. At 1,500°C, the coesite was found in the product when the oil pressure reached 5 MPa. The Raman spectra of the product after the quartz phase transition are shown in Figures 2D,E, and that of the starting material is shown in Figure 2F.
Results and Discussion
Figures 3, 4 illustrate the experimental results of the pressure calibration for the first-stage and second-stage anvils at different temperatures. The experimental error was small and the goodness of fit of the fitted curves was larger than 0.95. As shown in these figures, the chamber pressure and the oil pressure showed an ideal linear relationship at room temperature for both first-stage and second-stage anvils. In the pressure calibration at high temperatures, when the oil pressure and temperature were higher than certain values, the chamber pressure deviated from the linear relationship with the oil pressure. The higher the temperature was, the greater the deviation from the linear relationship was. The main reasons were as follows. Firstly, with an increase in the temperature, the inner pressure transfer medium was sintered and hardened so that its pressure transfer performance decreased. Secondly, with an increase in the oil pressure and temperature, the mobility of the outer pressure transfer medium was enhanced. This resulted in a large amount of extrusion of the outer pressure transfer medium which lost the anvil surface pressure in the process of transferring to the sample chamber. In addition, the temperature and pressure were too high and the WC anvil approached the yield strength.
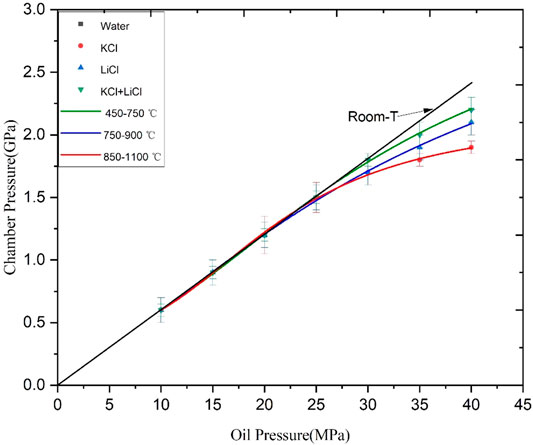
FIGURE 3. Pressure calibration for the first-stage anvil of the DS 6 × 1400 t 6–8 large volume press assembly.
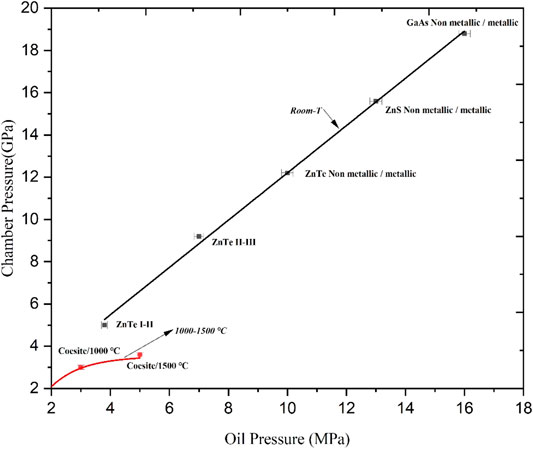
FIGURE 4. Pressure calibration for the second-stage anvil of the DS 6 × 1400 t 6–8 large volume press assembly.
Conclusions and Limitations
In this study, the pressure calibration methods for a 6–8 type large-volume pressing assembly at room temperature and high temperatures were investigated. The relationship between the pressure of the pressing oil and the chamber pressure of the DS 6 × 1,400 t assembly was calibrated by conducting the phase transition experiments using water, ZnTe, ZnS, and GaAs at room temperature and using KCl, LiCl, KCl + LiCl, and quartz-coesite at high temperatures. These pressure calibration results provided the basis for future experiments and the feasibility of these calibration methods has been verified through these experiments. However, no other methods such as the coesite-stishovite phase transition method have been applied to obtain more extensive and reliable pressure calibration results for the second-stage anvil at high temperatures (Wang et al., 2015).
Data Availability Statement
The original contributions presented in the study are included in the article/Supplementary Material, further inquiries can be directed to the corresponding author.
Author Contributions
All authors listed have made a substantial, direct, and intellectual contribution to the work and approved it for publication.
Funding
This project is supported by the National Natural Science Foundation of China with Grant No. 42104176.
Conflict of Interest
The authors declare that the research was conducted in the absence of any commercial or financial relationships that could be construed as a potential conflict of interest.
Publisher’s Note
All claims expressed in this article are solely those of the authors and do not necessarily represent those of their affiliated organizations, or those of the publisher, the editors and the reviewers. Any product that may be evaluated in this article, or claim that may be made by its manufacturer, is not guaranteed or endorsed by the publisher.
References
Baumann, D., Niklaus, R., and Schnick, W. (2015). Cheminform Abstract: A High‐pressure Polymorph of Phosphorus Oxonitride with the Coesite Structure. Cheminform 46 (24), 369–382. doi:10.1002/chin.201524002
Chen, S., Guo, X., Zhou, C., and Jin, Z. (2016). Negative Pressure Effect on the Electrical Conductivity of San Carlos Olivine and its Implication to the Electrical Structure in the Upper Mantle. Sci. China Earth Sci. 59 (10), 2078–2088. doi:10.1007/s11430-015-0216-y
Farla, R., Amulele, G., Girard, J., Miyajima, N., and Karato, S.-i. (2017). Erratum to: High-Pressure and High-Temperature Deformation Experiments on Polycrystalline Wadsleyite Using the Rotational Drickamer Apparatus. Phys. Chem. Minerals 44, 541–558. doi:10.1007/s00269-017-0872-7
Farla, R., Amulele, G., Girard, J., Miyajima, N., and Karato, S.-i. (2015). High-pressure and High-Temperature Deformation Experiments on Polycrystalline Wadsleyite Using the Rotational Drickamer Apparatus. Phys. Chem. Minerals 42, 576–581. doi:10.1007/s00269-015-0742-0
Hülsmans, A., Schmücker, M., Mader, W., and Schneider, H. (2015). The Transformation of Andalusite to Mullite and Silica: Part I. Transformation Mechanism in [001] Direction. Am. Mineral. 85 (7), 980–986. doi:10.2138/am-2000-0712
Kawazoe, T., Karato, S., Otsuka, K., Jing, Z., and Mookherjee, M. (2008). Shear Deformation of Dry Polycrystalline Olivine under Deep Upper Mantle Conditions Using a Rotational Drickamer Apparatus (RDA). Phys. Earth Planet. Interiors 174 (1-4), 128–137. doi:10.1016/j.pepi.2008.06.027
Klemm, D. H. W., Prieto, D. M. J., Xiong, F., Hassine, G. B., Heyde, M., Menzel, D., et al. (2020). A Silica Bilayer Supported on Ru(0001): Following the Crystalline‐to Vitreous Transformation in Real Time with Spectro‐microscopy. Angew. Chem. 132, 10674–10680. doi:10.1002/ange.202002514
Klier, K., Spirko, J. A., and Landskron, K. M. (2015). Optical Absorption Anisotropy of High-Density, wide-gap, High-Hardness SiO2 Polymorphs Seifertite, Stishovite, and Coesite. Am. Mineral. 100 (1), 120–129. doi:10.2138/am-2015-4890
Kosari, M., Borgna, A., and Zeng, H. C. (2020). Transformation of Stöber Silica Spheres to Hollow Nanocatalysts. Chemnanomat 6 (6), 889–906. doi:10.1002/cnma.202000147
Lebron, I., Herrero, J., and Robinson, D. (2009). Determination of Gypsum Content in Dryland Soils Exploiting the Gypsum–bassanite Phase Change. Soil Sci. Soc. America J. 73 (2), 136–139. doi:10.2136/sssaj2008.0001
Morales, J. M., Moragues, A., El Haskouri, J., Guillem, C., Latorre, J., Murcia-Mascarós, S., et al. (2015). Low-Cost Synthesis of Bimodal Mesoporous Silica-Based Materials by Pseudomorphic Transformation. Chempluschem 80 (6), 1014–1028. doi:10.1002/cplu.201402383
Richter, B., Stünitz, H., and Heilbronner, R. (2016). Stresses and Pressures at the Quartz‐to‐coesite Phase Transformation in Shear Deformation Experiments. J. Geophys. Res. Solid Earth 121 (11), 8015–8033. doi:10.1002/2016jb013084
Wang, Z, Zhao, Y., and Kohlstedt, D. L. (2010). Dislocation Creep Accommodated by Grain Boundary Sliding in Dunite. J. Earth Sci. 21 (5), 541–554. doi:10.1007/s12583-010-0113-1
Wang, J., Rajendran, A. M., and Dongare, A. M. (2015). Atomic Scale Modeling of Shock Response of Fused Silica and α-quartz. Mineralogical Soc. America 50 (24), 212–227. doi:10.1007/s10853-015-9386-1
Wang, Z., Jin, Z., Mungall, J. E., and Xiao, X. (2019). Transport of Coexisting Ni-Cu Sulfide Liquid and Silicate Melt in Partially Molten Peridotite. Earth Planet. Sci. Lett. 536, 112–118. doi:10.1016/j.epsl.2020.116162
Keywords: pressure calibration, 6–8 large-volume high-pressure apparatus, high temperature and high pressure, phase transition, fusion
Citation: Ren D and Li H (2022) Pressure Calibration of Large-Volume Press: A Case Study of Hinged 6-8 Type Large-Volume High-Pressure Apparatus. Front. Earth Sci. 10:851813. doi: 10.3389/feart.2022.851813
Received: 10 January 2022; Accepted: 17 January 2022;
Published: 18 February 2022.
Edited by:
Lidong Dai, Institute of Geochemistry (CAS), ChinaReviewed by:
Shuo Xue, Guangzhou Institute of Geochemistry (CAS), ChinaZhankun Liu, Central South University, China
Copyright © 2022 Ren and Li. This is an open-access article distributed under the terms of the Creative Commons Attribution License (CC BY). The use, distribution or reproduction in other forums is permitted, provided the original author(s) and the copyright owner(s) are credited and that the original publication in this journal is cited, in accordance with accepted academic practice. No use, distribution or reproduction is permitted which does not comply with these terms.
*Correspondence: Heping Li, liheping@vip.gyig.ac.cn