Developing an Open Database to Support Forensic Investigation of Disasters in South East Asia: FORINSEA v1.0
 Andres Payo1*
  Raushan Arnhardt1
  Angelo Carlo R. Galindo2
  Pham Van Dong3
  Maria Aileen Leah G. Guzman2 Yasmin O. Hatta2 Andrew Bevan1 Jose Claro N. Monje4
- 1British Geological Survey, Nottingham, United Kingdom
- 2Department of Environmental Science, Ateneo de Manila University, Loyola Heights Campus, Manila, Philippines
- 3Vietnam National University, Engineering and Technology, Hanoi, Vietnam
- 4Department of Electronics, Computer and Communications Engineering, Ateneo de Manila University, Loyola Heights Campus, Manila, Philippines
Introduction
Arguably the Sendai Framework for Disaster Risk Reduction 2015–2030 (SFDRR) fail to deal with root causes of disasters (Wisner, 2020) and therefore calls for science to support policy move towards more holistic solutions to disaster risk. In this context, root causes analysis has been described as “a structured investigation that aims to identify the true cause of a problem and the actions necessary to eliminate it” (DKKV, 2012, p. 12). A systematic review of 40 studies of disaster causation concluded that the FORensic INvestigations of disasters (FORIN) provides a broad and adaptable approach for the study of disaster root causes (Fraser et al., 2016). FORIN has been developed by the Integrated Research on Disaster Risk (IRDR) program of International Council for Science (ICSU), International Social Science Council (ISSC) and United Nations International Strategy for Disaster Reduction (UNISDR) (Oliver-Smith et al., 2016). The FORIN approach has been used to investigate the root causes of disasters around the world. For example, to reveal the underlying causes and risk drivers in the Haitian earthquake (Oliver-Smith et al., 2016), to inform the narratives to identify the factors that exacerbated the loss of human life in one of the most devastated local municipalities on the coast by 2011 Great East Japan Earthquake and Tsunami (Nakasu et al., 2017) or to understand the political ecology of the recurrent El Niño-related disasters in Peru (French et al., 2020).
FORIN research focuses on demonstrating with strong evidence that disaster risks are socially constructed. The principal contributing causes of disaster risk should be clearly identified along with ways in which they can be reduced or avoided through in-depth analysis that ties structurally-based root causes into causal chains to the active social drivers of risk that result in the unsafe conditions that place people in harm’s way. There are two clearly differentiated stages in FORIN: “FORIN analysis opts for a separation of basically descriptive, systematizing aspects of explanation from more deep-rooted causal analysis in order to organize thought and research needs as opposed to dictating an order of enquiry as such” (Oliver-Smith et al., 2016, p. 23). The approach provides scope for flexible adaptation and application in different research contexts. This includes its application to complex phenomena such as climate change (Gotangco et al., 2014) and pandemics because the strengthened understanding of these socially constructed risks offers potential to “move to a new and different normal, transforming the way the global geopolitics and economics are constructed” (Alcántara-Ayala et al., 2021, p. 2).
The first FORIN descriptive explanation suggests the immediate relating of patterns of loss, damage and impact to the differentiated impact of hazards on exposed social elements. Vulnerability (and resilience) is a complex social condition often deriving from the workings and interaction of multiple dynamic processes and underlying “deep-rooted causes” (Oliver-Smith et al., 2016). The key areas of investigation to be developed at the descriptive level are: the triggering event(s), exposure of social and environmental elements, the social and economic structure of exposed communities, and institutional and governance elements. The FORIN guide provides no indication on how to systematically curate the data used for the descriptive research.
For South East Asia region, where flooding is the most frequent trigger of disasters (Doocy et al., 2013), we propose the use of the hydrological catchment as to define the boundaries of our system of analysis and to identify the main elements of our system. The physical (hydrological) catchment is an important element of the system, as its characteristics dictate the propagation of most types of hazard through the system. Other important catchments are defined by social and economic processes. For example, the movement of people in the search for work (largely in the city) defines a social catchment. Policies that initiate at the regional level may cross catchment boundaries. At the global scale, international trade deals clearly transcend catchment boundaries. This physical control vs. socio-economic processes may yield interesting insights. Figure 1 shows the location of our two sites: 1) the Red River catchment (or parts of it) that drain toward and through Hanoi into the Red River delta; and 2) catchments that drain toward Marikina City and through the margins of the Manila conurbation. Each catchment site includes relatively large reservoirs that provide important processes related to water resources for agriculture, drinking water, energy, and flood control. Each site is subject to repeated typhoons and monsoonal rains, and is highly susceptible to mass movements of all types. Active faults are known to be present in both sites, although the background slip rates are likely very low (fractions of mm/y). Although we are largely concerned with hazards and their impacts that occur within the catchments, there are also hazards that can occur outside but that are large enough to have significant impact within the catchment. Earthquakes, tsunamis and volcanic eruptions are good examples. Even though these hazards are less frequent, they may figure more significantly in the culture of both people and disaster management authorities and therefore we cannot ignore them.
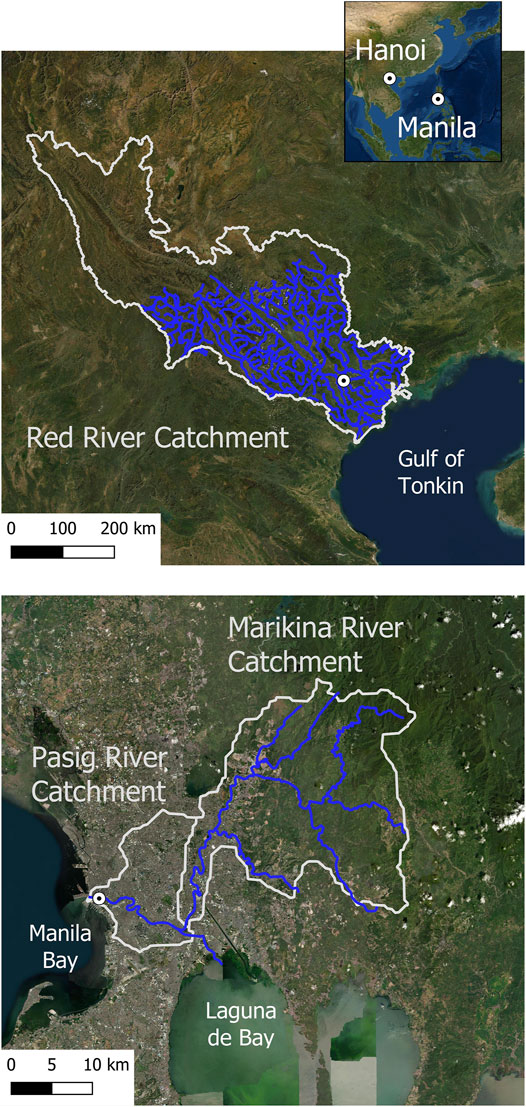
FIGURE 1. For South East Asia region, we propose the use of hydrological catchment to define the boundaries of our human-natural system. The system contains a physical catchment that drains into the city (Hanoi and Manila), which continues to flow out to the coast or inland water reservoirs. Source of aerial imagery: Esri, Maxar, GeoEye, Earthstar Geographics, CNES/Airbus DS, USDA, USGS, AeroGRID, IGN, and the GIS User Community, v10.6. Source of catchment area is the HydroBASINS layer (Lehner and Grill, 2013) from HydroSHEDS database. We have used modified layers at level 4 and level 8 for Hanoi and Manila study locations respectively. Source of river courses is the National versions of Vietnam and the Philippines from Global Map dataset (https://www.gsi.go.jp/kankyochiri/globalmap_e.html).
This article describes the development of a bespoke database, FORINSEA1.0, created to address the need for a systematic curation of information needed for the descriptive phase of the FORIN approach and its application to two study areas in the South East Asia region. FORINSEA1.0 allows researchers, for the first time, to explore and make use of subnational, geocoded data on major disasters triggered by natural hazards (flooding, earthquake, landslide and meteorological hazards) since 1945 until 2020 in the hydrological catchment of the Red River in Vietnam and the Marikina Basin in the Philippines. FORINSEA1.0 also contains relevant subnational information on relevant socio-economic policies and development of key infrastructure to provide the basis of the descriptive FORIN analysis. While the catchment approach is potentially transferable to other regions, this Data Report does not show how these records might be applied or integrated to support a FORIN investigation of a specific disaster or event, neither provide basic ground rules for setting up similar systems in other countries.
Materials and Methods
In FORINSEA1.0, all disasters are geocoded at subnational level with one row, or unique observation, per disaster event and affected area and all policy data (Table 1) are coded at different administrative level with one row, or unique observation, per the date and each observation including a link to the policy (and/or a citation), the keywords that are associated with it, the policy title and the and a qualitative ranking.1
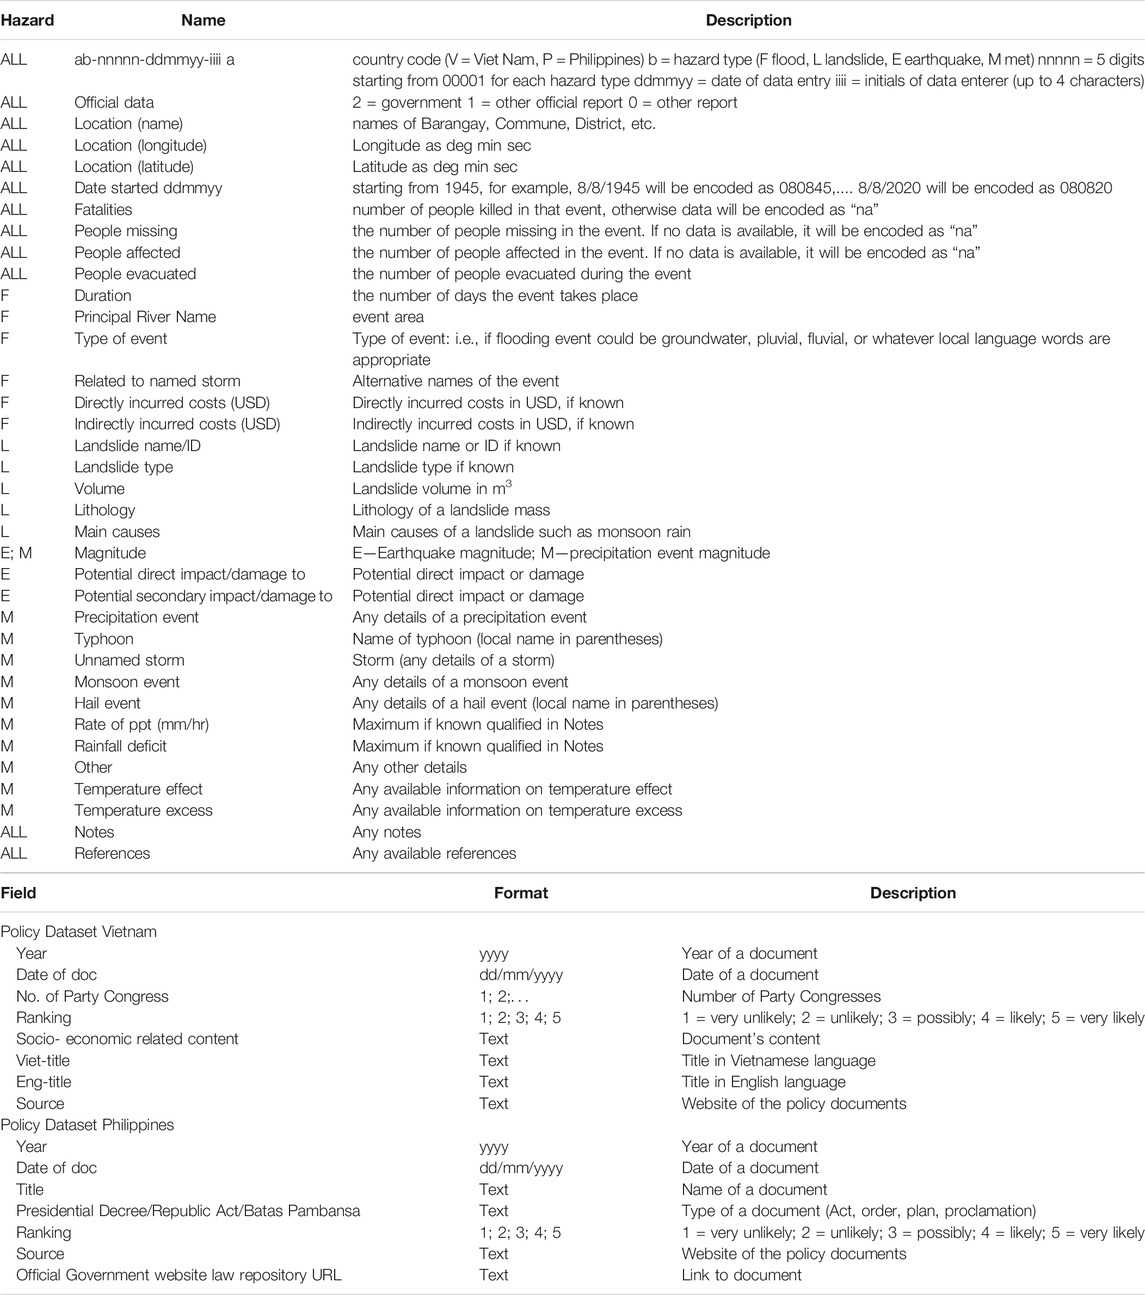
TABLE 1. Variable overview and description included in FORINSEA v1.0: divided into hazard dataset and policy dataset.
Creating FORINSEA1.0 involved three main stages, explained in detail below.
Stage 1: Disasters and Policy Data Searches Criteria
In FORINSEA1.0 disaster dataset we limited our searches to the disasters triggered by the following natural hazards: flooding, earthquake, landslide and meteorological hazards. The different data sources were searched according to the keywords that the research team has agreed and considered relevant for the FORIN analysis. We did the search in three different languages: Filipino, Vietnamese and English. Filipino is the national language used as the medium of official communication and a language of instruction in the educational system. We also constrained the selection of triggering natural hazards to the Red River and Marikina river hydrological catchments. The Red River basin included nine provinces: Lao Cai, Yen Bai, Vinh Phuc, Phu Tho, Hanoi, Hung Yen, Ha Nam, Nam Dinh, and Thai Binh. For the Marikina river catchment study area we have included Region III (Central Luzon) that contains Angat Dam and Ipo Dam and Region IV (Southern Tagalog) where Wawa dam (decommissioned since the 1960s) is located. All these dams have provided water to Metro Manila.
In FORINSEA1.0 policy dataset we filtered for the policy database(s), guided by the overarching principle that policies of interest (relevance) includes policies related to forces, processes or events with potential to affect catchment attributes and dynamics (within the catchments and into Metro Manila or Hanoi):
1. Change land-cover or land-use
2. Change management of Flood Embankments Works (FEW) or other large infrastructure (e.g., highway construction)
3. Change/develop FEW/hazard infrastructure
4. Change the physical environment or its management, whether as part of DRR or climate change mitigation/adaptation, etc.
5. Agricultural and land-reform (forestry, mining, farming)
6. Change demographics (e.g., social housing policies, international trade deals, the Balikbayan program, etc.)
7. DRR related laws, regulations, etc.
8. Change political leadership that might result in more or less implementation of existing or future policies (e.g., changes in government party, or new leadership in national-local administrations).
A set of critical keywords were selected when searching the different policy data sources to filter the search by the above overarching criteria. The relevance to FORIN analysis ranking was done based on the time and geographical scope of the policy. For example, it is ranked as very likely relevant (rank 5) if the policy affected the land use within the Red River basin, and relevance ranked lower if the land used affected other provinces in the North of Vietnam (rank 4) or (rank 2–3) if land use affected other regions/provinces in South or Middle of Vietnam. Timewise, the policy data entrance is ranked higher (rank 4–5) if the land issues happened in the period of 1945 until 2020 and lower (rank 1–3) if plans are about land use in the future (2030–2050 for instance).
Stage 2: Main Information Sources
Data has been collected from the following sources of information: easily accessible reports and articles, drawn from peer-reviewed literature, government and lending banks reports, disaster management reports, NGO reports, and open-library accounts.
For Vietnam, keywords used: land (use/reform/cover), land allocation for individuals/agencies, water management, waste management, manufacturing regulations, flood control, mining, deforestation, afforestation, fire-fighting, public health/public welfare, international trade deals, state/province financial management, town planning, social security for groups affected by natural disasters/land acquisition, disaster mitigation and risk reduction policies, population issues, social housing, agriculture policies, energy (oil/fuel/etc.), price/tax of land/housing, hydroelectric/dyke.
For the Vietnam policy dataset, the list of all policies from the National Database of Legal Documents (NDLD) was used which was available at the website until March 2020.
The data sources used for the Philippines includes Emergency Events Database (EM-DAT) (Guha-Sapir et al., 2014), scanned reports from the (previously called) National Disaster Coordinating Council (NDCC) and (presently called) National Disaster Risk Reduction Council (NDRRC) as well as scanned newspaper reports were obtained and used for the disaster dataset. In the Philippines, flooding as a hazard category is usually recorded under typhoons and not as an independent entity making it difficult to separate typhoon and flood events. Therefore, except for a few flooding entries from digitized newspaper sources and government records, most of the data entries for flooding were extracted from the global database, Emergency Events Database (EM-DAT). EM-DAT considers an event a disaster if at least one of the following criteria is met: 10 or more people dead, 100 or more people affected, the declaration of a state of emergency, and a call for international assistance. Under the Hydrological Disaster Subgroup, entries from EM-DAT were filtered to include only those under the Flood disaster type.
For the Philippines’s policy dataset, we searched official government repositories of laws and policies. These would be from the Official Gazette and online libraries of the designated national government agencies which have mandates over specific areas of interest of the research. All laws are required to be published in the Official Gazette in order to become effective. Designated national government agencies are those identified under the law to lead in the management of specific areas of concern. Examples are natural resources and certain hazards are under the Department of Environment and Natural Resources, responding to hazards are under the National Disaster Coordinating Council/National Disaster Risk Reduction and Management Council, the Office of Civil Defence. While there are other private online law libraries these were referred to as auxiliary sources of information. The reason for this is that the completeness and accuracy of such documents are not assured by the website owners and are therefore not fully reliable. There has also been a period in Philippine History that many “midnight” policies were signed without going through the usual process of law making and policy formulation. Specifically, these occurred during the Marcos martial law period and during the presidency of President Joseph Ejercito (Erap) Estrada. Thus, we have relied mainly on what is contained in official online portals. A limitation of this research is that this was conducted during the COVID-19 pandemic. Ideally, the search should have covered printed materials from the Official Gazette (OG) and the Office of the National Administrative Register (ONAR). All executive/administrative policies become effective once submitted to the ONAR, and the ONAR issues regular printed publications of these policies. Not all volumes of the Official Gazette and the ONAR Bulletin are available online. Due to safety reasons and quarantine restrictions, our search has been purely on available online resources.
The keywords used were very similar to those used in Vietnam. These are: Settlement, Forest, Water, Water Management, Mining, Quarrying, Landslides, Climate Change, Renewables, Disaster Floods, Disaster, Flood, Emergency services, Drought, Famine, Evacuation, Migration, Typhoons, Earthquakes, Volcanoes, Lahars, Landslides, Agrarian Reform, Agriculture, Trade laws, Food trade, Disease Control, and Disease Surveillance. The Law Policy typology is based on whether the identified document is a law or an administrative regulation. Administrative regulations are policies which give detail to how the laws will be implemented. The type of law is also recognizable as belonging to a particular period in Philippine History. Since the period from 1945 to 1987 has been a period of transition from colonial to semi-colonial types of government, the lawmaking body has also shifted. During the Martial Law period, for example, the President had law-making powers. Under the 1987 Constitution, the law-making powers are lodged under the Congress. There were also laws passed during the American period which became effective even after 1945 and were changed only during the Martial law period. Thus, laws typology includes: Acts, Commonwealth Act, Republic Act, Presidential Decree, Presidential Proclamation, Batas Pambasa, Presidential Administrative Order, US Laws. The administrative policies typologies are: Presidential Letter, State of the Nation, Executive Order, Memorandum Order, General Memorandum Order, Letter of Instruction, Memorandum Circular, Proclamation, Administrative Order, Resolution, and Executive Agency Plan.
Lastly, these laws and policies have been ranked according to 1- Highly Unlikely to 5-Very Likely. This ranking is based on whether the law or policy, notwithstanding its content containing at least one (1) key word, is relevant to the study. The relevance is ranked based on whether this law/policy affects a) how the hazard is perceived by government regulators, b) increases or reduces vulnerabilities, and c) increases or decreases the exposure of vulnerable groups to the hazard.
Stage 3: Spreadsheet to SQL Conversion
The data were collected as Excel spreadsheets and these tables were reviewed to clean to transfer to PostgreSQL.
Data Records
The most notable characteristics of the natural hazards’ events obtained for the Philippines and Vietnam study cases are summarized below.
The Philippines is hit by multiple typhoons every year and it is the most referred to meteorological hazard in the country. Hence, it is the hazard with the most data entries in this database. There is a total of 314 Typhoon entries in the database from 1951 to 2020; these range from tropical depressions to typhoons. Database columns that measure magnitude include 1) average wind speed and 2) rate of precipitation. However, the average wind speed values are not always given in reports and thus most data entries lack this. As for the rate of precipitation, this is not given in reports at all. Database columns that indirectly measure magnitude include 1) number of fatalities, 3) number of people affected. Entries in these data columns are more consistent and there are fewer missing values. Notable typhoon events are Typhoon Ketsana (Ondoy) of 2009 with a 110 km/h wind speed that caused 464 deaths and affected approximately 4,901,234 people. The Philippines was ill-prepared for a typhoon of this magnitude hitting Metro Manila, where the central government was located. This typhoon event eventually led to the creation of the new National Disaster Risk Reduction and Management Act of 2010. Typhoon Vamco (Ulysses) of 2020 is the most recent typhoon akin to Typhoon Ketsana. It caused 111 deaths and 4,945,461 people were affected.
Data entries for flooding events range from the year 1971 to 2016 with a total of 37 flood entries in the database. There are 12 entries before the year 2000 and 25 entries from 2000 to 2016. The flood of 7 July 1972 had the highest number of fatalities amounting to 427 with an approximate 6 million evacuees/people affected; it affected Central Luzon, Manila, and the Southern Tagalog Region. This flood was especially significant because it was 2 months before the declaration of Martial law by then President Ferdinand Marcos. In comparison, the recorded event with the lowest fatalities was on 17 January 2010 with only 1 fatality and 15,480 affected in Region IV.
There are 7 landslide entries ranging from the year 1971 to 2000. Database columns that indirectly measure magnitude include 1) People missing, 2) People evacuated, 3) People affected, and 4) Volume (of rainfall). However, most data entries are in the 3) People affected column, only one entry is included in the 1) People missing column and there are no entries in the 2) People evacuated column. Only one data entry, the Cherry Hills Landslide, included 4) volume of rainfall amounting to 4500 m3 during the event. The most notable landslide event occurred on 3 August 1999, known as the Cherry Hills Landslide; it occurred in the Cherry Hills Residential Area in Antipolo, Rizal adjacent to Metro Manila. The landslide was caused by multiple nights of torrential rain and cause 58 fatalities and affected approximately 1,516,308 people. Even with multiple warnings people refused to evacuate due to not wanting to leave behind their belongings and believing their houses could withstand the landslide.
There is a total of 6 earthquake entries in the database from 1968 to 2018; 5 entries prior to the year 2000 and 1 entry during 2018. Database columns that indirectly measure magnitude include 1) Fatalities, 2) People evacuated, 3) People affected, 4) Potential direct impact/damage to, 5) and Potential secondary damage to. However, entries only usually have 1) Fatalities and 3) People affected. Moreover, data entries use different magnitude scales, but the Richter scale is the most consistently used (if any scale is given at all). Magnitude scales range approximately from 5.3 to 8.0. The 1990 Earthquake is the most prominent earthquake event in recent history; it affected Luzon wreaking most havoc in Baguio City (north of Metro Manila) with approximately 1,283 deaths and 1,255,248 people affected. This led to the re-examination of the National Building Code of the Philippines (NBCP) and the National Structural Code of the Philippines (NSCP). In 1992, the NSCP was revised and changes pertaining to anticipatory measures for soil liquefaction potential were introduced following the finding that the 1990 EQ damages were due to foundation failures due to liquefaction.
The most notable characteristics of the natural hazards’ events obtained for Vietnam are summarized below.
Due to the geographical characteristics of Vietnam, storms and floods have a significant impact on the country. 455 flood occurrences, 104 landslide events, 44 earthquake events, and 187 storm events were included in the data collection. The information shown above was gathered from a variety of sources (national historical archives and NGOs authorized to operate in the territory). The data collection region includes the Red River Delta provinces, which now consist of nine provinces. As for the data collection period, we searched and filtered data from 1945 to the present, ensuring that all catastrophic events were within this time frame.
Because Vietnam is extensively hit by heavy rains every year, inundation data is the most reported of all the data obtained. It was gathered from 1941 to 2015. The number of individuals killed in the floods was not completely updated in all data entries. Aside from that, detailed records reports illustrate the flood’s impact on dwellings, land, and agriculture. The data is stored in the form of documentation, and the local People’s Committees create statistics and transmit reports in the form of official letters and orders to be saved in the national archives. In August 1971, a flood event occurred that was notable and had a significant impact on a vast region of the Red River Delta provinces. This disaster killed 100,000 people and devastated up to 4 provinces in the Red River Delta region. That flood was formed by a series of storms and torrential rain that lasted 26 days, from 20 July to 15 August 1971, and breached numerous critical dikes between 20 August and 27 August 1971. As a result, numerous regions were severely flooded and damaged.
From 1954 to 2020, there were 187 Hurricane listings in the database, ranging from tropical depressions to hurricanes. Columns in the Magnitude database include 1) average wind speed and 2) precipitation speed. However, mean wind speed measurements are not usually provided in reports, therefore most data items lack this value. Precipitation rates are not included in the reports. The database fields that quantify indirect magnitude are 1) the number of deaths and 3) the total number of people affected. These data columns’ entries are more consistent and have fewer missing values. Storms in the Red River basin inflict minimal harm to humans, with yearly wind gusts ranging from 65 to 120 km/h. Storms in Vietnam’s territory frequently bring severe rainfall, causing infrastructure damage and following events such as floods and landslides due to geographical factors. 4 successive storms occurred in August 1971, including JEAM, KIM, LUCY, and CORA, which occurred from July 18 in 1971, to August 28 in 1971, causing significant flooding.
Between 1990 and 2015, there were 104 landslide entries. Columns in the indirect intensity measurement database include 1) Missing People, 2) Evacuated People, 3) Affected People, and 4) Volume (precipitation). Most of the data entries, however, are in column (3) Affected Person, with just one record in column (1) Missing Person and no entry in column (2) Evacuated Person. Because Vietnam’s geography is hilly, landslides that caused significant damage occurred in provinces such as Yen Bai, Lai Chau, Bac Kan, Son La, Tuyen Quang, and Ha Giang.
Vietnam is not located on the world’s seismic belt; reported earthquakes are in the range of magnitude from 4.1 to 6.9 over a short period of time. As a result, earthquakes on Vietnamese territory were reported with minor damage to infrastructure and no loss of life. From 1945 through 2018, the database contains 44 earthquake entries. The database columns that indirectly measure magnitude include 1) Deaths, 2) Evacuated Persons, 3) Affected Persons, 4) Potential Direct Impact/damage to, 5) and Potential Secondary Damage. However, the entries are usually only (1) Deaths and (3) Affected Persons. Furthermore, the data items use different magnitude scales, but the Richter scale is used most consistently (if any). The magnitude scale ranges from 4.1 to 6.9.
Technical Validation
FORINSEA1.0 was developed by undertaking an extensive search of documentation from a variety of readily available digital and paper-based data sources. We now outline a number of methodological issues encountered in the process of compiling the database.
A central challenge when working with geographical data relating to historical events is temporal bias in coding. Information about natural hazards and resulting disasters is much more readily available today than in the 1940’s, and this is especially true regarding details on the location of remote events in developing countries. However, the increasing frequency of disaster events is also due to two other contemporaneous trends: global warming and associated physical processes that have increased the prevalence and severity of natural hazards, and population growth and shifting settlement patterns that have led to increasing human exposure to several types of hazards.
For the Philippine’s disasters dataset, most reports from government agencies were obtained as scanned documents. This made the task of looking through hundreds of pages for necessary data a difficult and slow process. Moreover, duplicate entries from EM-DAT were meticulously checked and replaced with local sources, since national-level reports take precedence.
Location information on disaster events from EM-DAT mostly makes use of first-order or second-order administrative levels (i.e., for the Philippines, regional and provincial level). However, some entries use third-order administrative levels (i.e., city/municipal) or even refer to the country’s main island groups (i.e., Luzon, Visayas, Mindanao) thus making location information inconsistent. The flood entries were then delineated to only include adjacent regional-level locations (i.e., Region III and Region IV) to the project’s area of interest, Metro Manila or the National Capital Region. This delineation could be compared with the Geocoded Disasters (GDIS) dataset (Rosvold and Buhaug, 2021) which provides spatial geometry in the form of GIS polygons and centroid latitude and longitude coordinates for each administrative entity listed as a disaster location in the EM-DAT database.
Database columns that measure magnitude of tropical cyclone disaster subtype within EM-DAT include 1) Average wind speed and 2) rate of precipitation. However, the average wind speed values are not always given in reports and thus most data entries lack this. As for rate of precipitation, this is not given in reports at all. Database columns that indirectly measure magnitude include (1) number of fatalities, (3) number of people affected. Entries in these data columns are more consistent and there have fewer missing values.
Usage Notes
FORINSEA1.0 provides a comprehensive and coherent historical record of disasters, from 1945 until 2020, socio-economic policies and development of key infrastructure at the hydrological catchments of the Red River Delta in Vietnam and the Marikina river basin in the Philippines. The FORINSEA1.0 dataset allows researchers, for the first time, to explore and make use of geocoded data on major disasters affecting the two large and rapidly expanding cities of Hanoi and Metro Manila and their catchment areas. This dataset is the result of an international collaborative effort to support the implementation of the Sendai Framework for Disaster Risk Reduction 2015–2030 (SFDRR). The catchment approach used for the creation of this dataset is potentially transferable to other regions and we have illustrated how different global datasets (e.g., HydroSHEDS and EM-DAT) can be combined with other in country data sources to create an inter-related set of evidence suitable for FORIN descriptive explanation phase.
Data Availability Statement
FORINSEA1.0 is available for the public to download in the online Zenodo (2022) repository with DOI: https://doi.org/10.5281/zenodo.6200644. The dataset is stored in two different formats; as Comma Separated Values (CSV) format for ease of use in any statistical software, as PostgreSQL (SQL) for use with open PostgreSQL software. The multi-hazard-event database is also available as a SHAPEFILE (SHP) for use on Geographical Information System (GIS).
Additionally, the FORINSEA1.0 dataset can be queried via the British Geological Survey data Centre portal following the steps indicated below:
1. Download PGAdmin4 from here: https://www.pgadmin.org/download/
2. Go to Object >> Create >> Server
3. In the General tab, give the server a name such as ‘Multihazard’
4. In the Connection tab, enter:
a. Host name/address: 194.66.252.166
b. Port: 5432
c. Username: MHZdb_Read
d. Password: mult1HzR2ad
5. In the left-hand panel you can now navigate your server: Multihazard (or whatever name you gave it) >> Databases >> MHZdb >> Schemas >> multihazard >>Tables
6. Right click on the EVENT table and select View/Edit Data >> All rows
7. Scroll all the way to the right, the last column called ‘geom’ and click the eye icon to preview the map
Figure 1 incorporates data from the HydroSHEDS database which is © World Wildlife Fund, Inc. (2006–2013) and has been used herein under license. WWF has not evaluated the data as altered and incorporated within Figure 1, and therefore gives no warranty regarding its accuracy, completeness, currency or suitability for any particular purpose. Portions of the HydroSHEDS database incorporate data which are the intellectual property rights of © USGS (2006–2008), NASA (2000–2005), ESRI (1992–1998), CIAT (2004–2006), UNEP-WCMC (1993), WWF (2004), Commonwealth of Australia (2007), and Her Royal Majesty and the British Crown and are used under license. The HydroSHEDS database and more information are available at http://www.hydrosheds.org.
Author Contributions
Conceptualization, AP, MG and YH. Methodology, AP, MG and YH. Software, AB and JM. Validation, AG, PD and YH. Formal analysis, AG, PD and YH. Writing—original draft preparation, RA and AP. Writing—review and editing, AP, RA, AG, PD, and YH. ALL authors have read and agreed to the published version of the manuscript.
Funding
This work has been funded by the Royal Society Resilient Futures Challenge-Led Grant via the project entitled “Using a multi-hazard and catchment-based approach to understand and increase resilience in hyper-expanding cities in Vietnam and the Philippines” (No. RS Ref CHL\R1\180192).
Conflict of Interest
The authors declare that the research was conducted in the absence of any commercial or financial relationships that could be construed as a potential conflict of interest.
Publisher’s Note
All claims expressed in this article are solely those of the authors and do not necessarily represent those of their affiliated organizations, or those of the publisher, the editors and the reviewers. Any product that may be evaluated in this article, or claim that may be made by its manufacturer, is not guaranteed or endorsed by the publisher.
Acknowledgments
The authors would like to thank the two anonymous reviewers for their helpful comments and detailed reviews. We would also like to acknowledge the contributions of Dr Michael Ellis for his vision, efforts bringing together a multi-disciplinary team and continuous encouragement to step outside our comfort zone through out the project.
Footnotes
1Relevance to FORIN analysis ranked as: 1 very unlikely; 2 unlikely; 3 possibly 4; likely; 5 very likely.
References
Alcántara-Ayala, I., Burton, I., Lavell, A., Mansilla, E., Maskrey, A., Oliver-Smith, A., et al. (2021). Editorial: Root Causes and Policy Dilemmas of the COVID-19 Pandemic Global Disaster. Int. J. Disaster Risk Reduct 52, 101892. doi:10.1016/j.ijdrr.2020.101892
DKKV (2012). “Detecting Disaster Root Causes. A Framework and an Analytic Tool for Practioners,” in DKKV Publication Series (Bonn: German Committee for Disaster Reduction), 48.
Doocy, S., Daniels, A., Murray, S., and Kirsch, T. D. (2013). The Human Impact of Floods: a Historical Review of Events 1980-2009 and Systematic Literature Review. Plos Curr., 5. doi:10.1371/currents.dis.f4deb457904936b07c09daa98ee8171a
Fraser, A., Paterson, S., and Pelling, M. (2016). Developing Frameworks to Understand Disaster Causation: From Forensic Disaster Investigation to Risk Root Cause Analysis. J. Extr. Even. 03, 1650008. doi:10.1142/s2345737616500081
French, A., Mechler, R., Arestegui, M., Macclune, K., and Cisneros, A. (2020). Root Causes of Recurrent Catastrophe: The Political Ecology of El Niño-Related Disasters in Peru. Int. J. Disaster Risk Reduction 47, 101539. doi:10.1016/j.ijdrr.2020.101539
Gotangco, C. K., Narisma, G., Wong, J., Marquez, N., Clarete, R., Porio, E., et al. (2014). Harmonizing FORIN for Climate Change Adaptation & Disaster Risk Management to Develop Multi-Sectoral Narratives for Metro Manila. Taipei Technical Report. Integrated Research on Disaster Risk International Centre of Excellence (IRDRICoE).
Guha-Sapir, D., Below, R., and Hoyois, P. (2014). EM-DAT: International Disaster Database.(CRED), Centre for Research on the Epidemiology of Disas Ters. Brussels: Centre for Research on the Epidemiology of Disas ters.
Lehner, B., and Grill, G. (2013). Global River Hydrography and Network Routing: Baseline Data and New Approaches to Study the World's Large River Systems. Hydrol. Process. 27, 2171–2186. doi:10.1002/hyp.9740
Nakasu, T., Ono, Y., and Pothisiri, W. (2017). Forensic Investigation of the 2011 Great East Japan Earthquake and Tsunami Disaster. Dpm 26, 298–313. doi:10.1108/dpm-10-2016-0213
Oliver-Smith, A., Alcántara-Ayala, I., Burton, I., and Lavell, M. A. (2016). “Forensic Investigations of Disasters (FORIN): a Conceptual Framework and Guide to Research (IRDR FORIN Publication No.2),” in IRDR FORIN Publication No.2 (Beijing: Integrated Research on Disaster Risk).
Rosvold, E. L., and Buhaug, H. (2021). GDIS, a Global Dataset of Geocoded Disaster Locations. Sci. Data 8, 61. doi:10.1038/s41597-021-00846-6
Keywords: disasters, hazards, Hanoi, Manila, catchment
Citation: Payo A, Arnhardt R, Galindo ACR, Van Dong P, Guzman MALG, Hatta YO, Bevan A and Monje JCN (2022) Developing an Open Database to Support Forensic Investigation of Disasters in South East Asia: FORINSEA v1.0. Front. Earth Sci. 10:833599. doi: 10.3389/feart.2022.833599
Received: 11 December 2021; Accepted: 10 February 2022;
Published: 03 March 2022.
Edited by:
Irasema Alcántara-Ayala, National Autonomous University of Mexico, MexicoReviewed by:
Alonso Brenes, La Red, Costa RicaCopyright © 2022 Payo, Arnhardt, Galindo, Van Dong, Guzman, Hatta, Bevan and Monje. This is an open-access article distributed under the terms of the Creative Commons Attribution License (CC BY). The use, distribution or reproduction in other forums is permitted, provided the original author(s) and the copyright owner(s) are credited and that the original publication in this journal is cited, in accordance with accepted academic practice. No use, distribution or reproduction is permitted which does not comply with these terms.
*Correspondence: Andres Payo, agarcia@bgs.ac.uk