Analysis of the Deformation Law of Deep and Large Foundation Pits in Soft Soil Areas
 Tao Yang*
  Shuailei Liu
 Yang Liu
- School of Urban Planning and Municipal Engineering, Xi’an Polytechnic University, Xi’an, China
Taking a deep excavation in Suzhou soft soils adopting three support schemes as the background, the excavation performance metrics, including the heave and lateral deformation of diaphragm walls, surface vertical deformation, vertical deformation of surrounding buildings, and earth pressure, are thoroughly investigated based on 15 excavation cases collected in the soft soil area of Suzhou. Based on the analysis of monitoring data, some findings were achieved: the foundation pit deformation is greatly affected by the spatial effect. The existing station can constrain the foundation pit deformation. Benefiting from the combination of various support solutions, the average maximum deflection of the diaphragm wall is 0.10% He. The maximum lateral movement depth of the diaphragm wall (δhm) is mainly located at (He-7, He+12.5). The vertical deformation of the wall top is greatly affected by the excavation exposure time and soil conditions. The heave range of the wall top is (−0.08∼0.26%) He. Under the action of the displacement of the diaphragm wall to outside the pit and the upward displacement of the wall top, the ground surface is uplifted, and the maximum uplift is (0.02∼0.14%) He, ranging from 0.12δhm to 1.13δhm. The maximum surface settlement is (−0.01% ∼ −0.15%) He, ranging from −0.22δhm to −3.11δhm. The form of building heave is mainly affected by the surface heave and the distance from the diaphragm wall (d). When d is within a certain range, there is a heave settlement difference between the adjacent side and the opposite side of the excavation, and the adjacent side undergoes mostly subsidence, while the opposite side undergoes mostly uplift. The peak value of the apparent earth pressure (AEP) envelope is 0.59γHe, which falls within (0.47∼0.78) He. The calculation scheme proposed by Kim can be used to predict the AEP for multiple soil types.
Introduction
With the rapid development of urbanization, the utilization rate of urban space is increasing, and foundation pit engineering often occurs close to high-rise buildings, subway tunnels, municipal pipe networks, etc. (Liu et al., 2012). However, foundation pit excavation inevitably disturbs the surrounding environment. Therefore, a reasonable and effective supporting scheme is an important prerequisite to ensure the safe and smooth implementation of foundation pit engineering in complex environments (Cai et al., 2018). The selection of the foundation pit support scheme should consider the support safety level, site conditions, excavation depth, surrounding building foundation type, etc. A single type of supporting form has difficulty meeting the requirements of current foundation pit engineering. Foundation pit supporting schemes tend to be diversified and combined gradually (Zhou et al., 2020). In the meantime, foundation pit engineering is regional, and the environmental effects caused by foundation pit excavation in different regions are quite different. Combined with the unique characteristics of the soft soil layer in Suzhou and eastern coastal areas (soft soil generally has three high and three low characteristics: high moisture content, high sensitivity, and high compressibility; low permeability, low strength, and low density) (Ma et al., 2020), the special engineering mechanical properties also necessitate higher requirements to the design and construction of foundation pit support, dewatering, and excavation in soft soil areas (Zhang et al., 2012).
In recent years, many scholars have studied the disturbance law of foundation pit excavation in soft soil areas by analyzing measured data. Liu et al. (2019a) studied the deformation characteristics of surrounding buildings caused by foundation pit excavation and found that the building deformation was related to the type of foundation and that the deformation of shallow foundation buildings was significantly larger than that of pile foundations. Ding et al. (2018) discussed the influence of partition excavation on the deformation and stress behavior of subway foundation pits and found that the different distributions of buildings on both sides of narrow and long foundation pits led to notable differences in the deformation of the walls on both sides. Zeng et al. (2018) found that the active earth pressure in the middle of the sandwich soil was much smaller than that on both sides when the adjacent foundation pits were excavated at the same time, which made the deformation of the middle wall smaller; the foundation pit deformation was caused by soil extrusion. Wang et al. (2021a) discussed the influence of foundation pit excavation on adjacent railway subgrade through finite element software and measured results of the foundation pit. Chen et al. (2018) reported a case of a foundation pit adjacent to a subway tunnel excavated by a bottom-up partition. Incorporating 15 relevant cases, a general relationship between wall deflection and excavation area was given. Based on 10 collected foundation pits with continuous pile-row walls, Ying et al. (2020) pointed out that the empirical formula for predicting the maximum deflection of pile-row walls should consider the influence of excavation width.
This article relies on a deep foundation pit project in the Suzhou area using three supporting schemes. The redistribution and transmission of material, energy, and information in the stratum caused by spatial reasons, such as the difference in soft soil layer structure and the transformation of spatial pattern, reflect the influence of the spatial effect (Fan et al., 2019; Fu et al., 2021; Kang et al., 2021). In this paper, the development of and variation in massive measured data, such as the uplift and lateral deformation of the diaphragm wall, the uplift and subsidence of the surface, the uplift and subsidence of the surrounding buildings, and the earth pressure, are continuously tracked. Combined with the construction log, the depth effect and spatial effect of the retaining structure of the foundation pit are analyzed, and the temporal and spatial deformation characteristics of the deep foundation pit and the surrounding environment under various supporting schemes in soft soil areas are discussed. In view of this type of deep foundation pit engineering, no matter existing literature or engineering practice in soft soil area, there are few reports, and it is necessary to deeply explore the deformation characteristics of foundation pit excavation in the Suzhou soft soil area. This paper can also provide some references for the design, construction, and research of similar projects.
Project Introduction
Project Profile
A station project in Suzhou Industrial Park shares a 33.5 m underground continuous wall of subway line S3. The total length of the foundation pit is approximately 156 m, the excavation width is approximately 24.5–42.5 m, the excavation depth is approximately 17.2–18.7 m, and the underground building area is approximately 5,202.3 m2. The foundation pit is excavated along Feng ting Avenue, with a knife-shaped plane. Residential buildings lie on both the north and south sides, and the nearest distance is approximately 13 m from the outer line of the foundation pit. To avoid affecting traffic, a temporary pavement system is built at the junction of line S3, and semi-cover excavation is carried out. The foundation pit plane is shown in Figure 1.
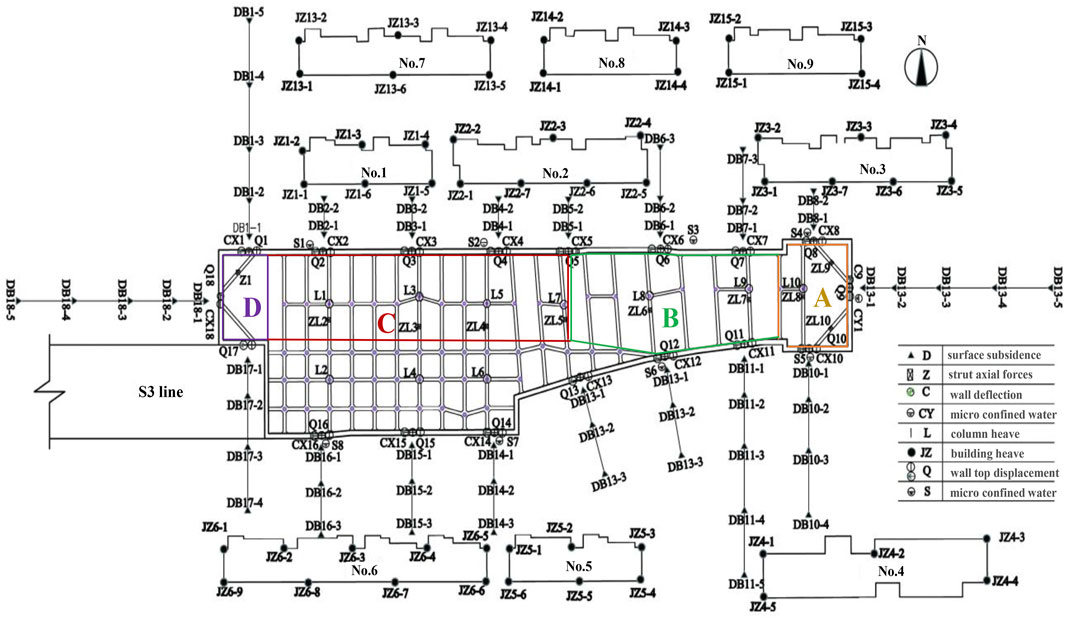
FIGURE 1. Layout and zoning of foundation pit plane monitoring points.
Geological Condition
The proposed site is located in the Tai Hu Basin in the lower reaches of the Yangtze River, with a low terrain. The foundation soil from the surface to a depth of approximately 70.0 m consists of loose sediments deposited from the Quaternary Holocene to the early Pleistocene, mainly clay soil and interbedded sandy soil. The physical and mechanical parameters of the soil layer are shown in Table 1. The groundwater in the site is divided into three categories according to the different occurrence conditions: groundwater in the shallow filling layer, where the stable water level is 0.51∼0.90 m; a stable water level of micro confined water at 0.50∼0.60 m in the ③3 silt layer and ④2 silt sand layer; and a ⑦2 silt sand layer of confined water with a stable water level of −2.50 ∼ −2.80 m and an annual variation of approximately 1 m.
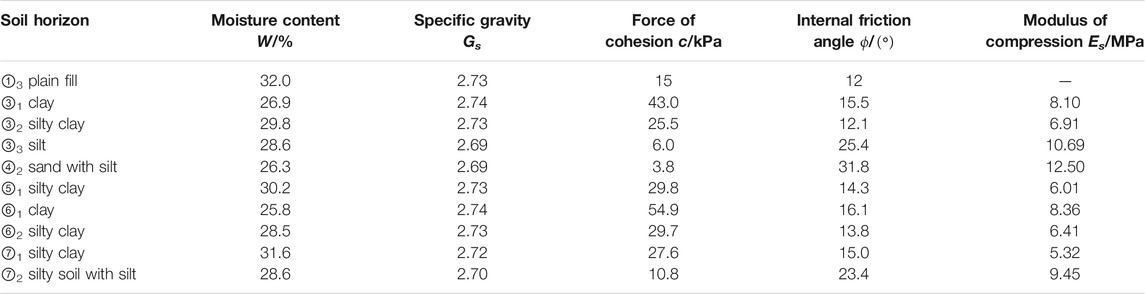
TABLE 1. Physical and mechanical parameters of the soil layer.
Field Monitoring and Construction Conditions
Our goal is to ensure the smooth progress of foundation pit excavation and the safety of surrounding structures, obtain the stress and deformation information of supporting structures and surrounding structures in a timely manner during excavation, and dynamically monitor the following aspects of the project: (1) surface settlement behind the wall (D1-1 ∼ D1-6 to D18-1 ∼ D18-6); (2) support axial force (ZL1-1 ∼ ZL1-5 to ZL10-1 ∼ ZL10-4); (3) lateral displacement of the diaphragm wall (CX1 ∼ CX18); (4) confined water level (CY1); (5) column heave (L1 ∼ L10); (6) uplift and subsidence of surrounding buildings (JZ1-1 ∼ JZ1-6 to JZ6-1 ∼ JZ6-9); (7) vertical/horizontal displacement of diaphragm wall top (Q1 ∼ Q18); and (8) micro confined water level (S1 ∼ S8). To this end, the specific layout scheme is shown in Figure 1.
In view of the deep foundation pit excavation, poor geological conditions, and high safety risks, an 800 mm thick diaphragm wall + internal support enclosure scheme is designed, and the internal support includes concrete support and steel support. The section size of concrete support is 800 mm × 1000 mm, while the diameter of steel support section is 609 mm. Based on the space-time effect theory, combined with the supporting scheme, the foundation pit is divided into four partitions, and the partition of the foundation pit is shown in Figure 1. Area A involves 4 supports, area C involves 3 supports, and areas B and D involve 5 supports; the specific layout is shown in Figure 2. The excavation of the foundation pit inevitably causes disturbance to the surrounding environment. To ensure the protection of line S3 during the construction process, 8 MJS (Metro Jet System) piles are set up at the joint of the common ground wall for water sealing and reinforcement.
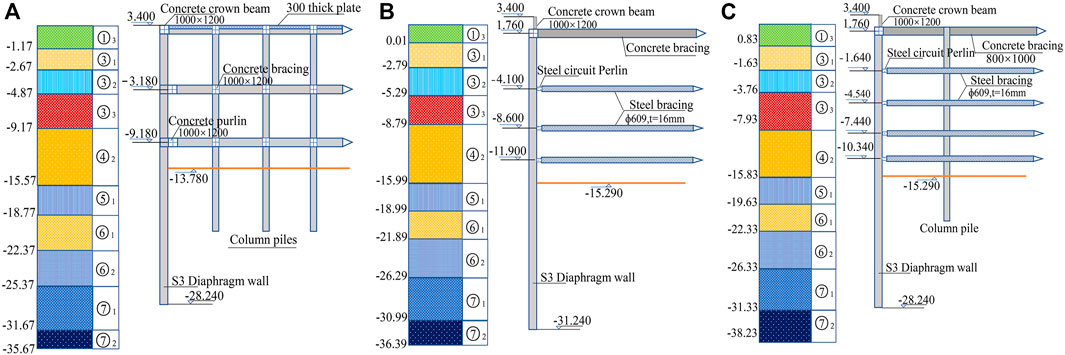
FIGURE 2. Section of the foundation pit retaining structure. (A) 3 supports, (B) 4 supports, (C) 5 supports.
The foundation pit is constructed step by step east to west according to the principle of layered block excavation. The actual construction steps can be divided into 20 conditions, as shown in Table 2.
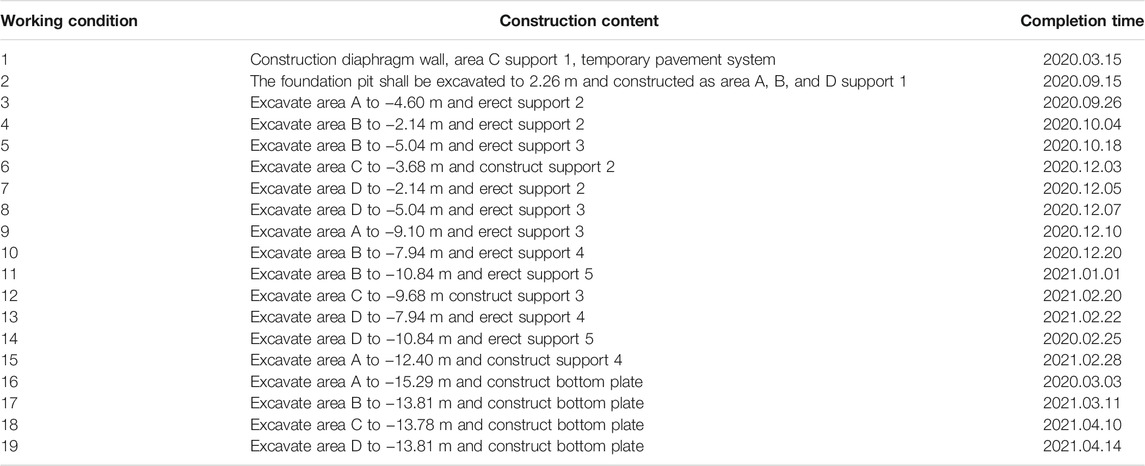
TABLE 2. Construction conditions.
Monitoring Deformation Analysis
Lateral Displacement Analysis of the Diaphragm Wall
Figure 3 shows the lateral displacement of the diaphragm wall on both sides of the foundation pit after excavation. 1) The overall shape of the diaphragm wall lateral displacement is a drum belly, and the deformation of measuring point CX14 is consistent with the curve of the ladder drum belly proposed by Ding et al. (2019). The reason for the bulge shape is the change in the stiffness of the diaphragm wall. At the top and bottom of the diaphragm wall, due to the shrinkage of the top beam and fixed end, their stiffness is relatively high, but there is no prominent constraint in the middle, and the stiffness is low, resulting in an uneven reduction within a certain depth of the lateral displacement of the diaphragm wall. The deformation of measuring point CX16 is triangular, and there is a sharp point at a depth of −8.60 m. We assume that this point lies close to the station of line S3. With increasing He, the shielding effect of the station is substantial (Zhu et al., 2013), the vertical spacing of the support is reduced, the embedded depth of the diaphragm wall is deep, and there is no kicking phenomenon, so the lateral displacement of the diaphragm wall is triangular. 2) Affected by the spatial effect and excavation area Ae, the lateral displacement of the diaphragm wall in area C is the largest, and the maximum lateral displacement δhm is 48.65 mm at CX3, followed by areas B and D. The displacement in area A is the smallest, and the minimum lateral displacement is 9.7 mm at CX10. Due to the appearance of the corner, the structural stiffness is improved, and the maximum lateral displacement at measuring point CX14 is only 1/3 of that at CX3. 3) The displacement of the top of some diaphragm wall outwards of the pit is mainly due to ①3 high compressibility of the soil layer. When the gantry crane mounted on the crown beam generates thrust outwards, the soil behind the wall is easily compressed, inducing the deformation of the top of the diaphragm wall outwards to the pit.
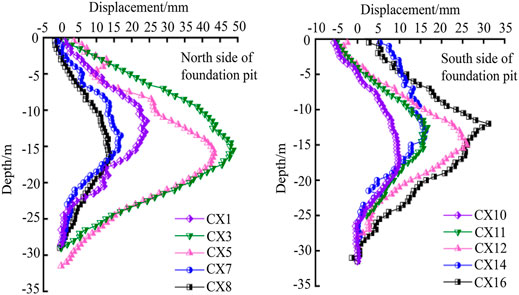
FIGURE 3. Lateral displacement curve of ground wall.
Figure 4 shows the relationship between δhm and He and the relationship between Hm and He. From Figure 4A, the deflection of the diaphragm wall in area A is (0.01∼0.10%) He, and the distribution range is small, which is near the lower limit proposed by Li et al. (2019) and Liao et al. (2015), mainly because Ae of area A is small and there are four corners, which greatly improves the stiffness of the envelope structure. The deflection of the diaphragm wall in area D is (0.08∼0.21%) He, and the distribution range is medium. The deflection of the diaphragm wall in zones B and C is (0.01∼0.28%) He, and the distribution range is the largest. The overall deflection range of the diaphragm wall is (0.01∼0.28%) He, with an average of 0.10% He. Near the upper boundary of the statistical results of Li et al. (2019), the deflection range is generally less than at the upper boundary of the statistical results of Liao et al. (2015). These results show that this project benefits from the combination of various supporting schemes so that it can better control the lateral displacement of the diaphragm wall in complex environments.
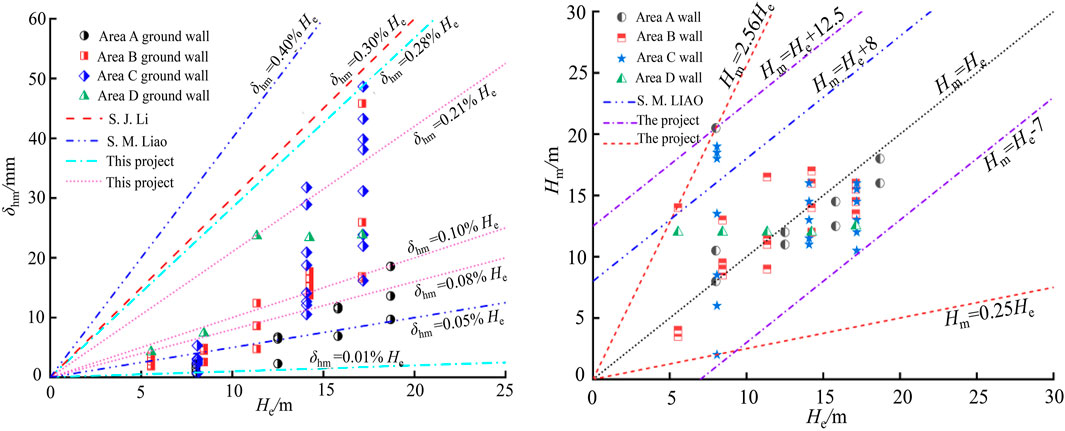
FIGURE 4. Relationships between δhm and He and relationships between Hm and He. (A) Relationships between δhm and He. (B) Relationships between Hm and He.
Figure 4B shows the relationship curve between the maximum lateral displacement depth Hm and He of the diaphragm wall. Hm of the diaphragm wall of this project is mainly located between He-7, He + 12.5 or He 0.25∼2.56, and the data dispersion is slightly larger, which is related to various support schemes. These results are consistent with the lower limit of the statistical results of Liao et al. (2015) and higher than the corresponding upper limit. When He < 8.1 m, Hm is mostly below the excavated surface; when He > 8.1 m, Hm is mostly above the excavated surface. The main reason is that when He < 8.1 m, the concrete support cannot immediately reach the design strength after pouring, and the stiffness of the retaining structure is insufficient, resulting in a large deflection at the bottom, and Hm occurs farther below the excavation surface. However, when He > 8.1 m, the vertical spacing of the support decreases with increasing He, and the stiffness of the retaining structure is improved, providing a strong ability to resist the external load caused by soil unloading. Hm is larger above the excavated surface. Table 3 collects engineering cases in 15 similar site conditions in Suzhou. On this basis, to conveniently and quickly predict the maximum deflection distribution of the retaining wall at different construction stages, an upper boundary is summarized, as shown in Figure 5.
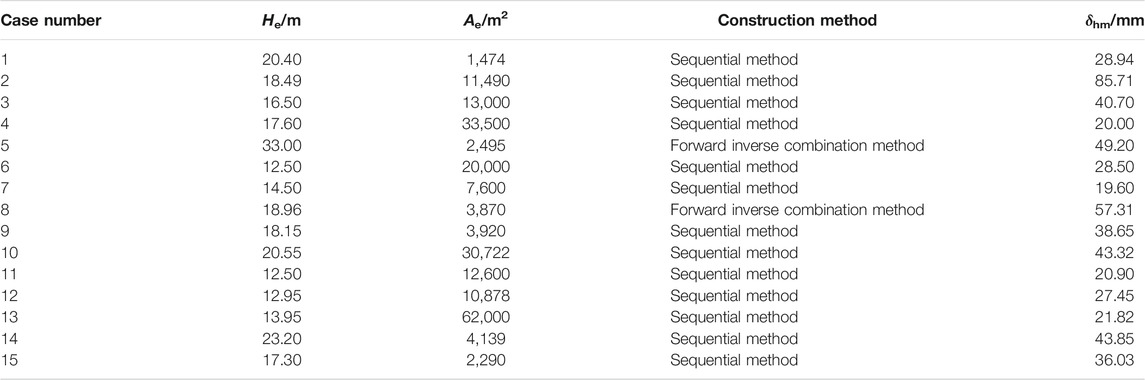
TABLE 3. Summary of basement excavations in Suzhou soft clay.
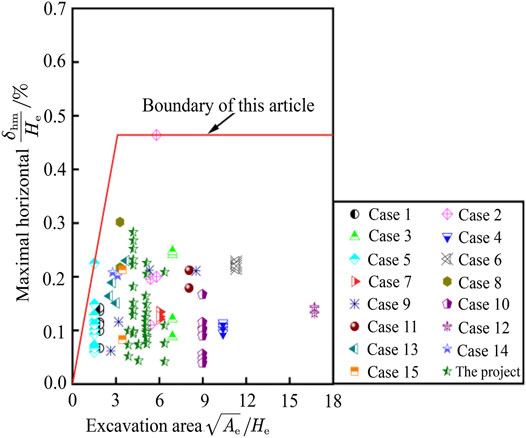
FIGURE 5. Relationships between δhm/He and √Ae/He.
Analysis of Uplift and Settlement of the Diaphragm Wall
Figure 6 shows the spatial distribution of the vertical displacement Vqd of the diaphragm wall under different working conditions and relationship between Vqd and He. From Figure 6A, Vqd in the circumferential direction of the foundation pit changes in wave shape under different working conditions. The uplift of the diaphragm wall in areas B and C is larger, followed by that of area A, and that of area D is the smallest. The reason is that Ae of area D is small, and the S3 line station also has a certain inhibitory effect on the vertical deformation of area D.
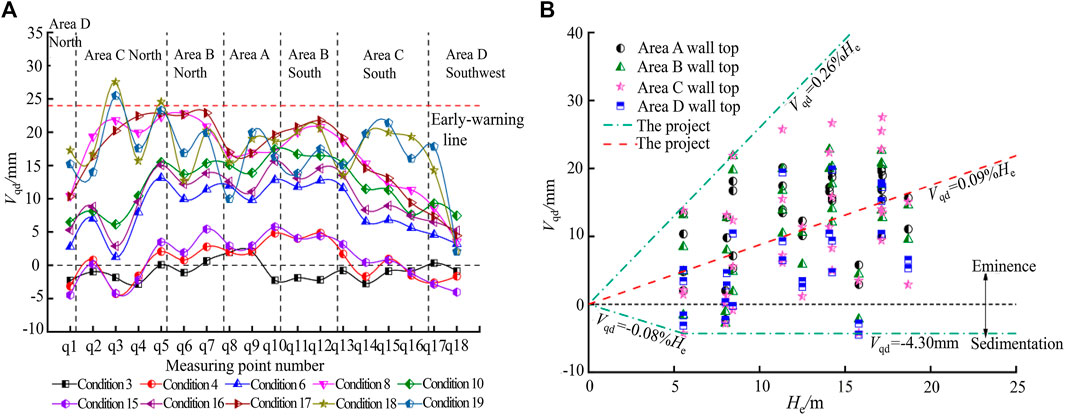
FIGURE 6. Vqd under different working conditions and relationships between Vqd and He. (A) Vqd under different working conditions. (B) Relationship between Vqd and He.
Under working condition 3, under the action of upper load and self-gravity, Vqd shows overall settlement, and the maximum settlement is at q3, which is −4.3 mm. With increasing excavation face and He, the bottom soil rebound increases, and Vqd shows uplift. Under working condition 8, the uplift value on the wall top is greatly different from that before and after the working condition. The main reason is that the MJS construction method is used to strengthen the water stop at the joint of the common ground connecting wall during this period, and the soil squeezing effect is prominent (Jiang et al., 2016; Fan et al., 2020). Under condition 18, Vqd of q3 and q5 measured in the north of area C exceeds the warning value, and the maximum uplift (at q3) is 27.52 mm, which is still within the control value. The reasons are as follows: 1) the construction time is long, as is the exposure time of the soil layer at the bottom of the pit, resulting in an increase in soil rebound; 2) the pit bottom soil is sandy soil with a large friction angle and significant wall uplift (Xiao et al., 2018; Li et al., 2021). To further study the uplift law of the diaphragm wall, Figure 6B shows the relationship curve between Vqd and He. Figure 6B shows that the uplift above Vqd is dominant and that the variation range is (−0.08–0.26%) He, with an average of 0.09% He. Combined with the lateral displacement analysis of the diaphragm wall, the author believes that under the same working condition, the uplift and settlement of the diaphragm wall will be affected by the spatial effect, that is, the lateral displacement makes the vertical displacement change relative to a certain extent. When the lateral displacement changes greatly, the uplift of Vqd is more obvious.
Measurement and Analysis of Surface Heave and Subsidence
The actual measurement and analysis of surface heave and subsidence and surface deformation is an important index to measure the impact of foundation pit engineering on the surrounding environment. Figure 7 shows the relationship between surface uplift δvm and He. Here, δvm has two forms: uplift and settlement. Consensus holds that the displacement of the diaphragm wall into the pit, the consolidation of the soil behind the wall, and the uplift of the pit bottom cause surface settlement behind the wall (Zhuang et al., 2016; Wang et al., 2020; Wang et al., 2021b) and that the uplift of the surface is mainly affected by the displacement of the diaphragm wall outside the pit and the upward displacement of the wall top. The maximum surface uplift is (0.02–0.14%) He, and the average is 0.07% He. Few cases of surface uplift in soft soil have been examined; Wu et al. (2016) took the upper limit of surface uplift of deep foundation pits in the cohesive soil area of Beijing to be 0.11% He, with an average of 0.03% He.
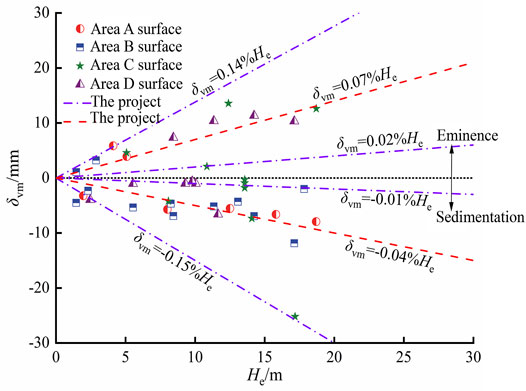
FIGURE 7. Relationship between δvm and He.
The comparison shows that the surface uplift in this project is more prominent, which is mainly related to the geological conditions and construction environment. The maximum surface subsidence is (−0.01% ∼ −0.15%) He, with an average of −0.04% He. According to the statistics of Wang et al. (2011), the surface settlement of deep foundation pits in Shanghai is (−0.1% ∼ −0.8%) He, and the average value is −0.38% He. In contrast, the soil in Shanghai is relatively soft, and the surface deformation behind the wall is greater. According to the statistics of Liao et al. (2015), the surface settlement of the foundation pit of the Suzhou metro station is (−0.04% ∼ −0.27%) He, with an average value of −0.13% He. Compared with this, the distribution range and average value of a surface settlement in the project are small, indicating that the support scheme of the project can play a role in such a complex environment. The comparison of uplift and settlement data at different levels shows that in addition to the influence of geological conditions and construction, environmental factors, the support scheme of the project can play a certain role in a complex environment, and the effect of a multi-support combination scheme of the project is better.
Figure 8 shows the normalized relationship between the surface uplift δv/He behind the wall and the distance d/He from the wall, where He is the final excavation depth. As shown in Figure 8A, there are differences in surface subsidence modes in different partitions. Areas A, B, and C exhibit triangular distributions, area D exhibits a trapezoidal distribution, and the influence range is small. The main reason for such differences is that the existing structure has large stiffness and small ductility, and the structural deformation is consistent within a certain range (Wang et al., 2021c), so when d/He ≤ 2.0, there are many large uplifts in area D. At the same time, in this interval, the uplift of partitions A, B, and C is prominent, which is the main influence area, while the uplift of partitions B and C is more obvious and the influence range is wider than that of partition A. This is because the A partition is at the end and Ae is small, and the spatial effect is prominent.
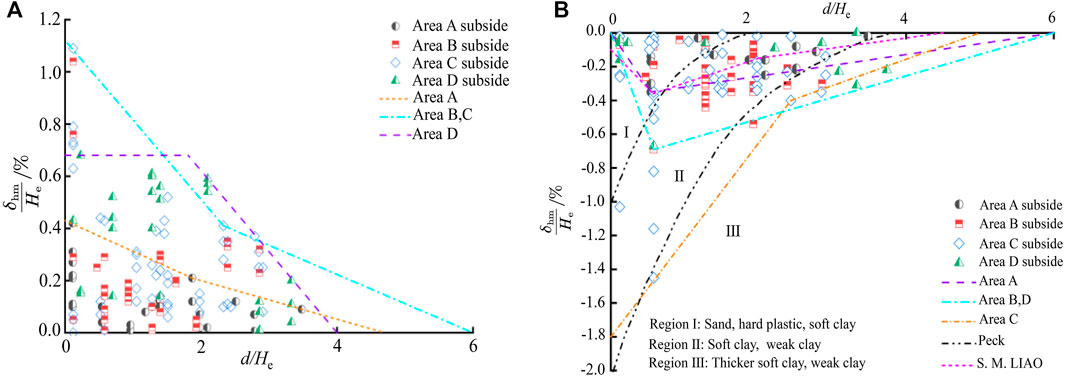
FIGURE 8. Surface uplift morphology behind the wall. (A) Surface uplift form behind the wall. (B) Surface subsidence form behind the wall.
Figure 8B shows that the surface subsidence of this project mainly occurs in areas I and II proposed by Peck (1969), and a small number of measuring points are located in area III. The surface settlement patterns of different partitions are also different. Partitions A, B, and D exhibit groove-shaped distributions, which is different from the groove-shaped settlement mentioned by Hsieh and OU (1998). The groove starting point of this project is at the top of the wall. This is mainly due to the uplift above Vqd of this project. The wall uplift drives the upward displacement of the soil behind the wall, and the surface settlement near the diaphragm wall is small. Area C exhibits a triangular distribution, mainly the open-cut side of the wall side shift, and the surface behind the wall is mostly settled. Similar to the uplift shape of area A, the settlement range of area A is limited, and the settlement is small. Compared with the surface settlement prediction curve of the foundation pit of a metro station in Suzhou given by Liao et al. (2015), the surface settlement of the project is larger and the influence range is wider, mainly because the site soil is weak, the construction environment is complex, and the deformation control is more severe.
To further explore the influence of the lateral movement of the diaphragm wall on the surface uplift and subsidence, Figure 9 gives the relationship curve between δhm and δvm. The maximum uplift of the surface is between 0.12δhm and 1.13δhm, with an average of 0.47δhm. When δhm ≥ 25 mm, the maximum uplift of the surface gradually decreases and mostly occurs in the C area. The maximum surface subsidence is between −0.22δhm and −3.11δhm, with an average of −0.66δhm. This is close to the lower boundary of δvm/δhm calculated by Wang et al. (2011) and the upper boundary of δvm/δhm calculated by Liao et al. (2015). For δhm ≤ 35 mm, the maximum surface subsidence is less than 10 mm; for δhm ≥ 35 mm, there is only a small increase in the C area. The maximum ground uplift and subsidence values in areas A, B, and D are small and concentrated within δhm ≤ 20 mm, which are mainly affected by Ae. The vertical spacing of the support is small, and the stiffness of the retaining structure is high, resulting in a small environmental disturbance.
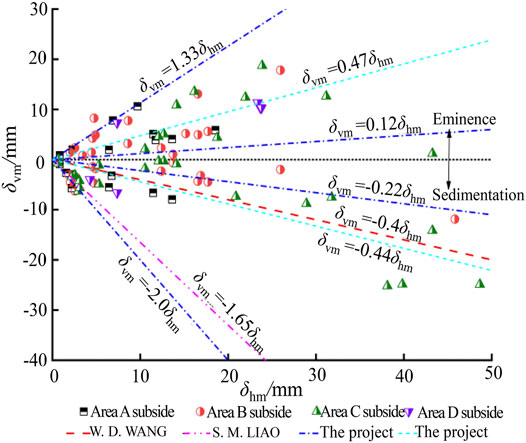
FIGURE 9. Relationship between δhm and δvm.
Analysis of Heave and Subsidence of Adjacent Buildings
The settlement of the surrounding buildings is mainly caused by uneven settlement of the surface (Xie et al., 2020). Figure 10 shows the circumferential settlement curve of typical buildings on both sides of the foundation pit. Under working condition 6, the pit edge structure shows a settlement trend, with an average decrease of approximately 5 mm. As He increases, the building deformation varies with the distance d from the pit. The building settlement basically decreases with the increase of the distance from the foundation pit (Wang et al., 2021). The side near the foundation pit of JZ2 is mostly characterized by settlement, and the back side is mostly characterized by uplift. There is a displacement difference at both ends of the bottom plate, which makes the structure produce a counterclockwise deformation trend, but the maximum uplift settlement difference is less than 15 mm, indicating that the engineering enclosure system can play a better role. The d value of JZ6 is large, and the vertical deformation difference between the adjacent foundation pit side and the deviated side is small.
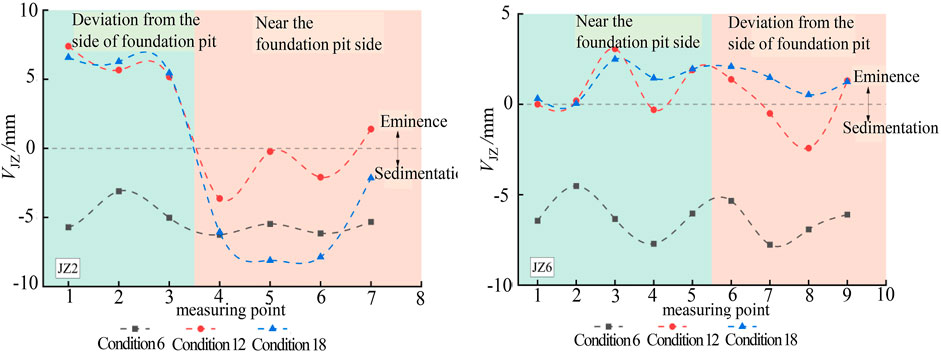
FIGURE 10. Building heave curve.
Figure 11 further illustrates the influence of the d value on the deformation of pit-side buildings. Under the given ground and heave mode in the figure, with increasing d, the building angle changes from clockwise to counterclockwise and then to counterclockwise. The greater the deformation of adjacent buildings caused during construction, the smaller the safety margin of buildings in subsequent links, which should be paid attention to (Cui et al., 2021). Therefore, building deformation can be predicted by observing surface heave and D value, and corresponding measures can be taken to reduce the impact of deformation.
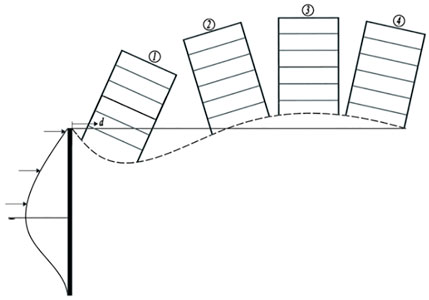
FIGURE 11. Collapse form of adjacent buildings.
Analysis of Apparent Earth Pressure
Using the method proposed by Terzaghi and Peck, 1967, the earth pressure acting on the ground connecting wall is inversely calculated by the support axial force, the maximum axial force of each support in the excavation process is selected, and the internal force of the diagonal brace is decomposed into forces in both vertical and horizontal directions to obtain the AEP of the foundation pit, as shown in Figure 12. There is little difference in AEP in each zone. Since the first support in area C is flush with the ground, the upper active earth pressure is slightly higher.
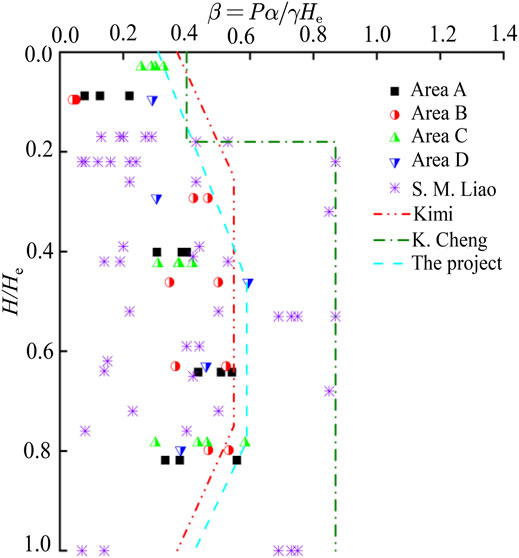
FIGURE 12. Apparent earth pressure envelope of the foundation pit.
The envelope peak of AEP in this case is 0.59γHe, located in (0.47∼0.78) He, and decreases to 0.43γHe with increasing excavation depth. As the site soil of the project includes sandy soil and cohesive soil, the AEP distribution model proposed by Terzaghi and Peck (1967) for a single soil is not applicable to this case. Using the calculation scheme proposed by Kim et al. (2021) and Liu (2018), the peak value of the AEP envelope is 0.55γHe, which is close to the AEP peak axial force and can better predict the AEP distribution of many types of soil surfaces. In addition, Figure 18 shows the AEP of the foundation pit of a metro station in Suzhou according to Liao et al. (2015) for comparison. The AEP peak value of the project is small, and the distribution is concentrated. Different from the triangular or trapezoidal AEP envelope, the AEP envelope with a linear distribution along the depth proposed by Cheng et al. (2021) and Liu et al. (2019b) can better explain the distribution mode of earth pressure behind the foundation pit wall of stations in Suzhou.
Conclusion
Based on a deep foundation pit project in Suzhou with three support schemes, this paper compares the published measured data-related projects in soft soil areas, analyzes the deformation behavior of deep foundation pits and the surrounding environment under various support schemes, and draws the following conclusions:
1) The deformation of the foundation pit is greatly affected by the spatial effect, and the existing station has an inhibitory effect on the deformation of the foundation pit. Benefiting from the combination of various support schemes, the maximum deflection of the diaphragm wall is 0.28% He, and the average deflection is 0.10% He. The Hm of the diaphragm wall is mainly located at (He −7, He + 12.5). Hm is affected by the stiffness of the retaining structure. When the stiffness of the retaining structure is insufficient, Hm occurs farther below the excavated surface.
2) The vertical deformation of the diaphragm wall is affected by many factors, especially sensitive to the excavation depth. Below He, due to the unloading effect of the foundation pit, the influence of excavation exposure time, and site soil conditions. Vqd is dominated by uplift, which is large in the middle and small at both ends. The range of Vqd is (−0.08∼0.26%) He, and the average value is 0.09% He.
3) Affected by the displacement of the diaphragm wall to the outside of the pit and the upward displacement of the wall top, the surface is uplifted, and the maximum uplift is (0.02∼0.14%) He, between 0.12δhm and 1.13δhm. As δhm exceeds 25 mm, the maximum uplift of the surface gradually decreases. The maximum surface subsidence is (−0.01% ∼ −0.15%) He, between −0.22δhm and −3.11δhm.
4) The uplift form of the surrounding buildings is mainly affected by the surface settlement mode and d value. Within a certain range of d values, there is an uplift difference between the adjacent foundation pit side and the opposite side of the pit side. The adjacent side is mostly characterized by settlement, and the opposite side is mostly characterized by uplift. Building deformation can be predicted by observing the surface subsidence and d value.
5) The peak value of the AEP envelope is 0.59γHe, which lies within (0.47∼0.78) He. The AEP calculation scheme proposed by Kim et al. (2021) can be used to predict the AEP distribution mode of many types of soil. The AEP envelope distribution model given by Cheng et al. (2021) can interpret the AEP distribution model of the station foundation pit in Suzhou.
Data Availability Statement
The original contributions presented in the study are included in the article/Supplementary Material, and further inquiries can be directed to the corresponding author.
Author Contributions
TY and SL designed research. YL collected data. HZ and YL analyzed the data. TY, SL, and XW wrote the article. All authors read and approved the final manuscript.
Funding
This work was supported by the Key Research and Development Project of Shaanxi Province (No. 2021SF-523).
Conflict of Interest
The authors declare that the research was conducted in the absence of any commercial or financial relationships that could be construed as a potential conflict of interest.
Publisher’s Note
All claims expressed in this article are solely those of the authors and do not necessarily represent those of their affiliated organizations, or those of the publisher, the editors, and the reviewers. Any product that may be evaluated in this article, or claim that may be made by its manufacturer, is not guaranteed or endorsed by the publisher.
Acknowledgments
We would like to thank AJE (www.aje.cn) for English language editing.
References
Cai, J. C., Xie, C., Zhao, S.-S., and Li, S. C. (2018). Multi-layer Supporting Method and Numerical Simulation for Deep Excavation under Complex Condition[J]. Eng. Mech. 35 (02), 188–194. (in Chinese). doi:10.6052/j.issn.1000-4750.2016.10.0792
Chen, H. H., Li, J. P., and Li, L. (2018). Performance of a Zoned Excavation by Bottom-Up Technique in Shanghai Soft Soils[J]. J. Geotechnical Geoenvironmental Eng. 144 (11), 05018003. doi:10.1061/(ASCE)GT.1943-5606.0001964
Cheng, K., Xu, R. Q., and Ying, H. W. (2021). Performance Analysis of a 30.2 M Deep-Large Excavation in Hangzhou Soft Clay[J]. Chin. J. Rock Mech. Eng. 40 (04), 851–863. doi:10.1016/j.tust.2021.103872 (in Chinese)
Cui, L., Liu, Y., Sheng, Q., and Xiao, P. (2021). Experimental Study on Mechanical Properties and Cracking Behaviors of T-Shaped Flaw-Contained Rock-like Materials under Cyclic Loading. Front. Earth Sci. 9, 938. doi:10.3389/feart.2021.768077
Ding, Z., Jin, J., and Han, T.-C. (2018). Analysis of the Zoning Excavation Monitoring Data of a Narrow and Deep Foundation Pit in a Soft Soil Area. J. Geophys. Eng. 15, 1231–1241. doi:10.1088/1742-2140/aaadd2
Ding, Z., Zhang, X., Wang, L. Z., and Jin, J. K. (2019). Measurement Analysis on Whole Excavation of Excavation and Deformation of Adjacent Metro Tunnel[J]. Rock Soil Mech. 40 (S1), 415–423. (in Chinese). doi:10.16285/j.rsm.2019.0190
Fan, J., Jiang, D., Liu, W., Wu, F., Chen, J., and Daemen, J. (2019). Discontinuous Fatigue of Salt Rock with Low-Stress Intervals. Int. J. Rock Mech. Mining Sci. 115 (3), 77–86. (in Chinese). doi:10.1016/j.ijrmms.2019.01.013
Fan, J., Liu, W., Jiang, D., Chen, J., Tiedeu, W. N., and Daemen, J. J. K. (2020). Time Interval Effect in Triaxial Discontinuous Cyclic Compression Tests and Simulations for the Residual Stress in Rock Salt. Rock Mech. Rock Eng. 53, 4061–4076. doi:10.1007/s00603-020-02150-y
Fu, X., Zhang, Z., Sheng, Q., Zhou, Y., Huang, J., Wu, Z., et al. (2021). Applications of an Innovative Strength Parameter Estimation Method of the SoilRock Mixture in Evaluating the Deposit Slope Stability under Rainfall. Front. Earth Sci. 9, 868. doi:10.3389/feart.2021.768757
Hsieh, P.-G., and Ou, C.-Y. (1998). Shape of Ground Surface Settlement Profiles Caused by Excavation. Can. Geotech. J. 35 (6), 1004–1017. doi:10.1139/t98-056
Jiang, D., Fan, J., Chen, J., Li, L., and Cui, Y. (2016). A Mechanism of Fatigue in Salt under Discontinuous Cycle Loading. Int. J. Rock Mech. Mining Sci. 86 (7), 255–260. (in Chinese). doi:10.1016/j.ijrmms.2016.05.004
Kang, Y., Fan, J., Jiang, D., and Li, Z. (2021). Influence of Geological and Environmental Factors on the Reconsolidation Behavior of fine Granular Salt. Nat. Resour. Res. 30 (1), 805–826. doi:10.1007/s11053-020-09732-1
Kim, B., Hong, K. H., and Kim, J. H. (2021). The Calculation Method of Apparent Earth Pressure in Multi-Layered Ground with Clay and Sand[J]. J. Korean Geosynthetics Soc. 20 (3), 21–34. doi:10.12814/jkgss.2021.20.1.021
Li, S., Huang, Z., Zhao, K., Xu, H., and Fang, Q. (2019). Comparative Analysis of Pit Deformation Characteristics in Typical Region Soft Soil Deposits of China. Arab J. Geosci. 12 (12), 1–11. doi:10.1007/s12517-019-4534-6
Li, X., Yang, S., Wang, Y., Nie, W., and Liu, Z. (2021). Macro-micro Response Characteristics of Surrounding Rock and Overlying Strata towards the Transition from Open-Pit to Underground Mining. Geofluids 2021, 1–18. doi:10.1155/2021/5582218
Liao, S. M., Wei, S. F., and Tan, Y. (2015). Field Performance of Large-Scale Deep Excavations in Suzhou[J]. Chin. J. Geotechnical Eng. 37 (03), 458–469. doi:10.11779/cjge201503009 (in Chinese)
Liu, B. (2018). Measurement And Analysis Of Deformation Of Adjacent Strata Super Deep And Large Excavations In Lujiazui District Of Shanghai[J]. Chinese J. Geotech. Eng. 40 (10), 1950–1958. doi:10.11779/CJGE201810024
Liu, H. C., Li, L. J., and Wang, C. L. (2012). Design and Deformation Control of Excavation Support Project Close to a Subway Station[J]. Chin. J. Geotechnical Eng. 34 (S1), 654–658. (in Chinese).
Liu, N. W., Chen, Y. T., and Gong, X. N. (2019a). Analysis of Deformation Characteristics of Excavation of Metro Station and Adjacent Buildings Induced by Deep Excavation in Soft Soil[J]. Rock Soil Mech. 40 (04), 1515–1525+1576. doi:10.16285/j.rsm.2018.0116 (in Chinese)
Liu, S. H., Yang, J. S., and Ge, H. R. (2019b). Mechanical and Deformation Characteristics of Erect Column Piles of Bias Excavation Excavated by Semi-covered Method[J]. J. Huazhong Univ. Sci. Tech. (Natural Sci. Edition) 47 (06), 86–91. doi:10.13245/j.hust.190616 (in Chinese)
Ma, B.-H., Hu, Z.-Y., Li, Z., Cai, K., Zhao, M.-H., He, C.-B., et al. (2020). Finite Difference Method for the One-Dimensional Non-linear Consolidation of Soft Ground under Uniform Load. Front. Earth Sci. 8, 111. doi:10.3389/feart.2020.00111
Peck, R. B. (1969). Deep Excavations & Tunneling in Soft Ground. State-of-the-art-report[C] Proc 7th Int Conf on Soil Mechanics and Foundation Engineering. Mexico: International Society for Soil mechanics and Geotechnical Engineering.
Terzaghi, K., and Peck, R. B. (1967). Soil Mechanics in Engineering practice[M]. 2nd ed. New York: Wiley.
Wang, G., Chen, W. H., Chen, W., Cao, L., Li, Y., Liu, S., et al. (2021a). Retaining Technology for Deep Foundation Pit Excavation Adjacent to High-Speed Railways Based on Deformation Control. Front. Earth Sci. 9, 916. doi:10.3389/feart.2021.735315
Wang, J., Wang, T., Song, Z., Zhang, Y., and Zhang, Q. (2021b). Improved Maxwell Model Describing the Whole Creep Process of Salt Rock and its Programming. Int. J. Appl. Mech. 13, 25. doi:10.1142/S1758825121501131
Wang, J., Wang, X., Zhang, Q., Song, Z., and Zhang, Y. (2021c). Dynamic Prediction Model for Surface Settlement of Horizontal Salt Rock Energy Storage. Energy 235, 121421. doi:10.1016/j.energy.2021.121421
Wang, J., Zhang, Q., Song, Z., and Zhang, Y. (2020). Creep Properties and Damage Constitutive Model of Salt Rock under Uniaxial Compression. Int. J. Damage Mech. 29 (6), 902–922. doi:10.1177/1056789519891768
Wang, J., Zhang, Q., Song, Z., Zhang, Y., and Liu, X. (2021d). Mechanical Properties and Damage Constitutive Model for Uniaxial Compression of Salt Rock at Different Loading Rates. Int. J. Damage Mech. 30 (5), 739–763. doi:10.1177/1056789520983868
Wang, J., Zhang, Q., Yin, W., Qi, S., Gao, D., and Ma, D. (2021e). On-Site Measurement on Compaction Characteristics of Coal Gangue and Surface Subsidence Disaster in Deep Backfilling Mining. Front. Earth Sci. 9. doi:10.3389/feart.2021.724476
Wang, W. D., Xu, Z. H., and Wang, J. H. (2011). Statistical Analysis of Characteristics of Ground Surface Settlement Caused by Deep Excavations in Shanghai Soft Soils[J]. Chin. J. Geotechnical Eng. 33 (11), 1659–1666. (in Chinese).
Wu, F. B., Jin, H., and Zhu, S. K. (2016). Ground Deformation Characteristics of Excavation Related to the Urban Rail Transit in Beijing[J]. Rock Soil Mech. 37 (04), 1066–1074. doi:10.16285/j.rsm.2016.04.020 (in Chinese)
Xiao, X., Li, M. G., and Chen, J. J. (2018). Vertical Deformation Mechanism of Diaphragm Wall Due to Unloading in Deep Excavation[J]. J. Shanghai Jiao Tong Univ. 52 (12), 1552–1558. doi:10.16183/j.cnki.jsjtu.2018.12.002 (in Chinese)
Xie, S., Lin, H., Chen, Y., Wang, Y., Cao, R., and Li, J. (2020). Statistical Damage Shear Constitutive Model of Rock Joints under Seepage Pressure. Front. Earth Sci. 8, 232. doi:10.3389/feart.2020.00232
Ying, H.-W., Cheng, K., Zhang, L.-S., Ou, C.-Y., and Yang, Y.-W. (2020). Evaluation of Excavation-Induced Movements through Case Histories in Hangzhou. Ec 37, 1993–2016. doi:10.1108/EC-06-2019-0256
Zeng, F. Y., Zhang, Z. J., Wang, J. H., and Li, M. G. (2018). Observed Performance of Two Adjacent and Concurrently Excavated Deep Excavations in Soft Clay[J]. J. Perform. Constructed Facil. 32 (4). doi:10.1061/(ASCE)CF.1943-5509.0001184
Zhang, Y. C., Yang, G. H., and Zhong, Z. H. (2012). Discussion on Some Key Problems in Soft Soil Excavation Design and Application Analysis of Design Examples[J]. Chin. J. Rock Mech. Eng. 31 (11), 2334–2343. (in Chinese).
Zhou, Y., Zhu, Q. H., and Zhu, Y. P. (2020). The Application Analysis of “Dual-purpose Pile” New Support Structure in a Deep Excavation[J]. Chin. J. Rock Mech. Eng. 39 (S1), 3168–3177. doi:10.13722/j.cnki.jrme.2019.0960 (in Chinese)
Zhu, Y. B., Zhou, X. H., and Wei, S. F. (2013). Investigation on Deformation Behaviors of Excavation Adjacent to Existing Metro Stations[J]. Rock Soil Mech. 34 (10), 2997–3002. doi:10.16285/j.rsm.2013.10.023 (in Chinese)
Keywords: multiple support scheme, existing subway, spatial effect, deformed characteristic, excavation engineering
Citation: Yang T, Liu S, Wang X, Zhao H, Liu Y and Li Y (2022) Analysis of the Deformation Law of Deep and Large Foundation Pits in Soft Soil Areas. Front. Earth Sci. 10:828354. doi: 10.3389/feart.2022.828354
Received: 03 December 2021; Accepted: 03 January 2022;
Published: 08 February 2022.
Edited by:
Junbao Wang, Xi’an University of Architecture and Technology, ChinaReviewed by:
Ren Songbo, Southwest University of Science and Technology, ChinaErgang Xiong, Chang’an University, China
Copyright © 2022 Yang, Liu, Wang, Zhao, Liu and Li. This is an open-access article distributed under the terms of the Creative Commons Attribution License (CC BY). The use, distribution or reproduction in other forums is permitted, provided the original author(s) and the copyright owner(s) are credited and that the original publication in this journal is cited, in accordance with accepted academic practice. No use, distribution or reproduction is permitted which does not comply with these terms.
*Correspondence: Tao Yang, yangtao@xpu.edu.cn