A Machine-Learning Based Tool for Diagnosing Inland Tropical Cyclone Maintenance or Intensification Events
 Andrew Michael Thomas
 James Marshall Shepherd
- Department of Geography, The University of Georgia, Athens, GA, United States
Tropical Cyclone Maintenance and Intensification (TCMI) is a generalized definition of tropical cyclones that strengthen or maintain intensity inland while maintaining tropical characteristics. Herein, a novel methodology, using a machine learning method was created to examine the tropical cyclone record to improve climatological representation of such cases. Using the International Best Track Archive for Climate Stewardship (IBTrACS) dataset, individual times of inland tropical cyclones were classified into TCMI and non-TCMI (weakening) events. The MERRA-2 dataset was applied to develop a prototypical machine-learning model to help diagnose future TCMI events. A list of possible TCMI storms for case studies in future analyses is provided. Two of these storms were examined for attributes characteristic of the Brown Ocean Effect, a hypothesized mechanism for TCMI centered on warm, moist soils. It was revealed that variables that were important at the time of storm arrival were important the prior day, which indicates that a TCMI event is a reaction to the environment. Moreover, the variables that were finally selected show a heavy emphasis on land-surface processes. This supports the idea that the accurate representation of the land surface state is critical to the accurate diagnosis of TCMI.
1 Introduction
After tropical cyclones (TCs) make landfall, it is often assumed that the wind speeds decay, and damage is reduced. There are two types of progression that an inland tropical cyclone may take: extratropical transition (ET; Keller et al., 2018; Jones et al., 2003; Evans et al., 2017) or dissipation (Kaplan and Demaria, 2001; Shen et al., 2002). One exception to this categorization is the observation that some TCs intensify or maintain intensity while inland, albeit not indefinitely (Andersen and Shepherd, 2014; Brauer et al., 2021). These events are called TC Maintenance or Intensification (TCMI) events by Andersen and Shepherd (2014; hereafter referred to as AS14). Unlike AS14, the central pressure criteria was not considered. Decreases in pressure could be without meaning if the environmental pressure, which IBTrACS does not record, decreases proportionally thereby sustaining the pressure gradient. Often, the “Brown Ocean” effect (BOE), which hypothesizes that enhancements in surface enthalpy fluxes induced by antecedent soil moisture support the TC, is attributed or associated. Examples of these events include, but are not limited to, Tropical Storm Erin (2007; Evans et al., 2011; Kellner et al., 2012; Monteverdi and Edwards 2010), Tropical Storm Bill (2015), and an unnamed Tropical Depression in 2010 (Nair et al., 2019). The BOE may be a factor in non-TCMI events, as the surface roughness may reduce the intensity. That is, despite the presence of soil moisture and enhanced latent heat fluxes, the surface wind is still constrained by the properties of the surface.
The number of TCMI events is not limited to these studies. Rather, those studies are only instances of the BOE. AS14 examined previous TCs to identify characteristics of TCMI events not found in ET events. AS14 considered the 1-month antecedent values of latent heat flux and supporting components. However, the immediate surface conditions have a large impact on the resulting structure of the TCs not just the environment of the previous month. In this study, the analysis will focus on the immediate environment of each location that TCMI events occurred and did not occur.
Section 2 describes the methodology used to identify TCMI events and describe a prototypical machine-learning model. Section 3 investigates the cross-validation of similar machine-learning models, as well as instances where the prediction and dataset do not match. Section 3 will also examine previously unexamined TCs. Section 4 explores potential uses of the machine-learning model, as well as potential pitfalls of the model.
2 Data and Methods
TC location and intensity data were obtained from the International Best Track Archive for Climate Stewardship dataset (IBTrACS; Knapp et al., 2010; Knapp et al., 2018). Of those TCs, only those that occurred since 1980 were considered as that is the limit of the Modern-Era Retrospective analysis for Research and Applications, Version 2 (MERRA-2; Gelaro et al., 2017), which was used for the environmental conditions. Of the variables in MERRA-2, only the Single level variables (SLV), surface flux variables (FLX), and land-surface variables (LND) were considered. Not only were the variables at the time of the strike considered, but the variables 24 h prior were used. However, variables that were physically more relevant to reintensifcation, were more commonly measured, or more relevant to reintensification were considered. For example, total column ozone, a SLV variable was not considered as it is possibly unphysically related to tropical cyclones. Neither the root zone water content, a LND variable, nor the areal fraction of anvil showers, a FLX variable were considered, as both are undefinable outside of the model setting or are unmeasured.
Each datum that occurred 350 km away from the coast was considered, similar to AS14. Unlike AS14, however, this study does not compare ET events with TCMI events but rather TCMI events and TCs that decay. As long as the datum and the following datum’s ‘nature’ were classified as a Tropical Storm or Disturbance, the datum was still categorized. The classification of the following datum is important as neglecting such a criterion may mean a miss-categorization of a TCMI storm as a TC undergoing ET. The change in the maximum wind speed (MUSD, or ‘usa_wind’ in IBTrACS) between the previous time and next time, a time span typically of 6 h, were calculated using centered differencing. If the MWSPD difference was greater than or equal to 0, the datum was classified as a TCMI event. If the MWSPD-change criteria was not met, the datum was classified as a non-TCMI event. If the datum occurred in the North Atlantic basin, it was used to test the developed machine-learning model. Otherwise, the datum was used to train the model coefficients. The data for TCMI and non-TCMI storms were consolidated by averaging the environmental variables of TCMI and non-TCMI events. This consolidation prevents the observational independence assumption of logistic regression models from being violated.
The function used to create the machine learning model was the “Logit,” a diminutive of logistic regression, function in statsmodels (Seabold and Perktold, 2010). Logistic regression fits a likelihood function for a binary variable to a multivariate logistic equation. Another possible description for logistic regression is an estimate of the probability of a binary event by identifying the coefficients of a multivariate linear equation functionally composed within a logistic function. The statsmodels function allows for the statistical model to be trained, applied, and provides the contribution of each variable to the equation along with a statistical description of the fitness of the regression. Candidate machine-learning models were developed iteratively going through sets of unmatched, potentially relevant variables to identify independent candidate variables for a final prototype machine-learning model, which was initialized as an empty set. Then the accuracy of each variable pair for both the test and training dataset was evaluated and stored under the condition that the variance inflation factor (VIF) was less than or equal to 10 (O’Brien, 2007). If a variable in the variable pair is included in the candidate variables, it is excluded for the test.
Afterwards, the most accurate candidate machine-learning models were selected. The accuracy metric utilized is the average of the Peirce Skill Score (Peirce, 1884; Manzato, 2007) between the test and training dataset subtracted by the absolute difference, with the same process applied to the Clayton Skill Score. Optimizing the combined Peirce Skill Score with a difference penalty produced reasonable values of other skill scores with minimal difference between the testing and training datasets. The subtraction of the absolute difference is to penalize overfitting of the training dataset. The most frequent variable that was shown in the most accurate candidate machine-learning models was used to train the next iteration of candidate machine-learning models, though the variable was excluded if the most frequent variable appeared previously in the set of candidate variables. The exclusion of a candidate variable may not always indicate that the machine-learning model is necessarily less accurate but may be a result of a reduction in the VIF. After the Peirce Skill Score was optimized, variables with a p-value greater than 0.6 were removed.
While the prototypical machine-learning model may be useful for identifying TCMI events, it is not without flaw. On a dynamic note, the machine-learning model does not account for external influences, including localized intensification due to surface features, or horizontal influences. For example, Cyclone Kelvin (2018) has been shown to have maintained a warm core (Shepherd et al., 2021) over land but was more influenced by the horizontal advection of moisture rather than the BOE (Yoo et al., 2020). This may be the reason that the prototypical machine-learning model missed the TCMI of Kelvin. Along a similar line, this prototypical machine-learning model does not include extratropical cyclones, which derive energy from baroclinicity (Evans et al., 2017; Keller et al., 2018). Intensification due to the influence of surface features and topography (Miller et al., 2013; Coch, 2020) are also not considered.
The criteria allowed for a small number of non-North Atlantic storms 93) and an even smaller number of North Atlantic TCs 65) so the amount of data used to train and test the machine-learning model is very limited. Of those limited number of TCs, there were 40 TCs in the North Atlantic basin and a total of 20 TCs in other basins that were counted as both non-TCMI and TCMI cyclones. This may mean that more stringent criteria for discriminating between TCMI and non-TCMI events, beyond wind speed, may be necessary. Other choices, such as excluding subtropical cyclones, is open for critique. One criteria for TCs to be consideration that may be relaxed is the 350 km buffer from the coast, suggested by Andersen and Shepherd (2014), which excluded TCs such as Hurricane Gaston (2004; Franklin et al., 2006) and Tropical Storm Helene (2000; Franklin et al., 2001) from being considered. The spatial criteria also does not prevent the TC under consideration from being influenced by the oceanic environment (Yoo et al., 2020).
3 Results
3.1 Statistical Model
Table 1 provides a summary of the final statistical model. Variables ending with the suffix ‘Prev’ refer to variables from 24 h prior. For reference, the equation for a logistic regression model is
where
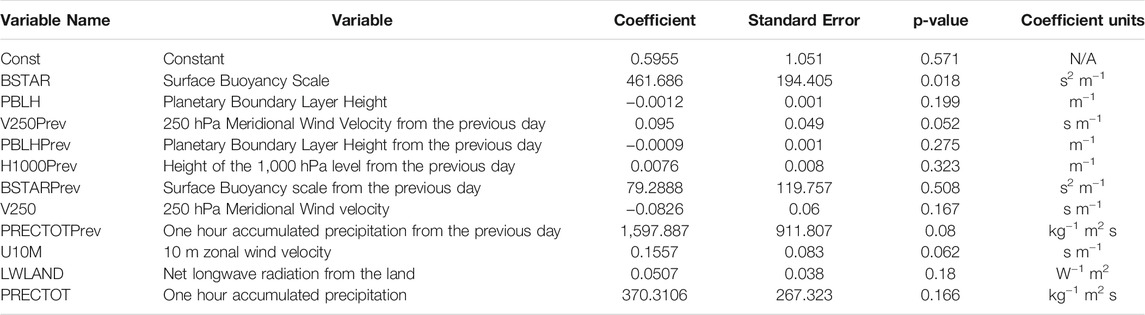
TABLE 1. Description of the machine-learning model and the constituent coefficients.
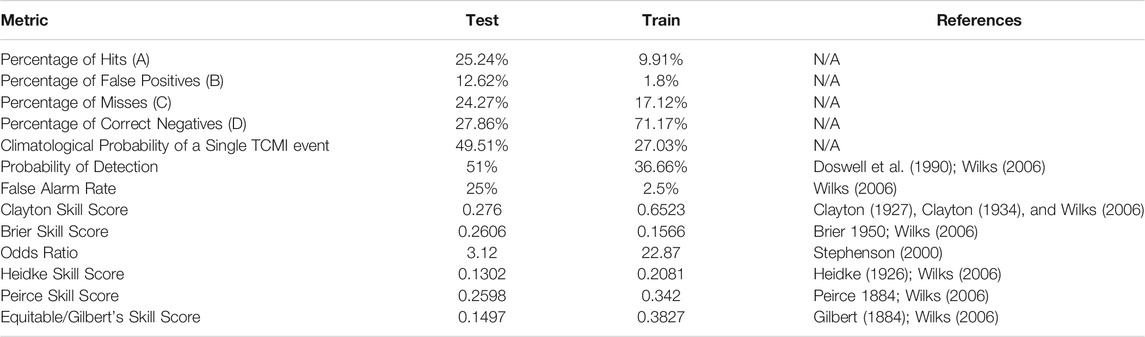
TABLE 2. Contingency Analysis and Brier Score of the machine-learning model on the test dataset and training dataset.
A positive coefficient indicates that the variable has a tendency towards promoting a TCMI event, while a negative coefficient is indicative of a reduction in the likelihood to a TCMI event. The positive coefficient with buoyancy scale (BSTAR) is indicative of the influence of the WISHE mechanism on the occurrence of TCMI events. The coefficient associated with the previous day’s accumulated precipitation (PRECTOTPrev) indicates recently wetted soil, which may be promoting the BOE. The coefficient associated with the planetary boundary layer height at the analysis (PBLH) implies that less turbulent mixing increases the probability of a TCMI event. The meaning of the opposite sign between the coefficients associated with the previous day’s meridional wind and the meridional wind at the analysis time is unknown, but there may be some level of bias within the wind variables, based on the gradient wind balance and TCs in opposite hemispheres. The decrease in the coefficient with height for the previous day’s meridional wind with height (V500Prev and V250Prev) can be reinterpreted as the positive contribution of the mean wind and the negative contribution of the shear.
3.2 Verification Composite
Figure 1 shows the sea level pressure (SLP) relative to the IBTrACS location averaged over the contingencies produced by the prototype machine-learning model. The centeredness is indicative that the TC position is represented well by MERRA-2. The central and environmental pressures are lower in the non-North Atlantic dataset than the testing dataset, indicating a systematic difference between the datasets. There are a couple of other systematic differences between the training and testing datasets. Another systematic difference is the roughness length (Figure 2), which is larger in the North Atlantic basin than in the other basins. It should be noted that in both datasets but particularly the training dataset, the number of constituent storms that had false positives is limited, which emphasizes individual storm characteristics. Cyclone Naomi 1993) and Cyclone Yasi (2011), which progressed over the sparsely vegetated Australian interior, were the only TCs that were false positives in the training dataset leading to a systematic difference in the roughness length. Both the systematic difference in SLP and Z0M lead to systematic differences in the maximum wind speed (SPEEDMAX; Figure 3). The average storm that underwent TCMI had a lower SPEEDMAX than the storms that did. The eastern maxima in SPEEDMAX is due to the compound effect of the translation velocity and gradient wind balance.
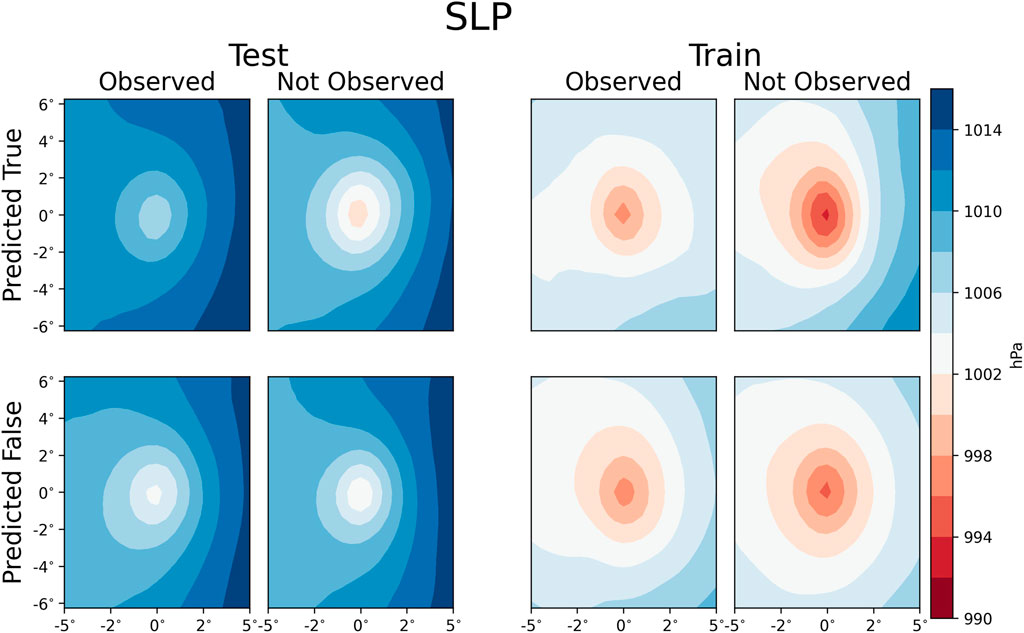
FIGURE 1. Composite mean sea level pressure (SLP) for all of the contingencies of the machine-learning model.
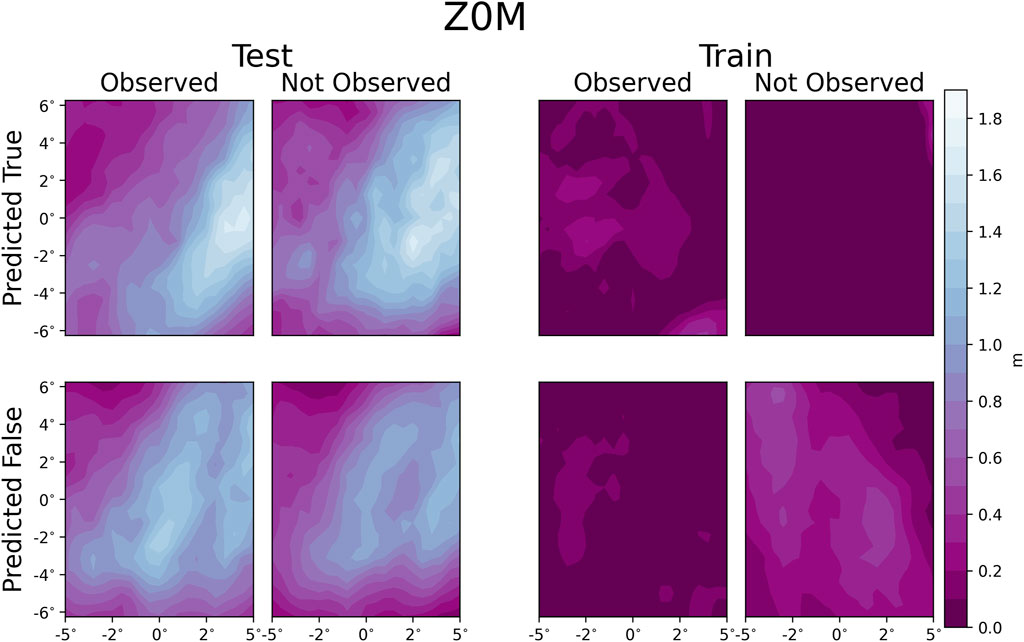
FIGURE 2. Composite mean of the aerodynamic roughness length (Z0M).
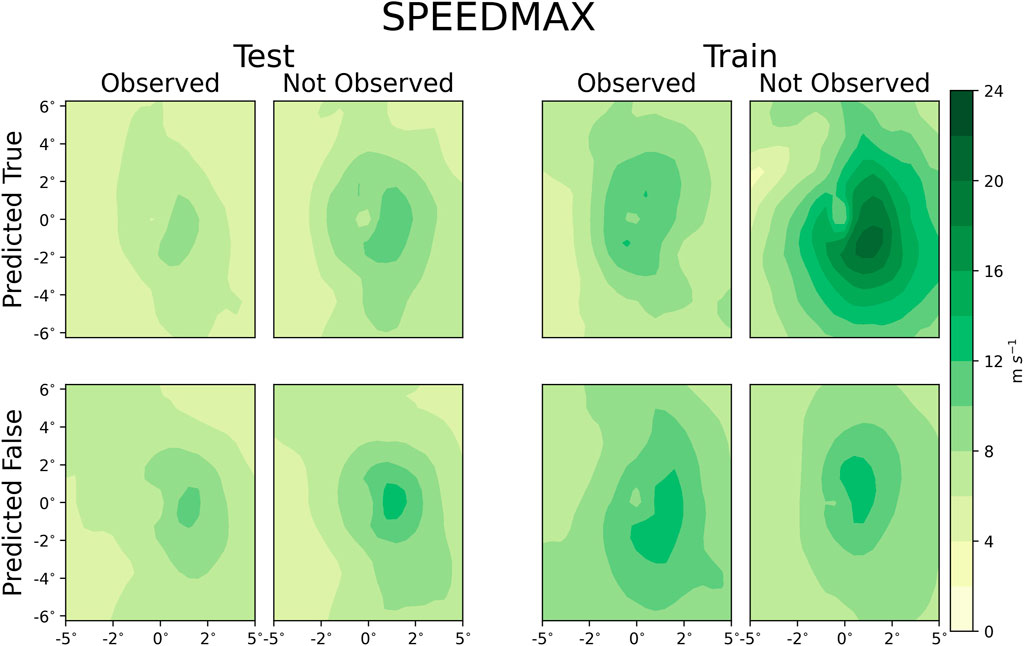
FIGURE 3. Composite mean of the maximum wind speed (SPEEDMAX).
Figure 4 shows the energy loss flux from interception (EVPINTR). For the testing dataset, the average EVPINTR is a good metric for determining inaccurate diagnoses, while it may improve the accuracy in the training dataset. However, including EVPINTR in the machine-learning model produced a larger p-value than the threshold. From a physical interpretation, EVPINTR is the amount of energy constrained to the surface by the presence of objects on the surface. EVPINTR disrupts the surface energy flux and reduces the buoyancy. This is seen in Figure 5, which shows BSTAR. BSTAR is one of the criteria variables within the machine-learning model that describes the role of the WISHE/BOE mechanism. In the testing dataset, the average BSTAR near the center of the TC is positive only in the hits. This is one way of discriminating between hits and false positives in the North Atlantic basin.
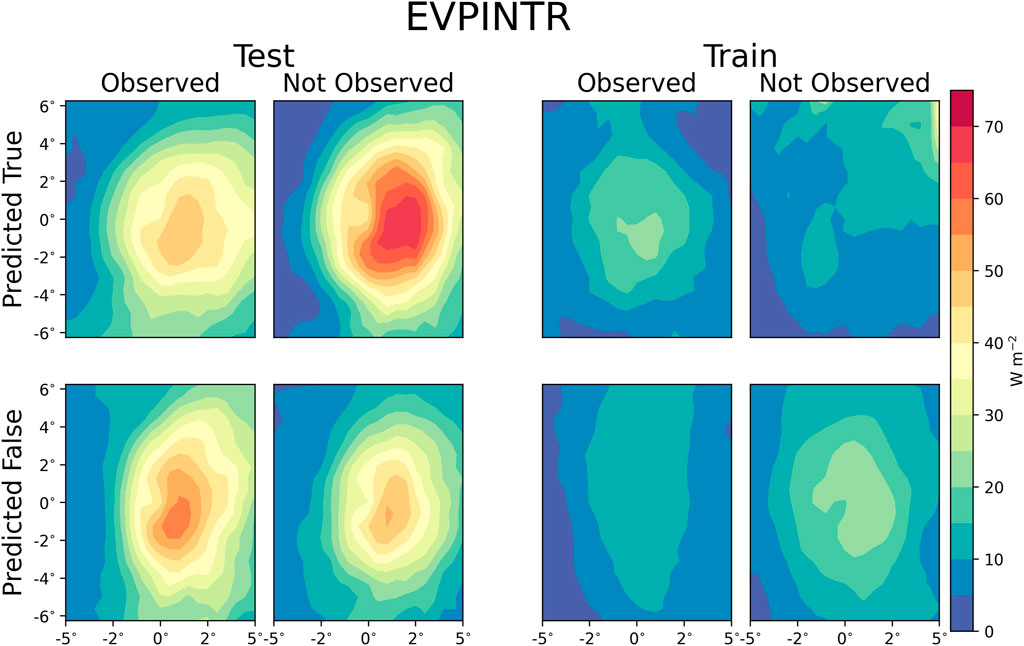
FIGURE 4. Composite mean of the energy loss flux by interception (EVPINTR).
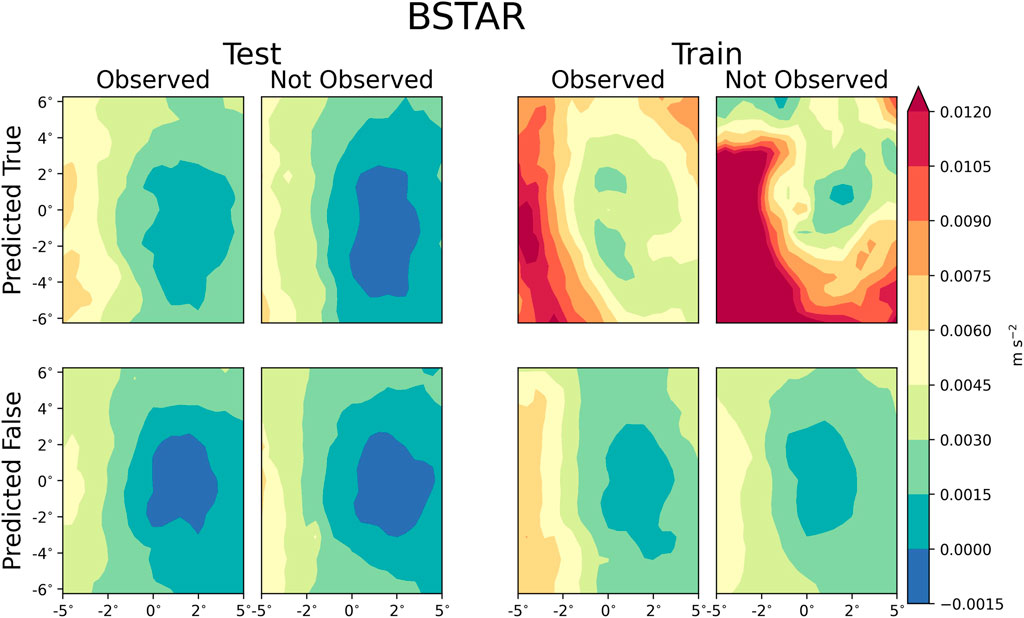
FIGURE 5. Composite mean of the surface buoyancy scale (BSTAR).
3.3 Event Analysis
3.3.1 Discussion
Figure 6 shows a geographical distribution of the machine-learning model performance on the testing dataset. The machine-learning model does not predict TCMI events in southern Mexico even though TCMI events do occur in that region. There are several identifiable storms that have and have not undergone TCMI. Specifically, Tropical Storms Erin (2007)and Bill (2015) are storms that were identified by the prototypical machine-learning model, which are published instances of the BOE (Evans et al., 2011; Kellner et al., 2012; Arndt et al., 2009; Brauer et al., 2021). Table 3 lists other storms that meet the TCMI classification. Below, we examine Tropical Storm Hermine (2010), which followed a similar path to Tropical Storms Erin and Bill, as well as Tropical Storm Dolly (2008), which eventually caused flooding in New Mexico.
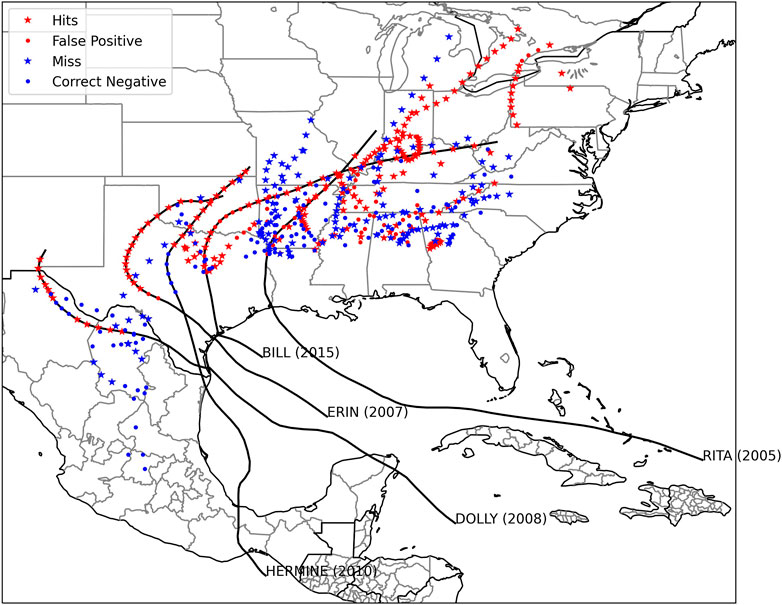
FIGURE 6. Map of the performance of the machine-learning model. Tropical Storms Bill (2015) and Erin (2007) have been identified as TCMI events, while Hurricane Dolly (2008)and Tropical Storm Hermine (2010)are described in the text.
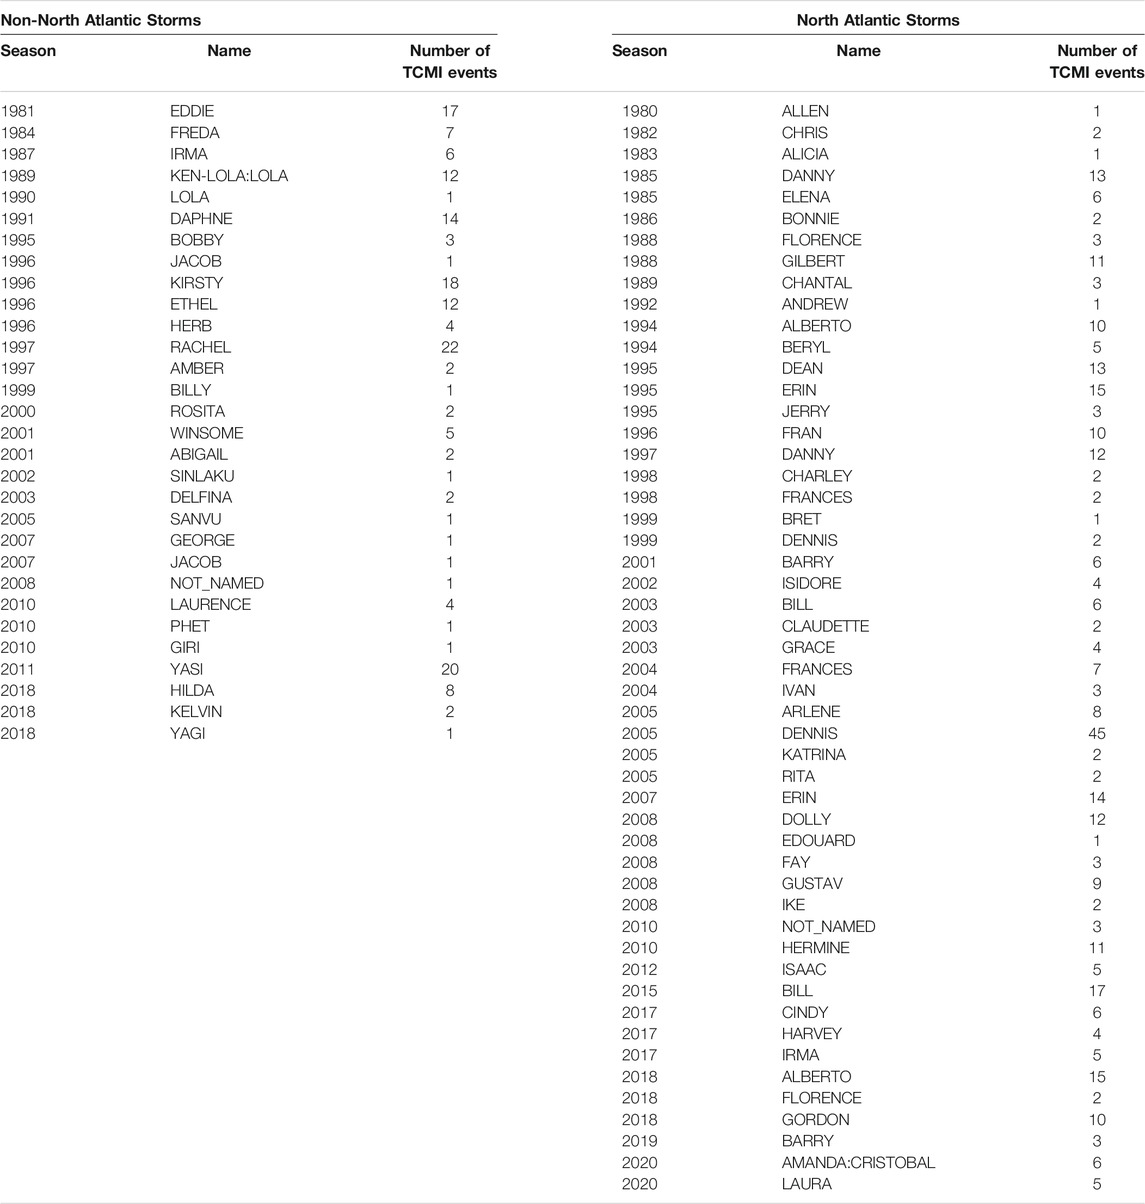
TABLE 3. Tropical cyclones that Underwent TCMI.
3.3.2 Hurricane Dolly (2008)
Hurricane Dolly (2008) was a hurricane that formed in the western Caribbean Sea on 20 July 2008. After experiencing two brief landfalls near Cancun, Mexico and South Padre Island, Dolly experienced a final landfall on Texas on 23 July 2008 at 2000 UTC. Figure 7 shows the trend in the intensity of Hurricane Dolly. After rapid weakening associated with landfall, Dolly experienced two periods of cyclone maintenance with the first period as a tropical depression and a constant wind speed of 25 kts for 20 h, and the second period as a low pressure with a constant wind speed of 20 kts for 24 h before dissipating. The first period had monotonically increasing pressure, while the pressure decreased two hPa over 12 h, but increased by six hPa over the next 12 h.
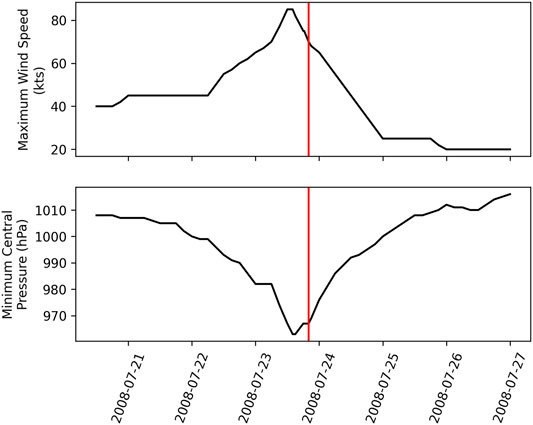
FIGURE 7. Maximum wind speed (top) and minimum central pressure (bottom) for Hurricane Dolly (2008). The red line depicts the final landfall.
But more than just the characteristic wind speed change, Dolly produced a secondary precipitation maxima (Figure 8) in New Mexico, leading to flash flooding and the death of one person and (National Weather Service (NWS) 2018a). It should be noted that widespread floods impacted New Mexico earlier that month, before Hurricane Dolly, which may qualify as a series of predecessor rain events (PRE; Bosart et al., 2012; Galarneau and Davis, 2013). This is supported by Figure 9, which shows the time averaged precipitation for the month, prior to final landfall. The machine-learning model did predict a TCMI event. The latent heat flux (shown in Figure 10) criteria of 70 W m−2 for the BOE, as suggested by AS14, was not sufficient evidence to predict the TCMI of Dolly, indicating that this tool is an improvement on previous criteria.
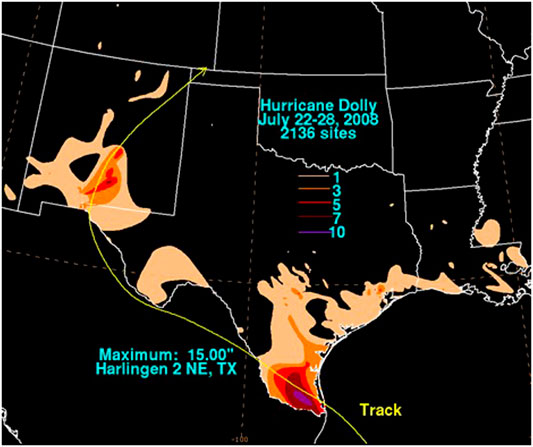
FIGURE 8. Rainfall associated with Hurricane Dolly in inches. Source: NOAA/NWS (https://www.wpc.ncep.noaa.gov/tropical/rain/dolly2008filledrainblk.gif).
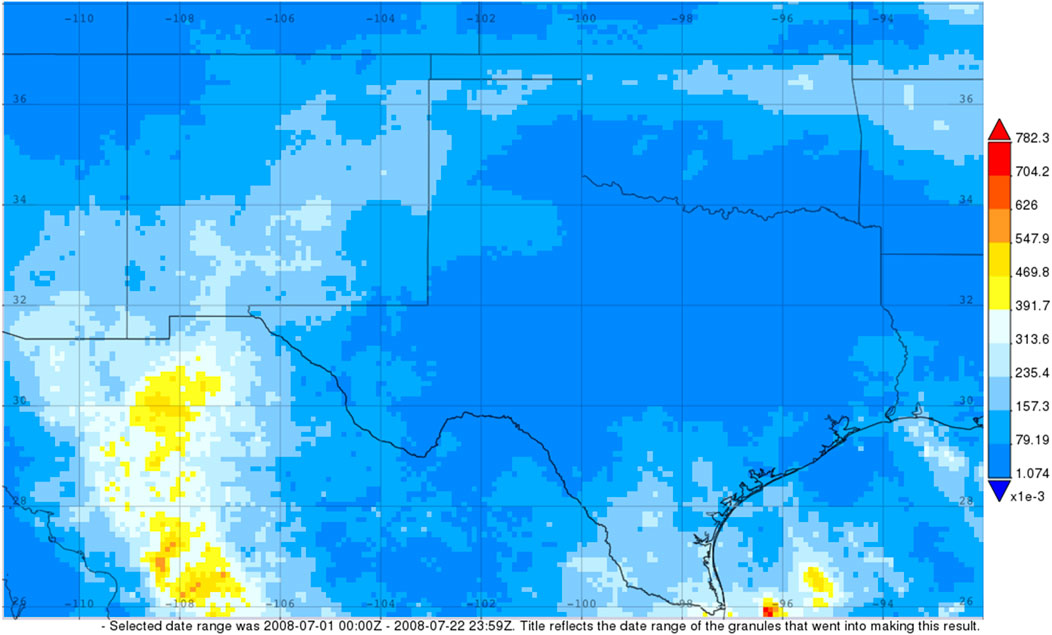
FIGURE 9. Time-averaged map of the final run of multi-satellite precipitation estimate with gauge calibration prior to the landfall of Hurricane Dolly (2008). Source: NASA Giovanni (Berrick et al., 2009; Acker and Leptoukh, 2007).
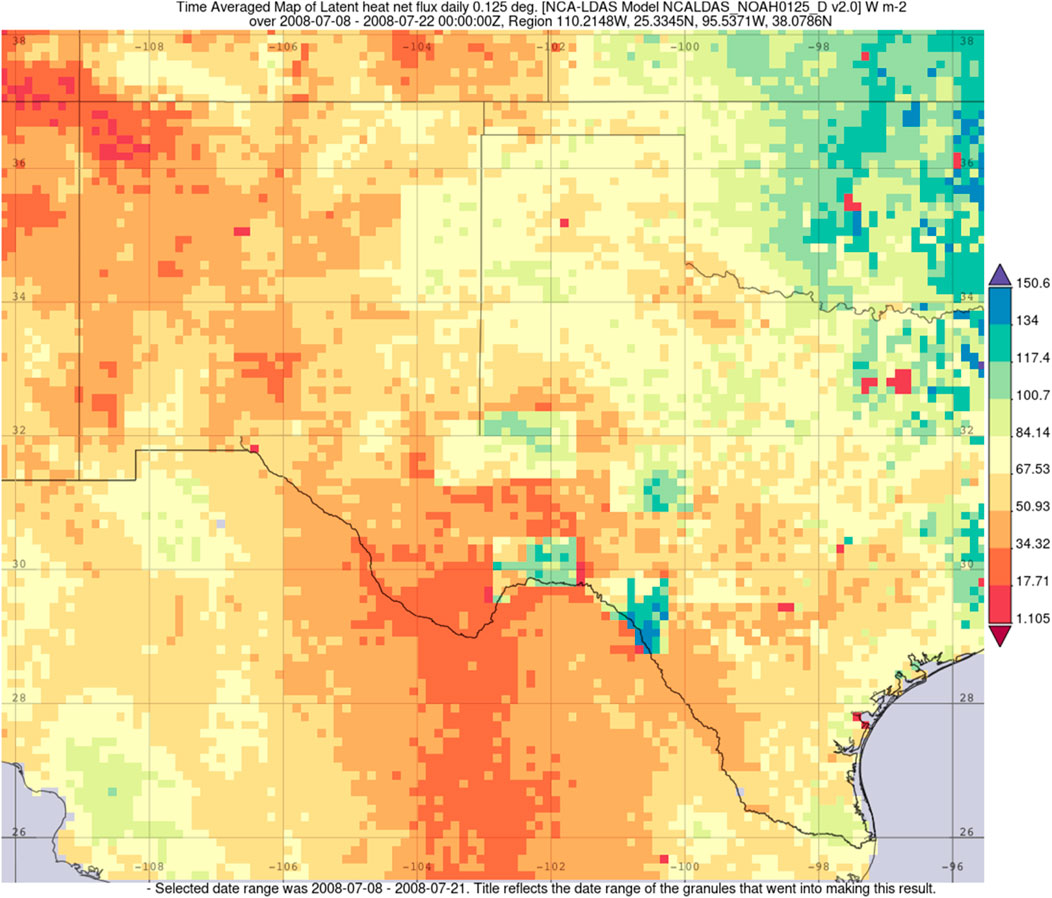
FIGURE 10. Two week averaged latent heat (W m−2) from the NCA-LDAS model prior to Hurricane Dolly. Source: NASA GIOVANNI.
3.3.3 Tropical Storm Hermine (2010)
Tropical Storm Hermine (2010) developed within the Bay of Campeche and traveled across to the Gulf of Mexico, making landfall in northeast Mexico at 0200 UTC on 7 September 2010 (Avila, 2010). While Hermine lasted only 64 h as a TC after landfall, 30 of those hours were as a tropical depression at a constant wind speed of 20 kts and a constant central pressure of 1,005 hPa. The maximum wind speed and minimum central pressure is summarized in Figure 11.
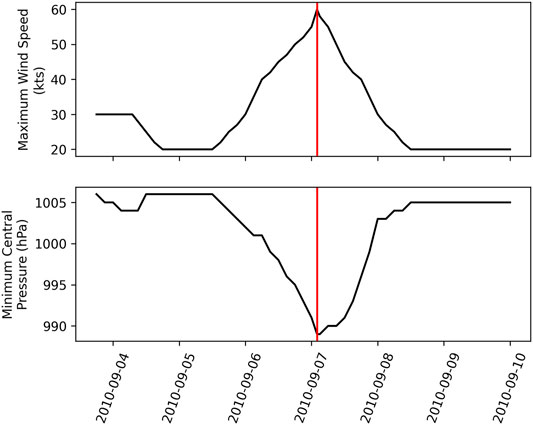
FIGURE 11. Maximum wind speed (top) and minimum central pressure (bottom) for Tropical Storm Hermine (2010). The red line depicts landfall.
Like Hurricane Dolly, Hermine produced an inland maxima in precipitation, as shown in Figure 12. Hermine was a significant precipitation event, despite it qualifying as a TCMI on the basis of the TC dynamics, as it was the only precipitation event for some areas in September 2010. A severe drought began afterwards (National Weather Service (NWS) 2018b). Despite the severe drought, the 2-week averaged latent heat flux, shown in Figure 13, was sufficient to produce a BOE storm. For reference, a 2 week average 40 W m−2 is the criteria value of for the BOE identified by Andersen et al. (2013).
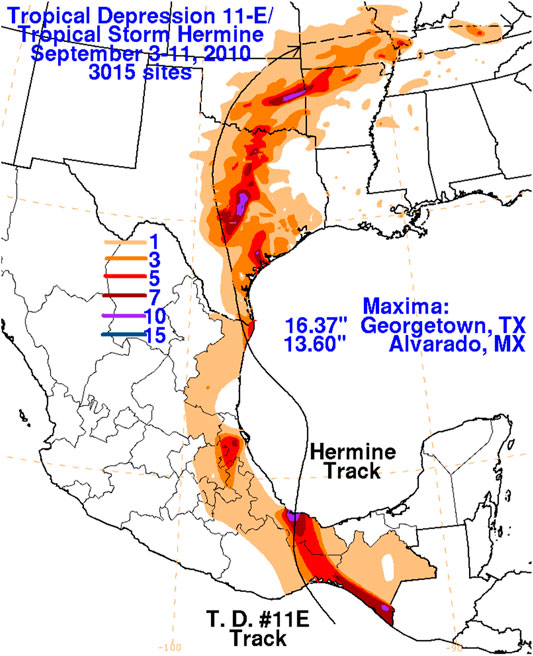
FIGURE 12. Rainfall associated with Tropical Storm Hermine (2010) in inches. Source: NOAA/NWS (https://www.wpc.ncep.noaa.gov/tropical/rain/hermine2010filledrainwhite.gif).
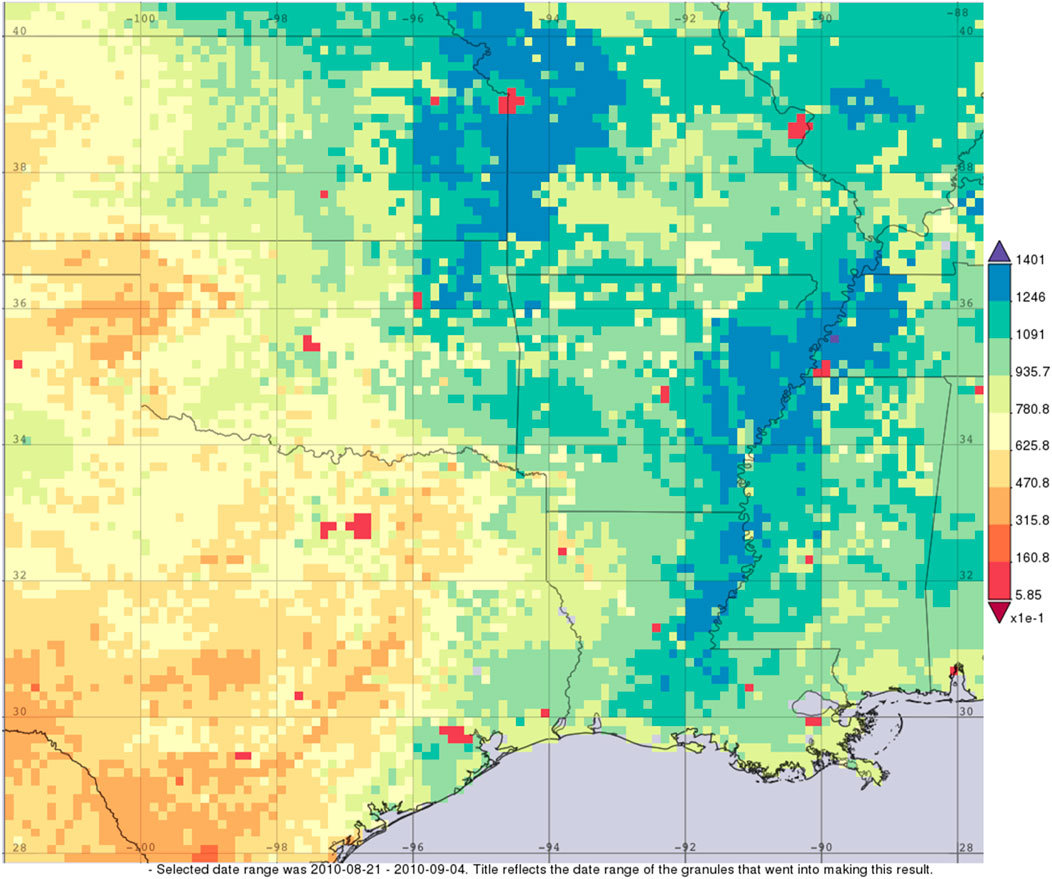
FIGURE 13. Time-averaged net latent heat flux from the NCA-LDAS model in W m−2. Source: NASA GIOVANNI.
4 Conclusion
A prototypical machine learning model has been developed with variables that were chosen to optimize accuracy rather than any given cause of TCMI. Some variables that were important at the time of storm arrival were important the prior day, which indicates that a TCMI event is a reaction to the environment, namely BSTAR, PBLH, V250, and PRECTOT. Moreover, the variables that were finally selected show a heavy emphasis on land-surface processes, which also indicates that proper modeling of air-land interactions are critical for modeling TCMI events. This supports the idea that the accurate representation of the land surface state is important for accurate diagnosis of TCMI.
One aspect of the final machine-learning prototype model that can be criticized is the inclusion of the wind components (U10M, V250, V250Prev). The machine-learning model was trained on data in both the Northern and Southern Hemisphere, respectively, indicating an opposing bias in each due to the opposite signed Coriolis force and opposing rotation. Moreover, the 1,000 hPa height from the previous day (H1000Prev) is included, even though it is often masked. However, developing the model without the masked variables still yields a similar subset of variables (including V250 and V250Prev) with similarly signed coefficients within the confidence interval of the original model, though with less accuracy. The role of the shifting meridional wind deserves more study. Moreover, the inclusion of meridional wind shift emphasizes the independence of variable selection without the perceived bias of the TCMI being caused exclusively by the BOE. To clarify, the variables in the final prototype model were chosen not out of preconceived notions of the causes of TCMI but as variables that improve the accuracy of the prototype machine-learning model. This means that variables that are instinctively examined for the BOE were not given priority (such as latent heat flux) but are heavily influenced by those variables.
5 Applicability and Future Use
What has been presented here is a usable prototypical machine-learning model that may diagnose the probability of a TCMI event based on reanalysis data. This probability forecast is effectively a conditional probability of a TCMI event given the inland onset of a TC. If given the probability that an area is to be struck by a hurricane at a given time, this diagnostic method can be applied to determine whether the TC decays or maintains strength/intensifies. This tool may be useful in diagnosing the occurrence of TCMI events in a future climate beyond the simple 70 W m−2 latent heat flux threshold suggested by AS14.
Possible future improvements to this statistical model include excluding weaker TCs as well as distinguishing between intensification and maintenance events. Identifying the BOE given a TCMI event through the use of Bayes’ Theorem is also a potential avenue of identifying specific TCs that underwent the BOE. Another potential improvement is the inclusion of surrounding grid cells or times but at the cost of additional computations and possibly decreasing the physical interpretability. While observations of rainfall are not included in the IBTrACS dataset, satellite observations of the precipitation rate in space may also be employed in to broaden the definition of TCMI beyond the dynamic criteria.
This study provides a list of candidate TCs to study for TCMI events (see Table 3). More TCs can be considered if the range of dates is expanded to the full selection rather than what is limited by MERRA-2 or if the spatial constraints are reduced. This provides a new set of TCs to be considered as BOE storms for study, instead of morbidly awaiting new TCMI events or questioning any new TC for the potential for the BOE. This study also indicates that, while the BOE is one specific and major cause of TCMI, it is not the only cause.
Data Availability Statement
Publicly available datasets were analyzed in this study. This data can be found here: https://www.ncei.noaa.gov/data/international-best-track-archive-for-climate-stewardship-ibtracs/v04r00/access/ https://goldsmr4.gesdisc.eosdis.nasa.gov/data/MERRA2/.
Author Contributions
AMT designed this as an intermediate step for an proposed project for the dissertation, which JMS oversaw. JMS suggested that this be published as new research. AMT made the technical decisions regarding model development, as well as provided the physical interpretation to the model. JMS provided the resources required for completion. AMT wrote the manuscript and JMS, in conjunction with the dissertation committee, suggested modifications to the manuscript. JMS also provided editorial suggestions.
Funding
This research was funded under the NASA Modeling, Analysis, and Prediction (MAP) program (16-MAP16-013) grant.
Conflict of Interest
The authors declare that the research was conducted in the absence of any commercial or financial relationships that could be construed as a potential conflict of interest.
Publisher’s Note
All claims expressed in this article are solely those of the authors and do not necessarily represent those of their affiliated organizations, or those of the publisher, the editors and the reviewers. Any product that may be evaluated in this article, or claim that may be made by its manufacturer, is not guaranteed or endorsed by the publisher.
Acknowledgments
The authors thank Dr. Gabriel Kooperman, Dr. John Knox, and Dr. Joseph Santanello for their contributions to an early version of the manuscript.
References
Acker, J. G., and Leptoukh, G. (2007). Online Analysis Enhances Use of NASA Earth Science Data. Washington D.C: Eos 88. doi:10.1029/2007EO020003
Andersen, T. K., Radcliffe, D. E., and Shepherd, J. M. (2013). Quantifying Surface Energy Fluxes in the Vicinity of Inland-Tracking Tropical Cyclones. J. Appl. Meteorol. Climatol. 52, 2797–2808. doi:10.1175/JAMC-D-13-035.1
Andersen, T. K., and Shepherd, J. M. (2014). A Global Spatiotemporal Analysis of Inland Tropical Cyclone Maintenance or Intensification. Int. J. Climatol 34, 391–402. doi:10.1002/joc.3693
Arndt, D. C., Basara, J. B., McPherson, R. A., Illston, B. G., McManus, G. D., and Demko, D. B. (2009). Observations of the Overland Reintensification of Tropical Storm Erin (2007). Bull. Am. Meteorol. Soc. 90, 1079–1094. doi:10.1175/2009BAMS2644.1
Avila, L. A. (2010). Tropical Cyclone Report Tropical Storm Hermine (AL102010). Available at: https://www.nhc.noaa.gov/data/tcr/AL102010_Hermine.pdf.
Berrick, S. W., Leptoukh, G., Farley, J. D., and Rui, H. (2009). Giovanni: A Web Service Workflow-Based Data Visualization and Analysis System. IEEE Trans. Geosci. Remote Sens. 47, 106–113. doi:10.1109/TGRS.2008.2003183
Bosart, L. F., Cordeira, J. M., Galarneau, T. J., Moore, B. J., and Archambault, H. M. (2012). An Analysis of Multiple Predecessor Rain Events Ahead of Tropical Cyclones Ike and Lowell: 10–15 September 2008. Mon. Weather Rev. 140, 1081–1107. doi:10.1175/MWR-D-11-00163.1
Brauer, N. S., Basara, J. B., Kirstetter, P. E., Wakefield, R. A., Homeyer, C. R., Yoo, J., et al. (2021). The Inland Maintenance and Re-intensification of Tropical Storm Bill (2015) Part 2: Precipitation Microphysics. J. Hydrometeorol. 22, 2695–2711. doi:10.1175/jhm-d-20-0151.1
Brier, G. W. (1950). Verification of Forecasts Expressed in Terms of Probability. Mon. Weather Rev. 78, 1–3. doi:10.1175/1520-0493(1950)078<0001:VOFEIT>2.0.CO;2
Clayton, H. H. (1927). A Method of Verifying Weather Forecasts. Bull. Am. Meteorol. Soc. 8, 144–146. Available at: http://www.jstor.org/stable/26262138.
Clayton, H. H. (1934). Rating Weather Forecasts. Bull. Am. Meteorol. Soc. 15, 279–283. doi:10.1175/1520-0477-15.12.279
Coch, N. K. (2020). Inland Damage from Hurricanes. J. Coastal Res. 36, 1093–1105. doi:10.2112/JCOASTRES-D-20A-00002.1
Doswell, C. A., Davies-Jones, R., and Keller, D. L. (1990). On Summary Measures of Skill in Rare Event Forecasting Based on Contingency Tables. Weather Forecast 5, 576–585. doi:10.1175/1520-0434(1990)005<0576:OSMOSI>2.0.CO;2
Evans, C., Schumacher, R. S., and Galarneau, T. J. (2011). Sensitivity in the Overland Reintensification of Tropical Cyclone Erin (2007) to Near-Surface Soil Moisture Characteristics. Mon. Weather Rev. 139, 3848–3870. doi:10.1175/2011mwr3593.1
Evans, C., Wood, K. M., Aberson, S. D., Archambault, H. M., Milrad, S. M., Bosart, L. F., et al. (2017). The Extratropical Transition of Tropical Cyclones. Part I: Cyclone Evolution and Direct Impacts. Mon. Wea. Rev. 145, 4317–4344. doi:10.1175/MWR-D-17-0027.1
Franklin, J. L., Avila, L. A., Beven, J. L., Lawrence, M. B., Pasch, R. J., and Stewart, S. R. (2001). Atlantic hurricane Season of 2000. Mon. Wea. Rev. 129, 3037–3056. doi:10.1175/1520-0493(2001)129<3037:ahso>2.0.co;2
Franklin, J. L., Pasch, R. J., Avila, L. A., Beven, J. L., Lawrence, M. B., Stewart, S. R., et al. (2006). Atlantic hurricane Season of 2004. Mon. Weather Rev. 134, 981–1025. doi:10.1175/MWR3096.1
Galarneau, T. J., and Davis, C. A. (2013). Diagnosing Forecast Errors in Tropical Cyclone Motion. Mon. Weather Rev. 141, 405–430. doi:10.1175/MWR-D-12-00071.1
Gelaro, R., McCarty, W., Suárez, M. J., Todling, R., Molod, A., Takacs, L., et al. (2017). The Modern-Era Retrospective Analysis for Research and Applications, Version 2 (MERRA-2). J. Clim. 30, 5419–5454. doi:10.1175/JCLI-D-16-0758.1
Gilbert, G. K. (1884). Finley’s Tornado Predictions. Am. Meteorol. Journal. A Mon. Rev. Meteorol. Allied Branches Study 1, 166. Available at: https://search.proquest.com/scholarly-journals/finleys-tornado-predictions/docview/124374084/se-2?accountid=14537.
Heidke, P. (1926). Berechnung des Erfolges und der Güte der Windstärkevorhersagen im Sturmwarnungsdienst. Geogr. Ann. 8, 301. doi:10.2307/519729
Jones, S. C., Harr, P. A., Abraham, J., Bosart, L. F., Bowyer, P. J., Evans, J. L., et al. (2003). The Extratropical Transition of Tropical Cyclones: Forecast Challenges, Current Understanding, and Future Directions. Wea. Forecast. 18, 1052–1092. doi:10.1175/1520-0434(2003)018<1052:tetotc>2.0.co;2
Kaplan, J., and Demaria, M. (2001). On the Decay of Tropical Cyclone Winds after Landfall in the New England Area. J. Appl. Meteorol. 40, 280–286. doi:10.1175/1520-0450(2001)040<0280:otdotc>2.0.co;2
Keller, J. H., Grams, C. M., Riemer, M., Archambault, H. M., Bosart, L., Doyle, J. D., et al. (2019). The Extratropical Transition of Tropical Cyclones. Part II: Interaction with the Midlatitude Flow, Downstream Impacts, and Implications for Predictability. Mon. Weather Rev. 147, 1077–1106. doi:10.1175/mwr-d-17-0329.1
Kellner, O., Niyogi, D., Lei, M., and Kumar, A. (2012). The Role of Anomalous Soil Moisture on the Inland Reintensification of Tropical Storm Erin (2007). Nat. Hazards 63, 1573–1600. doi:10.1007/s11069-011-9966-6
Knapp, K. R., Kruk, M. C., Levinson, D. H., Diamond, H. J., and Neumann, C. J. (2010). The International Best Track Archive for Climate Stewardship (IBTrACS). Bull. Amer. Meteorol. Soc. 91, 363–376. doi:10.1175/2009BAMS2755.1
Knapp, K. R., Kruk, M. C., Levinson, D. H., Diamond, H. J., and Neumann, C. J. (2018). International Best Track Archive for Climate Stewardship (IBTrACS) Project, Version 4. Accessed 02 January 2021. doi:10.25921/82ty-9e16
Manzato, A. (2007). A Note on the Maximum Peirce Skill Score. Weather Forecast. 22, 1148–1154. doi:10.1175/WAF1041.1
Miller, C., Gibbons, M., Beatty, K., and Boissonnade, A. (2013). Topographic Speed-Up Effects and Observed Roof Damage on Bermuda Following Hurricane Fabian (2003). Weather Forecast. 28, 159–174. doi:10.1175/WAF-D-12-00050.1
Monteverdi, J. P., and Edwards, R. (2010). The Redevelopment of a Warm-Core Structure in Erin: A Case of Inland Tropical Storm Formation. E-journal Sev. Storms Meteorol. 5, 1–18. Available from: http://ejssm.org/ojs/index.php/ejssm/article/viewArticle/65.
Nair, U. S., Rappin, E., Foshee, E., Smith, W., Pielke, R. A., Mahmood, R., et al. (2019). Influence of Land Cover and Soil Moisture Based Brown Ocean Effect on an Extreme Rainfall Event from a Louisiana Gulf Coast Tropical System. Sci. Rep. 9, 17136. doi:10.1038/s41598-019-53031-6
O’brien, R. M. (2007). A Caution Regarding Rules of Thumb for Variance Inflation Factors. Qual. Quant. 41, 673–690. doi:10.1007/s11135-006-9018-6
Peirce, C. S. (1884). The Numerical Measure of the success of Predictions. Science (80-) ns-4, 453–454. doi:10.1126/science.ns-4.93.453-a
Seabold, S., and Perktold, J. (2010). “Statsmodels: Econometric and Statistical Modeling with Python,” in Proceedings of the 9th Python in Science Conference, 92–96. doi:10.25080/majora-92bf1922-011
Shen, W., Ginis, I., and Tuleya, R. E. (2002). A Numerical Investigation of Land Surface Water on Landfalling Hurricanes. J. Atmos. Sci. 59, 789–802. doi:10.1175/1520-0469(2002)059<0789:aniols>2.0.co;2
Shepherd, M., Thomas, A., Santanello, J., Lawston, P. M., and Basara, J. (2021). Evidence of Warm Core Structure Maintenance over Land: A Case Study Analysis of Cyclone Kelvin. Environ. Res. Commun. 3, 045004. doi:10.1088/2515-7620/abf39a
Stephenson, D. B. (2000). Use of the “Odds Ratio” for Diagnosing Forecast Skill. Weather Forecast 15, 221–232. doi:10.1175/1520-0434(2000)015<0221:UOTORF>2.0.CO;2
Keywords: tropical-cyclones, TCMI, machine-learning, reanalysis, ibtracs
Citation: Thomas AM and Shepherd JM (2022) A Machine-Learning Based Tool for Diagnosing Inland Tropical Cyclone Maintenance or Intensification Events. Front. Earth Sci. 10:818671. doi: 10.3389/feart.2022.818671
Received: 19 November 2021; Accepted: 25 January 2022;
Published: 03 March 2022.
Edited by:
Qingqing Li, Nanjing University of Information Science and Technology, ChinaReviewed by:
Ernesto Dos Santos Caetano Neto, National Autonomous University of Mexico, MexicoEric Hendricks, National Center for Atmospheric Research (UCAR), United States
Copyright © 2022 Thomas and Shepherd. This is an open-access article distributed under the terms of the Creative Commons Attribution License (CC BY). The use, distribution or reproduction in other forums is permitted, provided the original author(s) and the copyright owner(s) are credited and that the original publication in this journal is cited, in accordance with accepted academic practice. No use, distribution or reproduction is permitted which does not comply with these terms.
*Correspondence: James Marshall Shepherd, marshgeo@uga.edu