Early Warning Method for Coal and Gas Outburst Prediction Based on Indexes of Deep Learning Model and Statistical Model
 Chong Wang
 Like Wei
 Haiyong Hu
 Jiren Wang
 Mengfeng Jiang
- 1College of Safety Science and Engineering, Liaoning Technical University, Liaoning Technical University, Fuxin, China
- 2Key Laboratory of Mine Thermodynamic Disasters and Control of Ministry of Education, Huludao, China
- 3Information Research Institute, Ministry of Emergency Management, Beijing, China
- 4College of Resource and Safety, Chongqing University, Chongqing, China
The early warning models for coal and gas outburst have become increasingly more important and have gained more attention in the mining industry in an effort to further improve mine safety. In the warning process, however, the theoretical models do not always work in a timely manner largely due to the delayed capture of the real time parameters. Based on the evolving mechanism of gas outburst, the gas emission is considered a dominant factor in this work because its data is attainable in real time and clearly characterizes the entire outburst process. In order to characterize and distinguish the variation of the gas emission during an outburst and normal mining activity, a total of four statistical methods were employed to quantify the variation of gas emission: the moving average, the deviation ratio, the dispersion ratio, and the fluctuation ratio. Also, the Root Mean Square Error (RMSE) and Mean Absolute Percentage Error (MAPE) are also included to demonstrate the accuracy of the deep learning model for predicting the variation of gas emission. Developed from these six indicators, the multi-factor fuzzy comprehensive evaluation model forms the outburst early warning system by calculating the combined index of the difference among the indicators. The accuracy of the early warning system is examined in the case study of the “3.25” gas outburst hazard in Shigang Coal Mine. The results show advantages of the comprehensive evaluation model established from the six characteristic indicators when predicting an outburst.
Introduction
In 2020, China’s coal consumption accounted for 56.8% of the domestic primary energy consumption (National Bureau of Statistics China, 2021). Before the carbon peak expected in 2030, coal energy will remain an important part of China’s energy consumption. There are many disaster factors in the process of coal mining. Among those, gas disasters are the “first killer” (Wang, 2018). After decades of research and hazard control in this field, for the first time, no major coalmine gas accident occurred in 2020 (a major gas accident refers more than 10 dead in an accident) (Wu et al., 2021). However, recent gas outburst accidents have been on the rise and have occurred more frequently in China. They include the gas outburst at Shanxi Shigang Coal Industry Company on March 25, 2021, the gas outburst in Dongfeng Coal Mine, Guizhou, April 9, 2021, the gas outburst at Sanbao Coal Mine, Guizhou, April 26, 2021, the gas outburst in the Sixth Mine of Henan Hebi Coal and Electricity Co., Ltd. on June 4, 2021, and the gas outburst in the shaft at Didaoshenghe Coal Mine, Heilongjiang, June 5, 2021.
Due to the continuous occurrence of these gas outburst accidents, scholars have paid more attention to the characteristics of gas accidents to find a method to predict them. The spatial-temporal distribution of the outburst accidents in China was further analyzed by using the statistical method (Wang E. Y. et al., 2020; Zhang et al., 2021). Some experts and scholars introduced the various disaster factors of gas outbursts into algorithms and models including the extreme learning machines (Han et al., 2019), the random forests (Long et al., 2021), the machine learning (Pu et al., 2019), the Neural Network (Xu and Cheng, 2021), the Grey Correlation Analysis (Yang and Zhou, 2021), etc. The correlation between the various factors to the gas disasters were analyzed to realize the disaster prediction. Some scholars used the engineering technology and geophysical methods to predict the dynamic disaster hazard, including the drill cuttings index method (Qi et al., 2021), the initial velocity of gas emission from drilling holes, the R index method (Wu, 2021), the acoustic emission method (Wang et al., 2018), the micro-seismic method (Song et al., 2021; Chen et al., 2022), the electromagnetic radiation method (Wang H. et al., 2020), etc. Based on the gas monitoring data, some other scholars utilized the data driven prediction algorithms, such as data mining (Long et al., 2020), the Gaussian process model (Li et al., 2021), the deep learning (Wang E. Y. et al., 2020) and the multi-parameter fusion (Du et al., 2021) for predicting the coal mine gas concentration. However, some influencing factors, including the real time seam gas content and gas pressure, cannot be obtained. The use of the drill cuttings method and the electromagnetic radiation method are easily affected by human activities and the underground geological environment. Therefore, the prediction results may show a certain degree of delay and also relatively larger errors.
In order to improve the accuracy of the gas outburst early warning model and to facilitate the real time on-site decision-making, the influencing factors in the model must be obtained in real time in the first place. Based on the evolving mechanism of gas outburst, the gas emission can be obtained in real time and also clearly characterizes the entire outburst process, which should be considered as a main factor. This paper employed four statistical methods including the moving average, the deviation ratio, the dispersion ratio, and the fluctuation ratio to quantify the variation of the gas emission. The Root Mean Square Error (RMSE) and the Mean Absolute Percentage Error (MAPE) were included in the model to demonstrate the accuracy of the deep learning model for predicting the variation of the gas emission. The outburst early warning system was then formed by calculating the combined index of the difference among the indicators. Based on the data of the real outburst accidents, the early warning results of this model were compared with the results of previous models. The research results showed important practical significance in improving the outburst early warning accuracy and ensuring the safety of production during the tunneling process.
Characteristic Analysis of Main Factors in the Process of Coal and Gas Outburst
Main Controlling Factors
Coal and gas outburst is an extremely complex coal-rock dynamic disaster that often occurs during the mining process in coalmines. It is a strong and complex dynamic process of gas-containing coal and rock fluids that instantly evolve in time and space. The outburst generates dynamic effects, which include releasing powerful energy, damaging mining equipment, and causing casualties. Secondary disasters such as gas explosions are not unusual, which seriously threatens the safety in the mine production (Wang W. et al., 2020). At present, experts and scholars generally believe that the coal and gas outburst is the result of the combined effects of stress, gas, and the physical and mechanical properties of the coal seam (Zhu et al., 2018). Coal and gas outburst is the dynamic evolving process of the coal seam including the energy accumulation, development, destruction and release. It can be divided into four phases including the evolution, formation, development and the termination (Luo et al., 2018). The evolution model of the coal and gas outburst is shown in Figure 1.
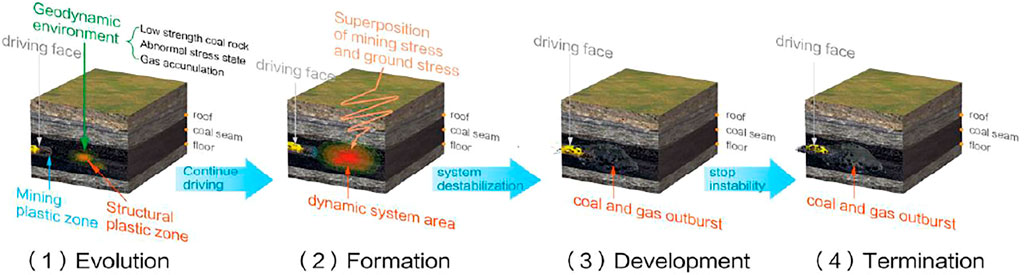
FIGURE 1. Evolution model of the coal and gas outburst.
Evolution Phase
In-situ stress is the dominant cause of an outburst. After the start of the mining operations, the load in the mining field is transferred to the coal wall, and the in-situ stress gradient of the coal wall increases and concentrates, raising the gas pressure. In addition, changes in the ground stress affect the internal structure of the coal seam, alter the preservation and movement of gas (Qin et al., 2021), and provide energy to the occurrence of the coal and rock dynamic disasters. At this stage, various outburst signs including the muffled thunder, the fluctuation of the gas concentration and the abnormal gas emission would appear in coal and rock masses.,
Formation Phase
The combined action of the in-situ stress and gas leads to the fracture and instability of the coal mass, promoting the development of an outburst. The pressure of the gas increases by several to over ten times. The coal mass expands and deforms when adsorbing the gas. A large amount of the adsorbed gas enters the desorption process and participates in the outburst. Gas expansion energy is the main energy source for a gas outburst (Lichtenberger, 2006). The elastic potential energy, the gas internal energy, and the gravitational potential energy of the unstable coal and rock masses break the unstable coal mass and throw it out in the space, forming small outburst holes (Hu et al., 2008).
Development Phase
When the external pressure drops suddenly, the higher pressure in the coal mass causes rapid gas release and resultant facture of coal mass. The gas storm with high gas pressure gradient moves the fractured coal mass (Wang, 2020). The development of the outburst depends on the physical and mechanical properties of the coal. A smooth outburst hole promotes the development of the outburst, while resistance in the hole prevents the outburst from developing.
Termination Phase
The pressure gradient of the ground stress and gas would sharply drop when the outburst energy gradually decays to a degree that hardly damages the coal mass or the outburst holes are blocked. Furthermore, the gas outburst would stop when the conditions for continuous damage and instability are not met.
In the evolution process of coal and gas outbursts, underground mining activities can destroy the original equilibrium of stress in the coal seam. In-situ stress affects the gas movement in the deep coal mass by controlling the porosity and permeability in the coal mass. The seam gas content surrounding the excavation face affects the distribution and gradient of the gas pressure. It also determines the gas emission quantity. The dynamic changing characteristics of the gas emission are affected and controlled by various factors such as the coal and rock mass stress, the gas pressure, the coal and rock permeability. All these factors contribute to the deformation and fracture of the coal mass. The pattern change is basically consistent with the hazard of the gas outburst.
In summary, the gas emission participates in the entire process of the coal and gas outburst. The parameter values can be calculated by the gas concentration, the wind speed, and the cross-sectional area of the tunnel. More importantly, the values can be obtained in a real time manner, as described in Eq. 1. Therefore, this parameter was selected as the main factor for in-depth analysis.
Where
According to Eq. 1, the gas emission is a function of the gas concentration, the wind speed, and the roadway cross-sectional area. By selecting the gas sensor data, the wind speed and the cross-sectional area of the tailgate, the analysis of the precursory characteristic law of gas outburst was carried out.
Choosing the Indicators for Coal and Gas Outburst Based on Statistics
In order to accurately analyze the variation characteristics of gas emission, this paper employed the moving average, the deviation ratio, the dispersion ratio, and the fluctuation ratio as the characteristic indicators for the dynamic change of the gas emission quantity.
Moving Average
The moving average is a series of averages on the gas emission quantity of different subsets in the full observing time period. It reflects the change trend of the gas emission quantity over time, indicating the dynamic engineering disturbance in the mining activity process, and the change of the gas emission quantity in a certain period of time (increasing, horizontal and declining). The trend is stable, which means it will continue for a period of time once established and will remain stable until external factors force it to change.
Where
Deviation Ratio
Deviation ratio is the value by which the real-time gas emission quantity deviates from the moving average in a period of time. It reflects the change pattern of gas emission quantity affected by the seam gas content, the gas pressure, the coal seam permeability coefficient, and other factors during that time.
Where
Dispersion Ratio
The dispersion rate reflects the dispersion degree of the gas emission data series, that is, the degree to which each value deviates from the mean value. Dispersion of the gas emission quantity in a certain subset of time period indicates the extent of the change of the gas emission.
Where
Fluctuation Ratio
The fluctuation ratio can describe the vibration amplitude of the sequence expressed by the amplitude variation ratio ROSC. This ratio means the relative rate of change between the gas emission quantity at the initial moment and the gas emission quantity at the end moment of a certain time interval Meanwhile, it reveals change times in the sequence as reflected by the frequency of change ROFC, meaning change times in the gas emission quantity within a certain time interval. The combination of these two aspects describes the actual situation of the gas emission quantity changes.
Where
Where
In a variety of coal mining and tunneling technology conditions, the gas emission from the normal coal mining face and tunneling face periodically fluctuates within a certain range. The moving average of the gas emission is a horizontal line that changes steadily. The curves of deviation ratio, the dispersion ratio, and the fluctuation ratio of gas emission quantity are relatively stable. When the gas emission quantity sharply increases or decreases, the moving average, deviation ratio, dispersion ratio, and fluctuation ratio of gas emission quantity exhibit abnormal changes.
Choosing the Indicators for Coal and Gas Outburst Based on Deep Learning
The Principle of Bidirectional LSTM Neural Network
Recurrent Neural Network (RNN) is a simple loop that repeats in the form of a chain. The schematic diagram of the structure is shown in Figure 2.
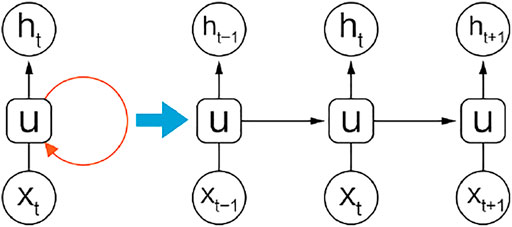
FIGURE 2. Principle of RNN algorithm model.
The RNN returns the output of the hidden layer to the input forming a cycle. When training RNN, as the input sequence samples increase, the partial derivative weight matrix of the loss function tends to zero or infinity, resulting in varnishing gradient problem or exploding gradient problem, which makes the RNN uncapable of dealing with the long-term dependence problem effectively. Long short-term memory (LSTM) is an optimized and improved recurrent neural network model that controls the proportion of information that needs to be retained or forgotten in the cell state Ct in the neural unit by adding three different “gate” structures (i.e., the input gate, the forget gate, and the output gate). The gate structure enables the LSTM with the long-term learning capabilities and solves the varnishing gradient problem and exploding gradient problem that RNN cannot solve.
Compared with RNN, LSTM shows certain advantages in dealing with the long-term dependence problems. However, it can only predict the state of the next moment based on the temporal information of the previous moment. In some problems, the output of the current moment is not only related to the state at the previous moment. It may also relate to the state in the future and as a result, there are still deficiencies in the actual application of the LSTM.
The bidirectional LSTM neural network (Bi-LSTM) can use past and future data information for learning. In other words, it can use the information from the upper memory as well as the lower memory to predict reservoir physical parameters, which remedies the LSTM’s shortcomings. Figure 3 is the schematic diagram showing the input layer, the forward layer, the backward layer, and the output layer from bottom to top. Of the two LSTM network layers with opposite information transfer directions, the forward LSTM layer can obtain the timing information of the previous moment, and the backward LSTM layer can obtain the timing information of the future moment. Consequently, the model can fully obtain the information of upper and lower memory from both the front and back directions to predict the current state and the model’s performance is therefore improved.
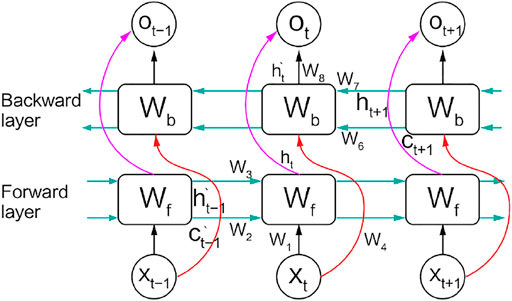
FIGURE 3. Principle of bidirectional LSTM algorithm model.
The Bi-LSTM model has 8 weights used in cycles at each moment: the weights of the input layer to the forward and backward hidden layers (w1, w4); the weights of the forward hidden layers (w2, w3); the weights of the backward hidden layers (w6, w7); the weight of the forward and backward hidden layers to the output layer (w5, w8). The formulas for the forward hidden layer
During the training of the network model, problems such as the insufficient training data sets, the sample uniformity, the excessive noise interference in the training data, or the model over complexity may arise, resulting in over-fitting. Aiming at the over-fitting problem of the bidirectional LSTM model in predicting with waveform data, the dropout mechanism is introduced to restrict the sparsity in the random region of the model (Cai et al., 2021). The dropout mechanism randomly discards a certain fraction of neural units from the network temporarily. The entire model training process is equivalent to training many different networks. The update of weights will not rely heavily on some features, and the network can be forced to learn more robust features. It not only prevents over-fitting, but also makes the model more generalized, thus improving the efficiency and accuracy of model training.
Choosing the Outburst Indicators Based on Deep Learning
RMSE and MAPE are used as indicators to measure the prediction accuracy of the model. RMSE and MAPE reflect the deviation between the predicted gas emission quantity and the actual quantity. A smaller value indicates better prediction accuracy, and vice versa. MAPE is more robust to outliers of the two, reflecting the overall prediction effectiveness of the model. Conversely, RMSE, emphasizes the influence of outliers on the prediction effectiveness of the model. Employing both can better evaluate the accuracy of the model’s prediction.
The calculation formulas are:
Where
Development of Early Warning System for Coal and Gas Outburst
The coal and gas outburst early warning index system is established from the dynamic characteristics of the gas emission quantity and the gas emission quantity prediction model based on the RNN. The criteria priority and member function are created with the fuzzy comprehensive early warning model and then the method for early warning of the coal and gas outbursts, based on the characteristics of the online monitoring gas emission quantity, is realized.
Determining the Severity of the Gas Emission Quantity Model Abnormality
This paper combines the analytic hierarchy process (AHP) with fuzzy theory to evaluate the probability of the coal and gas outburst.
Determining the Indicator Weights With AHP
I. The 1–9 scale method is used to construct the judgment matrix A, the principle eigenvalue λmax and the criteria priority vector w are then calculated.
II. Check the consistency of the judgment matrix. In order to test if the judgement criteria priorities are reasonable, the formula of the consistency ratio for the judgment matrix is used.
Where
Establishing the Fuzzy Comprehensive Early Warning Model
Fuzzy comprehensive evaluation contains three elements: the factor set, the evaluation set, and the single-factor evaluation. On the basis of single-factor evaluation, a multi-factor fuzzy comprehensive evaluation is carried out.
Building the Factor Set
The factor set U is a set of all the factors that affect the evaluation object, which can be expressed as U=(u1,u2,…,un). Among them, the element ui (i = 1,2,…,n) represent influencing factors. In this paper, the evaluation factor index set consists of two evaluation factors, i.e., the gas emission quantity variation characteristics and the gas prediction model output, which can be expressed as
Creating the Evaluation Set
The evaluation set is a set of possible evaluation results to the evaluation objects, which can be expressed as V=(v1,v2,…,vm), where the element vj (j = 1,2,…,m) indicates the result of the evaluation. The evaluation result set in this paper includes two kinds of results: outburst and no outburst, namely V = (outburst, no outburst).
Creating the Weight Set
The weight of each element in the factor set U is different to the evaluation, so each element ui should have a different weight wi according to its importance. W is a fuzzy set of the factor set U, which can be expressed as W = (w1, w2,…,wn). In this paper, since it has 2 factors in the factor set, the weight set is W = (w1,w2), and w1 + w2 = 1.
Single Factor Fuzzy Evaluation
The evaluation begins from one factor alone to determine the degree of membership of the evaluated object to the elements of the evaluation set. Suppose the object evaluated according to the ith factor ui in the factor set, and the degree of membership of the jth element vj in the evaluation set is rij, then the evaluation result can be expressed as Ri = (ri1,ri2,…, rim ), where Ri representing the single factor judgment set.
Fuzzy Comprehensive Evaluation
The multi-factor comprehensive evaluation (R evaluation matrix) is constructed from the single-factor evaluation sets, namely R = (R1,R2 )T. Using the weighted average model, according to the multiplication operation of the fuzzy matrix, we can obtain the fuzzy comprehensive evaluation set B given as
Where
The value of the fuzzy comprehensive evaluation set B is used to represent the comprehensive indicator of the differential individual indicator, based on the evaluation indicators RMSE and MAPE of the prediction model. The gas emission quantity dynamic change characteristic indicators are used for the evaluation and early warning for the coal and gas outburst. The data of gas emission during the normal production period of a coal mine are analyzed by using the difference comprehensive index. The maximum value of the calculation result is multiplied by the safety factor (1.2–1.5) to determine the early warning threshold. When the comprehensive indicator reaches the maximum value within the normal range, an orange alarm is given; when the comprehensive indicator approaches 1, it means that the probability of a coal and gas outburst is high and the red alarm is sent out.
Construction of Early Warning Model for Coal and Gas Outburst
This system continuously collects the gas concentration and the wind speed data from the sensors in the tailgate of the driving face. After removing the interference data, the value of gas emission quantity is calculated, then the moving average, the deviation ratio, the dispersion ratio, and the fluctuation ratio of the gas emission quantity change values are extracted as characteristic indicators. At the same time, the data collected during the normal excavation process in the past period of time is input into the Bi-LSTM neural network model for training and tuning, so that the model training error meets the predetermined requirements and the data model under normal production conditions is established. The newly collected data is then input into the model as the test data set to calculate the predicted value of the gas emission quantity and the loss value. The predicted gas emission quantity is combined with the characteristic indicators of gas emission quantity variation to form the early warning indicators for the coal and gas outburst. Next, the early warning indicators are used for the fuzzy comprehensive early warning model. By calculating the differential individual index, the threshold is determined and the evaluation and early warning of the risk level of coal and gas outburst is implemented. The construction of coal and gas outburst early warning model is shown in Figure 4.
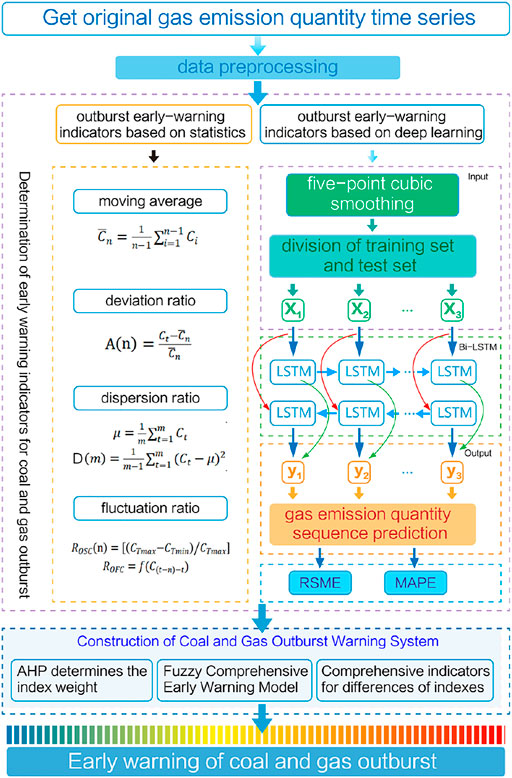
FIGURE 4. Construction of coal and gas outburst early warning model.
Application Result Analysis
Data Collection and Analysis
The national mine safety production risk monitoring and early warning system platform has collected the safety monitoring system data of all production and construction coal mines. The data includes information such as the sensor type, the sensor location, the real-time monitoring data value of the sensor and the collection time. The data is transmitted once a minute in a message queue. The platform data provides data support for the time series data analysis of this study.
In the first half of 2021, coal and gas outburst accidents occurred frequently. They provide copious data source for analysis in this work. There were three coal and gas outburst accidents occurred in this period, cost 20 lives.
I. At 3:51 a.m. 25 March 2021, outburst accident happened at the 15210 headentry in Huayang New Material Technology Group Co., Ltd., Shanxi Shigang Coal Industry Co., Ltd., causing four people died.
II. At 11:33 a.m. April 9, 2021, outburst accident happened at the open-off cut of 10901 headentry in Dongfeng Coal Mine, Guizhou, causing eight people died.
III. At 17:50 4 June 2021, outburst accident happened at the tailentry of the 3,002 excavation face in the No. 6 mine of Henan Hebi Coal and Electricity Co., Ltd. The accident caused eight deaths.
Based on gas emission quantity statistical indicators and the deep learning indicators, the early warning model in this work is used to analyze the data of Shigang coal mine for the research on early warning of coal and gas outburst. The accident occurred at the excavation face of 15210 headentry. The gate is a rectangular section with 3 m height and 5 m wide. The mining layout is shown in Figure 5. This work selects the gas concentration data and the wind speed data of 15210 headentry from the 2 months before the outburst for analysis. A total of 86,400 pieces of monitoring data were collected. On the whole, the gas emission quantity fluctuates with the progress of mining activities. About 4 days before the accident, the frequency of gas emission quantity fluctuations increased significantly, and the variation of gas emission quantity was abnormal This is a sign of coal and gas outbursts. Through the early warning model, the prediction of coal and gas outburst is realized.
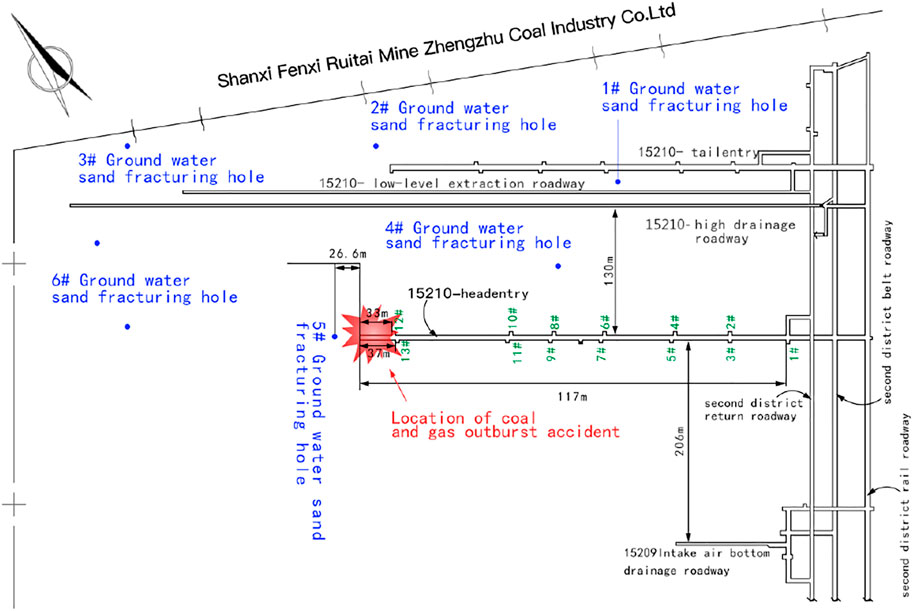
FIGURE 5. Layout of coal and gas outburst accident site.
The commonly used training strategies are adopted in deep learning to select the hyperparameters for the Bi-LSTM model. The initial value of the learning rate is set as 1e−4; the dropout set as 0.2 to suppress overfitting; the lag set at 16; the batch size set at 32; the frequency set at 8 the epoch set at 20; the number of nodes in the hidden layer set at 64; the optimization method selected is Adam.
On the 15210 headentry excavation face, the original monitoring data curve is shown in Figure 6. The involved manual calibrations were found in monitoring data collected by the gas sensors. The calibration would cause interruption to the continuity of the data, and the data manifests the abnormal increase. Therefore, this part of the data needs to be removed, which interpolated with the cubic spline curve. The overall gas emission quantity sequence is reduced noise with five-point cubic smoothing. The processed curve is shown in Figure 7:
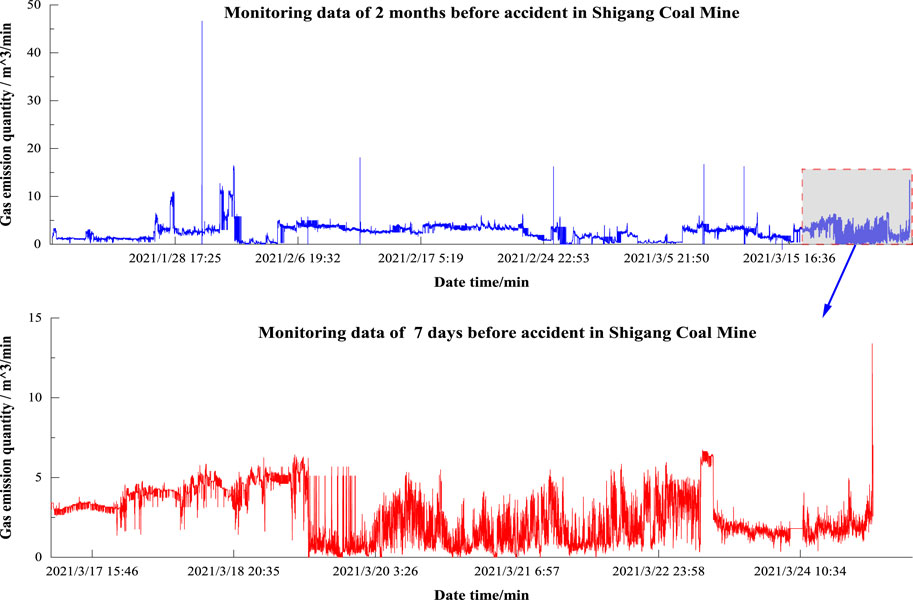
FIGURE 6. Pre-accident monitoring data in Shigang Coal Mine.
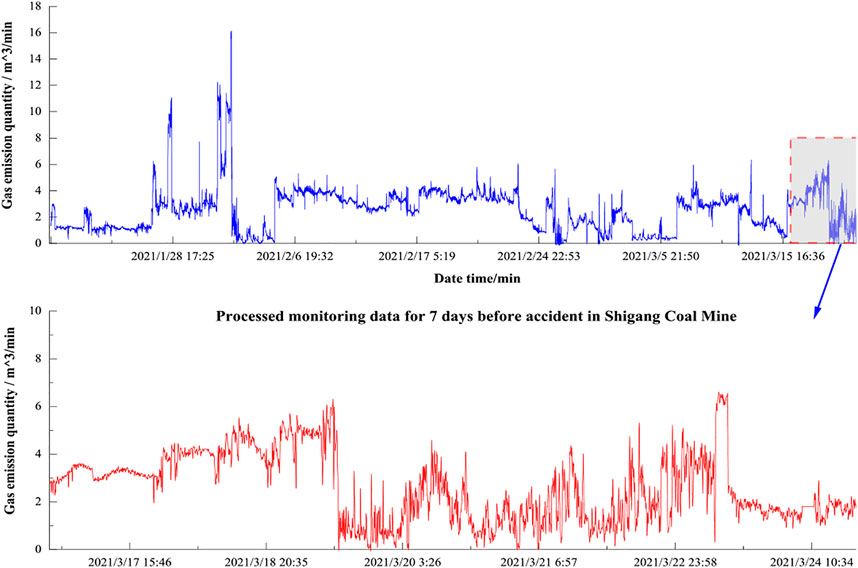
FIGURE 7. Processed monitoring data in Shigang Coal Mine.
This work selects the gas emission quantity data from 19 February to 20 March 2021 for the model training. Totally 43,200 pieces of data are divided into the training set and the test set at a ratio of 0.8. After the model was trained, the gas emission quantity data from 21 March to the moment before the accident was input into the model as a test set. The obtained loss values RSME and MAPE, combined with the moving average, the deviation, the dispersion and the volatility of gas emission time series can comprehensively reflect the abnormal changes of gas emission before the outburst accident.
Determination of Indicators Weights and Membership Functions
Based on the indicators change before the coal and gas outburst, the judgment matrix is constructed by the AHP to calculate indicators weights. Since the calculated C1 = 0.0123 < 0.1, the judgment matrix confirms that the result is acceptable. The weights of the indicators are shown in Table 1:
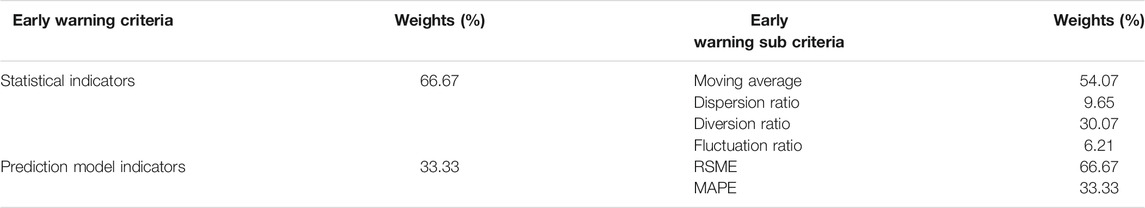
TABLE 1. Weights of all criteria and sub criteria.
According to the principle of determining the membership function, a large amount of the experimental data is used to determine the membership function of various indicators.
Ⅰ. Moving average: it is defined as the ratio of the real-time gas emission moving average to the previous period (1 h) gas emission average
Ⅱ. Deviation ratio, dispersion ratio: the value interval is divided by the ratio of the real-time deviation, dispersion and the average value of their respective calculation periods.
Ⅲ. Fluctuation ratio: the value interval for volatility is divided by the real-time volatility with its average in the calculation period. Then the larger value of the amplitude change rate and the frequency change rate was taken as the final value.
Ⅳ. RSME, MAPE: the value interval is divided by the ratio of the loss value of the predicted gas emission quantity before the real-time accident to the average value of the predicted loss of the gas emission quantity in the normal production.
Analysis of Changes in Indicators Before the Outburst Accident
For the “3.25” coal and gas outburst accident in Shigang Coal Mine, the gas emission monitoring data from 4 a.m. on 24 March to 4 a.m. on 25 March is collected to calculate the moving average, the deviation, the dispersion, the amplitude change and the variation frequency. The change law of the gas emission quantity change on the eve of the outburst accident is analyzed.
I. Moving average
The moving average is calculated using Eq. 2 during the 5-min periods. The gas emission quantity moving average curve is shown in Figure 8. According to the calculation results, it can be found that the gas emission variation is relatively stable from 24 to 12 h before the outburst accident. At 12 h before the outburst, the gas emission drastically changes with a patten of “suddenly large and suddenly small”. The moving average reaches the highest value of 4.95 m3/min at 4 h before the outburst, and then drops sharply. The gas emission begins to increase at 2 h before the outburst and reaches the peak value of 4.56 m3/min. Just before the outburst, the gas emission reaches the maximum value of 13.4 m3/min. Overall, the gas emission quantity presents a dynamic trend of “stable-rising-falling-rising”, which is similar to a “W” shape, with multiple peaks.
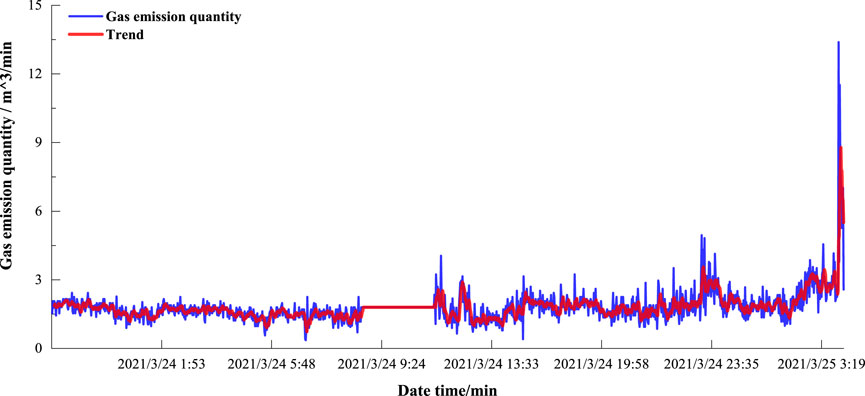
FIGURE 8. Gas emission quantity moving average curve.
Deviation Ratio
The deviation of the gas emission quantity sequence is calculated from Eq. 3 and the result of the moving average. The gas emission quantity deviation ratio curve is shown in Figure 9. According to the calculation results, it can be found that the deviation from 24 to 14 h before the outburst changes within the range of ±0.2. There is an abnormal value of 0.567 at 12 h before the outburst. The peak value of the gas emission quantity deviation is 0.866 just before the outburst. The “suddenly large and suddenly small” patten of changes in gas emission quantity leads to an overall increase of 2–3 times higher than the deviation rate at 24–14 h before the outburst.
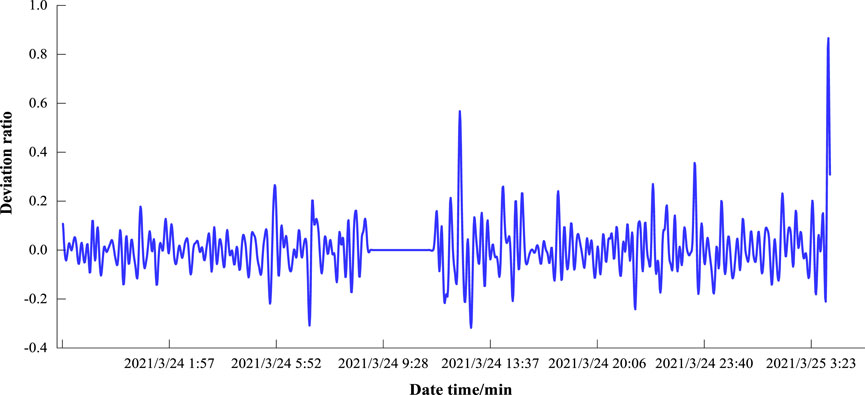
FIGURE 9. Gas emission quantity deviation ratio curve.
Dispersion ratio
The dispersion of the gas emission quantity sequence is calculated with Eq. 4. The time period is 10 min. The gas emission quantity dispersion ratio curve is shown in Figure 10. According to the calculation results, it can be found that the dispersion is at around 0.0007 from 24 to 14 h before the outburst. From 12 h before the outburst to the outburst time, the average value of the dispersion rate is 0.0023, an increase of 3 times. The peak value of the gas emission quantity dispersion is 0.132 just before the outburst. Abnormal changes in gas emission quantity leads to the increased dispersion.
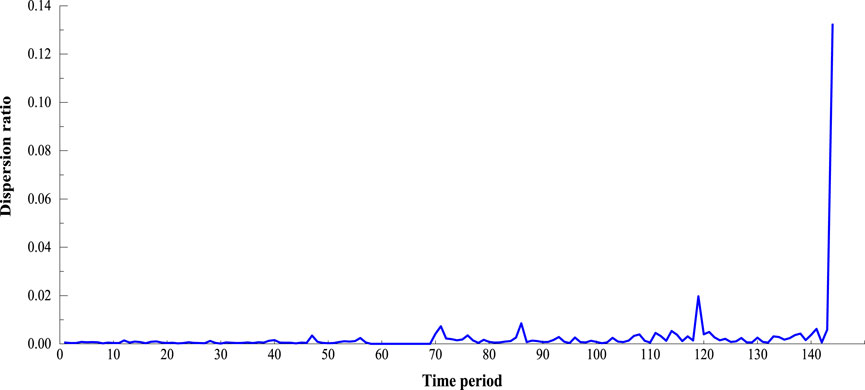
FIGURE 10. Gas emission quantity dispersion ratio curve.
Amplitude variation ratio
The amplitude variation ratio of the gas emission quantity sequence is calculated with Eq. 5. The time period is 10 min. The gas emission quantity amplitude variation ratio curve is shown in Figure 11. According to the calculation results, it can be found that the fluctuation range of the amplitude variation ratio from 24 to 14 h before the outburst accident is large, with an average value of 0.362. The peak value of the gas emission quantity amplitude variation ratio is 0.87 at 12 h before the outburst. It tends to be stable from 12 h before the outburst to the outburst time, with an average value of 0.474. From the data, the overall amplitude variation ratio before the outburst tends to be relatively frequent.
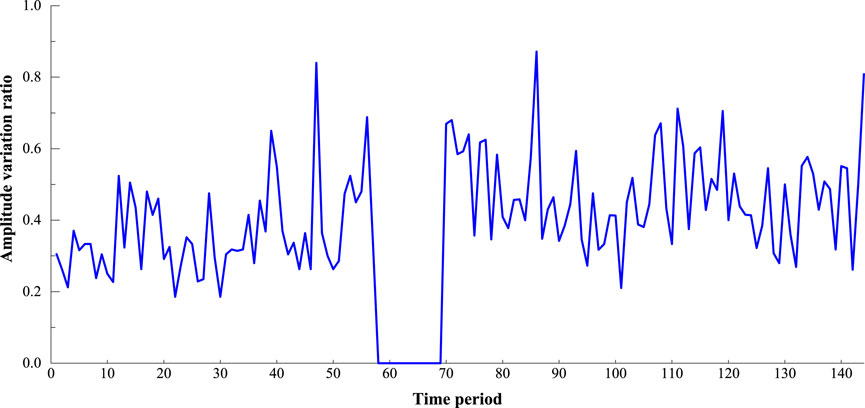
FIGURE 11. Gas emission quantity amplitude variation ratio curve.
Frequency of Change
The frequency of change of the gas emission quantity is calculated with Eq. 6. The time period is 10 min. The gas emission quantity frequency of change curve is shown in Figure 12. According to the calculation results, it can be found that the frequency of change from 24 h to 14 h before the outburst fluctuates around 7 times. The average of the frequency of change is about 8 times from 12 h before the outburst to the outburst time. Over time, the closer it is to the outburst time, the more frequent the changes. The frequency of change approaches 10 times.
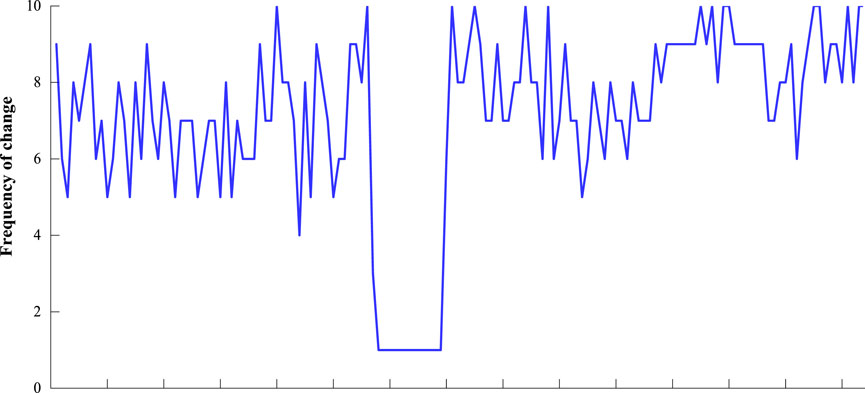
FIGURE 12. Gas emission quantity frequency of change curve.
The Bi-LSTM prediction model is used to simulate the normal production gas emission quantity sequence and the gas emission quantity sequence including the eve of the accident. The average RSME of normal production gas emission quantity sequence is 0.006, and the average MAPE is 2.274%. The prediction results are in good agreement with the actual value, indicating that the Bi-LSTM prediction model has high accuracy for the gas emission quantity sequence. The gas emission prediction curve in normal production is shown in Figure 13A. The average RSME of gas emission quantity sequence at the moment before the outburst is 0.023, and the average MAPE is 10.14%, which are 3.8 times and 4.5 times of the normal, respectively. The gas emission prediction curve before the accident is shown in Figure 13B. This indicates that abnormal changes in gas emission quantity before the outburst has led to a decrease in the accuracy of the model. The loss functions of the model could be used as the early warning indicators for the outburst.
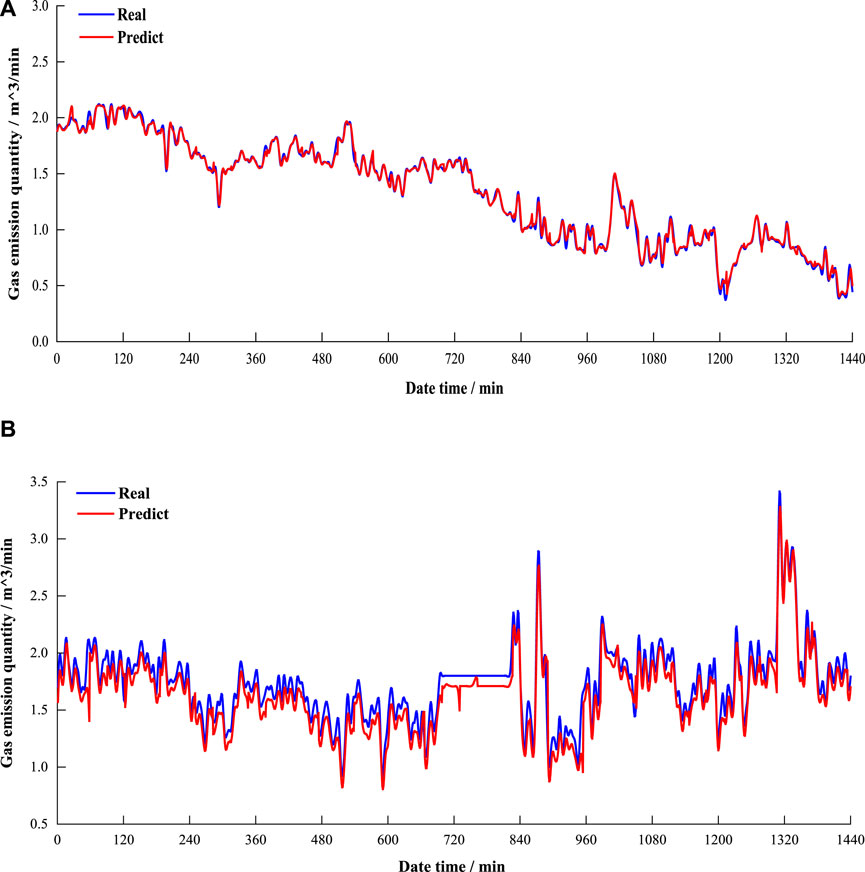
FIGURE 13. Gas emission prediction based on Bi-LSTM. (A) Gas emission prediction in normal production (B) Gas emission prediction before the accident
Analysis of Early Warning Results of Each Indicator System
The gas emission quantity data of Shigang Coal Mine during the normal production from 19 March to 20 March is used to calculate the statistical indicators, the deep learning indicators and the comprehensive indicators to conduct the early warning research and the judgment on the gas emission quantity. The results of the research are shown in Figures 14, 15:
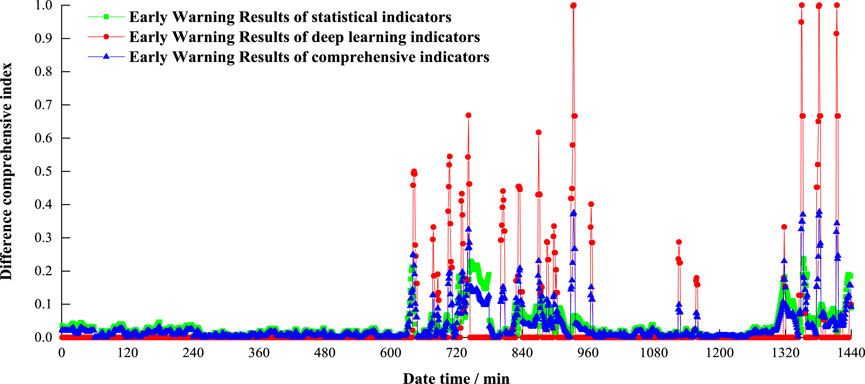
FIGURE 14. Analysis of outburst warning results on March 19th.
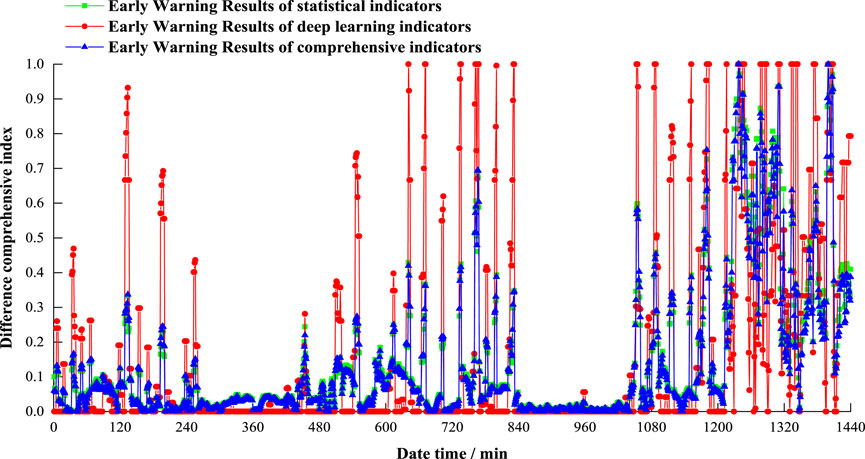
FIGURE 15. Analysis of outburst warning results on March 20.
As reflected by early warning results of gas emission quantity on March 19th and 20th, the deep learning indicators are used to analyze the gas emission quantity. Orange warnings with more than 0.5 appear many times, indicating that the deep learning indicators are overly sensitive to outburst early warnings; Statistical-based indicators can describe the characteristics of the abnormal changes in gas emission quantity to a certain extent, but the sensitivity is lower. The comprehensive indicators combine the sensitivity of deep learning indicators and the statistical indicators to abnormal changes in gas emission quantity, which have significant advantages in the accuracy of the gas outburst early warning.
Analysis of the Outburst Early Warning Results
According to the gas emission data of Shigang Coal Mine from March 19th to 24th, the comprehensive index model is used to carry out the early warning of the coal and gas outburst. The results are shown in Figure 16:
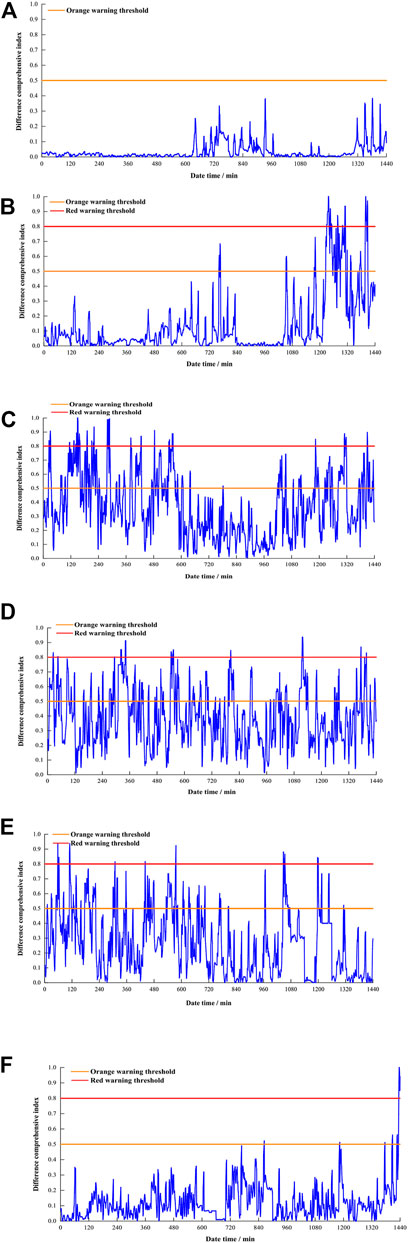
FIGURE 16. Analysis of outburst warning results on March 19–24. (A) Analysis of outburst warning results on March 19 (B) Analysis of outburst warning results on March 20 (C) Analysis of outburst warning results on March 21 (D) Analysis of outburst warning results on March 22 (E) Analysis of outburst warning results on March 23 (F) Analysis of outburst warning results on March 24.
Through the analysis of the early warning of coal and gas outburst in Shigang Coal Mine from March 19th to 24th, the results show that the comprehensive index of gas outburst early warning fluctuates below 0.5 during the normal production period. At around 20:00 on March 20th, the early warning index rose sharply with many red warnings (comprehensive index exceeding 0.8) and continuous orange warnings (comprehensive index exceeding 0.5). From the 21st to 23rd, as the driving activity continued, the comprehensive index fluctuated rapidly and longer-time red warnings (exceeding 0.8) appeared every day, which reveals that the coal and gas outbursts was in the formation phase, and the gas was gushing out rapidly. From 22:00 on the 23rd to 12:00 on the 24th, the comprehensive index fluctuated below 0.5. It might be caused by the fact that the formed small protruding holes were blocked at the development phase, which stopped the gas from gushing out. After 12:00 on the 24th, the gas emission quantity changed drastically until the outburst occurred, and red warnings appeared many times at this stage.
The coal and gas outburst early warning model is used to verify and analyze the data of outburst accidents in Dongfeng Coal Mine and Hebi No. 6 mine. By collecting 24-h period of data at Dongfeng Coal Mine from 8:00 on April 8th to 8:00 on April 9th for early warning analysis, there were many orange warnings and red warnings. The outburst warning results of on Dongfeng coal mine are shown in Figure 17A. By collecting the data of Hebi No. 6 mine from 17:00 on June 3rd to 17:00 on June 4th for early warning analysis, it showed many orange warnings and red warnings. The outburst warning results of on Hebi Six Mineral are shown in Figure 17B. By comparing and analyzing the time series of the gas emission quantity, it is found that the gas emission quantity changes abnormally on the eve of coal and gas outburst, which is consistent with the occurrence law of coal and gas outburst.
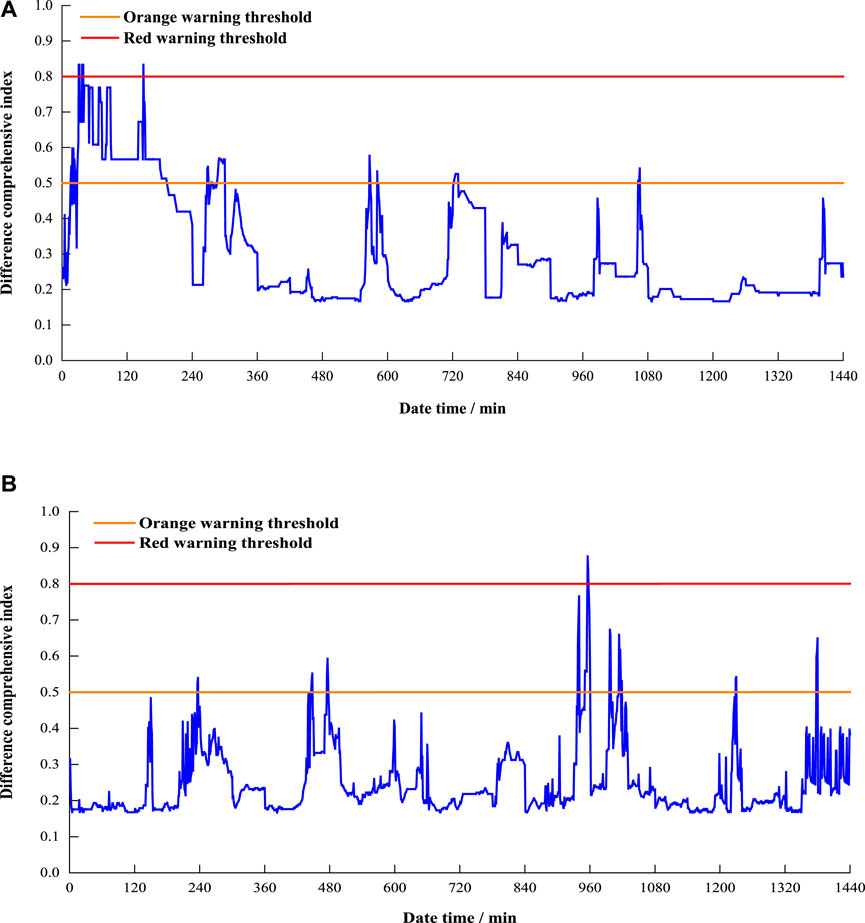
FIGURE 17. Prominent warning results validation analysis. (A) Outburst warning results of on Dongfeng coal mine (B) Outburst warning results of on Hebi Six Mineral.
Conclusion
I. According to the analysis of the coal and gas outburst evolution process, a coal and gas outburst early warning index based on the combination of statistical indicators of the gas emission and deep learning indicators is proposed, which includes the moving average, the deviation ratio, the dispersion ratio, the fluctuation ratio, RMSE and MAPE.
II. The early warning indicators are examined in the “3.25” coal and gas outburst accident in Shigang Coal Mine. The statistical indicators, deep learning indicators and the comprehensive indicators are used for the early warning analysis on the gas emission quantity during the normal production period. By using the deep learning indicators to analyze the gas emission quantity, orange warnings (exceeding 0.5) appear many times, indicating that the deep learning indicators are overly sensitive to outburst early warnings. Statistical-based indicators can describe the characteristics of abnormal changes in gas emission quantity to a certain extent, but the sensitivity is lower. The comprehensive indicators combined with the deep learning indicators and statistical indicators successfully captures the abnormal changes in the gas emission quantity, which has significant advantages in the accuracy of gas outburst early warning and interprets the change rule of the gas emission quantity before the gas outburst.
III. Comprehensive indicators are used to mine and analyze the gas emission quantity data of Shigang Coal Mine. The model proposed in this work captured signals of abnormal changes in the gas emission on March 20th (4 days before the accident), and orange warnings and red warnings were given continuously for many times. The accuracy and practicality of the model is also verified by the gas emission quantity data of Dongfeng Coal Mine and Hebi No. 6 mine.
Data Availability Statement
The original contributions presented in the study are included in the article/Supplementary Material, further inquiries can be directed to the corresponding author.
Author Contributions
CW, LW and HH contributed to conception and design of the study. MJ organized the database. HH performed the statistical analysis. CW wrote the first draft of the manuscript. JW revised sections of the manuscript.
Funding
This paper was funded by the National Nature Science Foundation of China (Grant No. 52004243).
Conflict of Interest
The authors declare that the research was conducted in the absence of any commercial or financial relationships that could be construed as a potential conflict of interest.
Publisher’s Note
All claims expressed in this article are solely those of the authors and do not necessarily represent those of their affiliated organizations, or those of the publisher, the editors and the reviewers. Any product that may be evaluated in this article, or claim that may be made by its manufacturer, is not guaranteed or endorsed by the publisher.
References
Cai, C. C., Tao, Y., Zhu, T. Q., and Deng, Z, X. (2021). Short-Term Load Forecasting Based on Deep Learning Bidirectional LSTM Neural Network. Appl. Sci. 11 (17), 9383. doi:10.3390/app1120938310.3390/app11178129
Chen, J., Zhu, C., Du, J., Pu, Y, Pan, P., Bai, J., and Qi, Q. (2022). A quantitative pre-warning for coal burst hazard in a deep coal mine based on the spatio-temporal forecast of microseismic events. Process Safe. Environ. Protect. doi:10.1016/j.psep.2022.01.082
Du, J., Chen, J., Pu, Y., Jiang, D., Chen, L., and Zhang, Y. (2021). Risk Assessment of Dynamic Disasters in Deep Coal Mines Based on Multi-Source, Multi-Parameter Indexes, and Engineering Application. Process Saf. Environ. Prot. 155, 575–586. doi:10.1016/j.psep.2021.09.034
Han, Y. L., Li, S., Hu, H. Y., and Luo, M. K. (2019). Prediction Model of Coal and Gas Outburst Based on Optimized GA-ELM. Chin. J. Underground Space Eng. 15 (6), 1895–1902. doi:10.1016/j.psep.2019.10.002
Hu, Q. T., Zhou, S. N., and Zhou, X. Q. (2008). Mechanical Mechanism of Coal and Gas Outburst Process. J. China Coal Soc. 33 (12), 1367–1372. doi:10.13225/j.cnki.jccs.2008.12.018
Li, X. Y., Li, T., and Ma, J. W. (2021). Soft Prediction of Coal-Mine Gas Concentration through the Mixture of Gaussian Processes under the Noisy Input Prediction Strategy. J. Signal Process. 37 (11), 2031–2040. doi:10.16798/j.issn.1003-0530.2021.11.003
Lichtenberger, M. (2006). Underground Measurements of Electromagnetic Radiation Related to Stress-Induced Fractures in the Odenwald Mountains (Germany). Pure Appl. Geophys. 163 (8), 1661–1677. doi:10.1007/s00024-006-0083-5
Long, N. Z., Yuan, M., Wang, G. L., Wang, Q. H., Xu, S. Q., and Li, X. L. (2020). Real-time Warning of Coal and Gas Outburst Based on Data Mining. China Mining Mag. 29 (11), 88–93+99. doi:10.12075/j.issn.1004-4051.2020.11.02
Long, N. Z., Yuan, M., Wang, G. L., Xu, S. Q., and Li, X. L. (2021). Research on Early Warning of Coal and Gas Outburst Microseismic-Gas Interactive Response. China Saf. Sci. J. 31 (4), 125–132. doi:10.16265/j.cnki.issn1003-3033.2021.04.017
Luo, M. K., Fan, C. J., LiYangZhang, S. Z. H. H. H., Yang, H. Z., and Lan, T. W. (2018). Failure Criteria of the Geological Dynam1c System of Coal and Gas Outburst. J. China Univ. Mining &.Technology 47 (1), 137–144. doi:10.13247/j.cnki.jcumt.000820
National Bureau of Statistics China (2021). Statistical Bulletin of National Economic and Social Development of the People's republic of China in 2020. Avaliable at: http://www.stats.gov.cn/tjsj/zxfb./202102/t20210227_1814154.html.
Pu, Y., Apel, D. B., Liu, V., and Mitri, H. (2019). Machine Learning Methods for Rockburst Prediction-State-Of-The-Art Review. Int. J. Mining Sci. Tech. 29 (4), 565–570. doi:10.1016/j.ijmst.2019.06.009
Qi, L. M., Lu, Y. T., Guan, L. H., and Qi, M. (2021). Exploration and Application of Determination Method of Sensitive index for Prediction of Coal and Gas Outburst. Mining Saf. Environ. Prot. 48 (3), 85–89. doi:10.19835/j.issn.1008-4495.2021.03.016
Qin, H. J., Wei, J. P., Li, D. H., and Wu, Z. Q. (2021). Research on the Mechanism of In-Situ Stress in the Process of Coal and Gas Outburst. J. China Univ. Mining &.Technology 50 (05), 933–942. doi:10.13247/j.cnki.jcumt.001327
Song, D. Z., He, X. Q., Dou, L. M., Zu, Z. Y., Wang, A. H., and Li, Z. L. (2021). Research on MS Regional Detection Technology for Coal and Gas Outburst hazard. China Saf. Sci. J. 31 (1), 89–94. doi:10.16265/j.cnki.issn1003-3033.2021.01.013
Wang, E. Y., Li, Z. H., Li, D. X., Liu, X. F., and Li, J. Z. (2020a). Application of Electromagnetic Radiation Monitoring Equipment in Monitoring and Warning of Coal and Gas Outburst. Saf. Coal Mines 51 (10), 46–51. doi:10.13347/j.cnki.mkaq.2020.10.008
Wang, H., Wang, H., Xu, K., and Xu, Y. S. (2020b). Evolutionary Recurrent Neural Network for Image Captioning. Neurocomputing 401 (2), 249–256. doi:10.13976/j.cnki.xk.2020.920410.1016/j.neucom.2020.03.087
Wang, S. Q. (2018). Gas Time Series Prediction and Anomaly Detection Based on Deep Learning. China.: University of Mining and Technology. Doctoral dissertation. Avaliable At: https://kns.cnki.net/KCMS/detail/detail.aspx?db-name=CDFDLAST2019&filename=1019812115.
Wang, W., Li, Y., and Li, X. G. (2020c). Spatial -temporal Coupling Association Analysis of Coal Mine Gas Accidents from 2010 to 2018. Saf. Coal Mines 51 (5), 177–182. doi:10.13347/j.cnki.mkaq.2020.05.038
Wang, Y. H., Liu, L. L., Fu, H., and Xu, Y. S. (2018). Esearch on Acoustic Emission Multi-Parameter Time Series Based Prediction of Gas Outburst. China Saf. Sci. J. 28 (5), 129–134. doi:10.16265/j.cnki.issn1003-3033.2018.05.022
Wang, Y. H. (2020). Research on the Method of Coal and Gas Outburst Situation Awareness. Liaoning: Liaoning Technical University. Doctoral dissertation. Avaliable at: https://kns.cnki.net/KCMS/detail/detail.aspx?dbname=CDFDLAST-2021&filename=1020422328.
Wu, X. S., Tian, S. X., Ma, R. S., Xu, S. Q., Lin, H. Y., Yu, J., et al. (2021). Study on Prediction of Outburst Risk of Coal Roadway by Initial Gas Emission Law of Coal Body. J. Saf. Sci. Tech. 17 (4), 116–121. doi:10.1016/j.ijrmms.2015.07.006
Wu, Y. (2021). A Brilliant Answer Sheet of Coal Mine Gas Prevention and Control. Beijing: China Energy News. Avaliable at: http://www.cnenergynews.cn/meitan/2021/03/17/detail_2021031793399.html
Xu, Y. S., and Cheng, Y. W. (2021). Prediction and Forecast of the SKPCA with NEAT Coal and Gas Outburst Risks. J. Saf. Environ. 21 (4), 1427–1433. doi:10.13637/j.issn.1009-6094.2020.0421
Yang, Y., and Zhou, T. (2021). Comprehensive Analysis on Sensitive index of Coal and Gas Outburst Prediction in Working Face. China Mining Mag. 30 (z1), 325–331. doi:10.12075/j.issn.1004-4051.2021.S1.020
Zhang, C. L., Wang, E. Y., Wang, Y. B., and Zhou, X. F. (2021). Spatial-temporal Distribution of Outburst Accidents from 2001 to 2020 in China and Suggestions for Prevention and Control. Coal Geology. Exploration 49 (04), 134–141. doi:10.3969/j.issn.1001-1986.2021.04.016
Keywords: gas emission quantity, coal and gas outburst, deep learning, Bi-LSTM, coal
Citation: Wang C, Wei L, Hu H, Wang J and Jiang M (2022) Early Warning Method for Coal and Gas Outburst Prediction Based on Indexes of Deep Learning Model and Statistical Model. Front. Earth Sci. 10:811978. doi: 10.3389/feart.2022.811978
Received: 09 November 2021; Accepted: 24 January 2022;
Published: 02 March 2022.
Edited by:
Jie Chen, Chongqing University, ChinaReviewed by:
Alexey Lyubushin, Institute of Physics of the Earth (RAS), RussiaGaofeng Song, North China University of Technology, China
Copyright © 2022 Wang, Wei, Hu, Wang and Jiang. This is an open-access article distributed under the terms of the Creative Commons Attribution License (CC BY). The use, distribution or reproduction in other forums is permitted, provided the original author(s) and the copyright owner(s) are credited and that the original publication in this journal is cited, in accordance with accepted academic practice. No use, distribution or reproduction is permitted which does not comply with these terms.
*Correspondence: Like Wei, wlkyo@qq.com