Dynamic Dust Source Regions and the Associated Natural and Anthropogenic Dust Emissions at the Global Scale
 Zhen Wang1,2
  Siyu Chen
 Yu Chen
- 1Key Laboratory for Semi-Arid Climate Change of the Ministry of Education, College of Atmospheric Sciences, Lanzhou University, Lanzhou, China
- 2Institute of Numerical Meteorology and Oceanography, College of Meteorology and Oceanography, National University of Defense Technology, Changsha, China
Dust emission is a key factor for reproducing dust’s physical process and its climate impact in dust modeling. However, previous studies always employed static land cover types to classify potential dust sources, ignoring dynamic variations in the surface bareness, which may lead to large uncertainties in the simulated dust emission fluxes, especially in regard to anthropogenic dust (AD) emission induced by wind erosion of human-disturbed land surfaces. Combined with anthropogenic land use and land cover change, dynamic dust source regions and the associated natural dust (ND) and AD emissions at the global scale from 2001 to 2018 are estimated in this study. The results show that the AD emissions exhibit a significant seasonal variability and dispersion at the global scale in contrast to the generally concentrated spatial distributions of ND emissions. The high-value ND areas are primarily located in the Sahara Desert, Arabian Peninsula, Karakum Desert, East Asia, Australian Desert, and other large desert areas, and the ND emission flux reaches a maximum of 50 μg m−2 s−1 or higher. High values of the annual average AD emission fluxes are located in southern Russia (124.6 ± 26.6 μg m−2 s−1), northern China (103.2 ± 21.9 μg m−2 s-1), the central and northern United States (56.0 ± 17.4 μg m−2 s−1), and the southern side of the Sahara Desert (74.1 ± 14.2 μg m−2 s−1). Especially in southern Russia and northern Kazakhstan, the AD emission flux accounts for the largest contribution to the total dust emission flux, at 98.2%. The ND emission flux demonstrates an upward trend in the central Sahara Desert, southern Arabian Desert, and Iranian regions and a significant downward trend in northwestern China. The AD emissions exhibit a decreasing trend in northern China, western India, the southern side of the Sahara Desert, and the central United States from 2001 to 2018 due to the implementation of environmental protection policies and a decrease in the wind speed, with the highest rate of decline reaching −74.9 μg m−2 s−1/decade. This study provided confidence for the further investigation of dust mass balance and the climatic impacts of natural and anthropogenic dust.
Introduction
Dust aerosols, as one of major aerosols in the tropospheric atmosphere, play a critical role in the energy balance and hydrological cycle of the Earth system (Mao et al., 2011; Chen et al., 2021). It not only directly affects radiative forcing by solar radiation scattering and absorption (Liu et al., 2011; Chen et al., 2018) but also indirectly affects cloud properties and lifetime as cloud condensation nuclei and ice nuclei, thus further influencing precipitation efficiency (Liu et al., 2019a; Liu et al., 2019b). Dust particles are deposited in oceans and rainforests through long-term transport, which replenishes key minerals and further influences the ecosystem and carbon cycle (Jia et al., 2015; Qin et al., 2016; Liu et al., 2019). Dust particles are also easily enriched with acidic substances, bacteria, organic pollutants, and heavy metals, which greatly harms human health (Chen et al., 2019b; Xia et al., 2021).
As early as the 1990s, Penner et al. (1994) and Tegen and Fung (1995) indicated that it would be inaccurate to classify dust aerosols exclusively as natural aerosols. According to the diversity in dust source areas and dust emission mechanisms, dust aerosols can be divided into natural dust (ND) and anthropogenic dust (AD) (Tegen et al., 2004; Huang et al., 2015; Munkhtsetseg et al., 2017; Chen et al., 2018). ND is emitted from wind erosion of deserts (Chen et al., 2013). The divergences in anthropogenic land cover types (e.g., cropland, pastureland, urban, etc.) are induced by the concept of being “people managed” (Meiyappan et al., 2014). AD is indirectly generated by wind erosion of human-disturbed land surfaces (e.g., farmlands and grasslands). The Intergovernmental Panel on Climate Change (IPCC) (2017) pointed out that AD concentration accounts for approximately 30–70% of the total dust concentration and that its contribution to global dust concentration cannot be ignored. For example, dust loading in the western United States in the early 20th century increased by 500% due to farmland expansion (Neff et al., 2008). Du et al. (2019) found that grassland reduction exacerbated wind erosion and observed that this greatly increased dust emission fluxes from 38.6 to 2,182.6 g m−2 d−1.
The dust emission scheme is the core and difficulty of accurately describing the physical process of dust (Han et al., 2004; Zhao et al., 2010; Han et al., 2016; Che et al., 2018). Since the 1990s, a large number of scholars have developed and improved dust emission schemes based on different assumptions and simplification of physical processes (Westphal et al., 1988; Joussaume, 1990; Tegen and Fung, 1994; Shao et al., 1996; Marticorena et al., 1997; Wang et al., 2000; Woodward, 2001; Sugimoto et al., 2003; Zender et al., 2003; Han et al., 2004; Han, 2010; Huneeus et al., 2010). According to the complexity of the scheme, it can be divided into three categories (Zender et al., 2003; Shao and Dong, 2006):
1) Empirical dust emission scheme: This scheme mainly considers the statistical relationship between vertical dust emission flux and friction velocity or critical dust emission velocity (Tegen and Fung, 1995; Mahowald et al., 1999; Perlwitz et al., 2001). Gillette and Passi (1988) found that the dust emission rate is between the third and fifth powers of the critical friction velocity through field experiments. They proposed an empirical formula for vertical release flux. However, the model has fewer input parameters and cannot completely reflects the micro-physical mechanism of dust emission. Tegen and Fung (1994) constructed a three-dimensional dust transport model based on the observation of dust storms, which included soil texture, surface roughness, and soil water content and other wind erosion parameters, and found that the model is also suitable for fine particles. Ginoux et al. (2001) adjusted the size distribution of dust on the basis of Gillette and Passi (1988) and constructed the GOCART empirical emission parameterization scheme.
2) Dust emission scheme based on simplified physical process: This scheme considers simplified wind erosion physics and adds the dust climate data observed by satellites. It has been applied to the global dust emission simulation (Woodward, 2001). Among them, the Marticorena and Bergametti (1995) scheme (hereinafter referred to as the MB plan) believed that the dust emission flux depended on the horizontal transition intensity of surface particles and was related to the soil clay content. Alfaro and Gomes (2001) determined the relationship between the vertical flux of dust and friction velocity through wind tunnel tests, and then established a mesoscale atmospheric model (DPM), which includes soil characteristics such as soil mass density and surface roughness and wind erosion parameters such as friction velocity. However, due to the inaccurate acquisition of particle binding energy, the model results are still uncertain. Zender et al. (2003) considered the influence of soil wind erosion on the basis of the MB scheme and improved the simulation accuracy of dust emission.
3) Dust emission scheme based on the detailed microphysical process: This scheme considers the most detailed physical process. It is believed that the dust is generated by bombardment overcoming the adhesion between soil particles (Shao et al., 1996; Shao, 2001; Shao, 2004). The initial microphysical dust emission scheme only considered the relationship between kinetic energy and bonding energy during collision, such as Shao et al. (1996). On this basis, factors such as the particle size distribution and the mass fraction of dust and the release threshold were gradually added to subsequent schemes. Shao (2001) proposed that the release of dust is caused by the disintegration of aggregates produced by jumping bombardment, and the dust emission flux of all particle size distributions can be calculated. The Shao (2004) scheme further considers that the mass fraction of free dust in the soil should be much smaller than those in the form of aggregated dust clusters. Shao et al. (2011a, 2011b) found that the particle size distribution of soil parent material determines the particle spectrum distribution of dust particles in the atmosphere, thereby reducing the uncertainty of Shao (2004). Kok et al. (2014) considered the breaking mechanism of aggregate particles during the release of dust and constructed a dust emission scheme based on microphysical mechanisms. However, it is difficult to accurately obtain key surface parameters related to dust emission, such as soil moisture, roughness, etc.
AD emission quantification is a great challenge. Compared to ND, AD concentrated in human-disturbed land surfaces with small emission scales exhibits a large temporal and spatial variability, a complex and diverse chemical composition, and various physical and optical features (Chen et al., 2017a; Chen et al., 2017b; Wang et al., 2018). Most current dust modeling only considers the physical processes of wind erosion in deserts. AD emissions from human-disturbed surfaces have been ignored or seriously underestimated, resulting in uncertainties of dust emission fluxes up to 10 times higher in numerical modeling (Munkhtsetseg et al., 2017; Du et al., 2019). Farmland was considered a major AD source producing dust pollution events in the 1930s (Orlove, 2005; Cook et al., 2009). Neff et al. (2008) found that a 500% increase in AD emissions in the western United States was closely linked to pastureland and grassland expansion. In addition, several studies have demonstrated that new dust sources are created by human drinking water exploitation, such as Owens Lake (Gillette et al., 1997) and Franklin Lake (Reynolds et al., 2007). Despite the difficulty of AD monitoring, Tegen and Fung (1995) concluded that AD emissions account for 30–50% of total dust emissions. Xi and Sokolik (2016) developed an AD scheme for farmlands in Central Asia based on the Weather Research and Forecasting dust model with chemistry (WRF-Chem-DuMo) and found that 18.3–56.5% of dust emissions could be considered AD emissions in Central Asia when applying an optimal land use intensity threshold of 90%.
However, the previous modeling always refers to the static land cover, ignoring the dynamic variations in the surface bareness during dust modeling, which may lead to large uncertainties in the simulated dust emission fluxes, especially in regard to AD. What is the seasonal and interannual variations of dust source at the global scale based on the improved dynamic surface? What are the differences in surface bareness and dust emissions between ND and AD? What is the trend of the ND and AD emission flux from 2001 to 2018 at the global scale? According to these urgent scientific problems, we estimated and compared the differences in the temporal and spatial distribution characteristics of ND and AD emissions between various land cover types from 2001 to 2018. This paper is organized as follows. Section 2 contains a summary of our methodology and datasets used to calculate the dust emissions, and the results are provided in Section 3. Section 4 presents the conclusions.
Datasets and Methods
Datasets
Normalized Difference Vegetation Index
The Moderate Resolution Imaging Spectroradiometer (MODIS) offers NDVI grid product data from January 1, 2001, to the latest time. The global MODIS NDVI product is designed to provide the consistent spatial and temporal comparisons of vegetation conditions. This dataset is available at https://ladsweb.modaps.eosdis.nasa.gov/. This study selects NDVI data with a spatial resolution of 0.05° × 0.05° and a temporal resolution of 1 month during 2001–2018, which are further analyzed to calculate the dynamic bareness at the global scale.
Land Cover
The land cover is provided by MODIS annual product MCD12C1, which exhibits a spatial resolution of 0.05° × 0.05° in the Climate Modeling Grid (CMG). The main land cover plan contains 17 land cover classes identified by the International Geosphere-Biosphere Program (IGBP), including 11 natural vegetation classes, 3 developed and mosaic land classes, and 3 non-vegetated land classes. These datasets are available at https://ladsweb.modaps.eosdis.nasa.gov/. Open sagebrush, savanna, and barren or sparsely vegetated areas are selected as ND sources. Grassland, farmland, and farmland/natural vegetation mosaic areas are selected as AD sources in the study. It is noted that farmland/natural vegetation mosaic areas are areas with less than 60% of area covered by this cover type.
ERA-Interim
ERA-Interim is the global atmospheric reanalysis dataset provided by the European Centre for Medium-Range Weather Forecasts (ECMWF) available from January 1, 1979, to August 31, 2019. The ERA-Interim daily data with a maximum spatial resolution of 0.125° × 0.125° and a minimum spatial resolution of 3° × 3° contain a wealth of meteorological parameters, with the data provided four times a day (at 00:00, 06:00, 12:00, and 18:00 UTC). These datasets are available at https://apps.ecmwf.int/datasets/data/interim-full-daily/levtype=sfc/. The ERA-Interim reanalysis products are compared to those of the National Oceanic and Atmospheric Administration (NOAA) National Centers for Environmental Prediction Climate Forecast System Reanalysis (NCEP-CFSR) and National Aeronautics and Space Administration (NASA) Modern-Era Retrospective analysis for Research and Applications (MERRA) to assess their ability in capturing observed surface wind events critical to wind erosion (Largeron et al., 2015; Chen et al., 2018). It was found that the former products perform the best in terms of the weather and seasonal fluctuations in annual and daily cycles and surface wind speed. Therefore, the wind speed at 10 m with an ERA-Interim spatial resolution of 0.4° × 0.4° is selected as an input parameter to calculate the ND and AD emission fluxes.
PM2.5 Concentration
This dataset is provided by the Institute of Atmospheric Physics, Chinese Academy of Sciences and summarizes the fine particulate matter (PM2.5) data of 10,000 sites worldwide from November 26, 2013, to the present. The dataset contains meteorological elements such as black carbon, CO, NO2, O3, particulate matter with particle size below 10 μm (PM10), PM2.5, and SO2. PM2.5 and PM10 observations are compared to our simulation results to verify their credibility in the study.
Methods
Dynamic Dust Source Regions
Static land cover types to classify potential dust sources do not reflect dynamic changes, which lead to great uncertainties in estimating dust emissions in different seasons especially (Xi and Sokolik, 2016). Therefore, the dynamic dust sources at the global scale with a temporal resolution of 15 days are constructed by employing the 0.05° × 0.05° resolution of NDVI from 2001 to 2018 in the study (Kim et al., 2013; Kim et al., 2017). The corresponding equation is as follows:
where Ntotal and N<0.15 are the total number of NDVI pixels (Brown et al., 2006) and the number of pixels with an NDVI value below 0.15 (Bradley and Mustard, 2005) in a 1° × 1° grid cell, respectively. Moreover, bareness with high soil moisture and snow cover fractions are excluded in the calculations.
Dust Emission Schemes
The current dust emission schemes can be divided into three categories: (1) empirical dust emission scheme, such as Tegen and Fung (1995), Mahowald et al. (1999), and Perlwitz et al. (2001); (2) dust emission scheme based on simplified physical process, such as Ginoux et al. (2001) and Woodward (2001); (3) dust emission scheme based on the detailed microphysical process, such as Shao et al. (1996), Shao (2001), Shao (2004), Shao et al. (2011a), and Shao et al. (2011b). Through research and comparison of three emission schemes, Shao and Dong (2006) found that although the empirical dust emission scheme is simple in form, the relationship (Gillette and Passi, 1988) between the applied dust emission rate and the critical friction velocity of different particle size is not reasonable (Nickling et al., 1999). There are empirical coefficients in the empirical dust emission scheme, and its specifications have no guidelines, which will inevitably cause errors in the simulation results. And the empirical dust emission scheme is not a spectral model. It is very difficult to truly estimate the coefficients, critical friction velocity, and dust mass fraction in actual simulation. Due to the lack of the ability to specify the temporal and spatial changes of model parameters and the difficulty in obtaining large-scale soil and surface data, especially soil plastic pressure and parent soil particle size distributions, the accuracy and application of this scheme are severely restricted. In addition, a major and critical problem faced by the empirical dust emission and the detailed microphysical dust emission scheme is the lack of direct dust flux data for model verification.
With the development of dust observation technology, especially the application of satellites, large-area continuous dust emission monitoring has become possible. And the developments of inverse data calculation methods are producing quantitative estimates of dust load. This makes it possible to apply satellite data to correct and constrain the dust emission scheme of simple physical processes to show great advantages compared to the empirical and detailed microphysical dust emission scheme (Cakmur et al., 2004). The dust emission scheme of simplified physical process with complexity between the two extremes is more applicable to the world modeling of dust emissions (Ginoux et al., 2001; Woodward, 2001; Zender et al., 2003). Emission schemes that consider simple physical processes have been widely used. Simulation of dust emission requires careful attention to the process of dust movement (Schulz et al., 1998). Many factors determine soil erodibility and dust emissions, many of which are poorly understood on a global scale. The most important factors include wind friction speed, vegetation cover, and surface soil moisture content. On this basis, Marticorena and Bergametti (1995) designed a soil-based dust emission scheme, the MB scheme, to provide an explicit representation of the dust emissions over deserts coupled with atmospheric transport models. The calculation equation for dust emission flux is expressed as follows:
where
where F and G are the vertical and horizontal emission flux, respectively; %clay is the clay content. However, due to the lack of physical description of the dust produced by wind erosion, the relationship between the horizontal and vertical flux in the MB scheme is not yet accurate. In this study, we focus on analyzing the horizontal dust emission flux (the dust emission fluxes below are all horizontal dust emission fluxes).
Compared with the scheme during the same period that only focused on the area of dust source and wind speed (Joussaume, 1990; Genthon, 1992; Joussaume and Jouzel, 1993), the MB scheme considered the dependence of dust emission on soil characteristics in the source parameterization. At the same time, through comparison with relevant experimental data, the credibility of each step of the program was independently verified, and the scheme greatly reduced the uncertainty of inversion of dust emission flux (Marticorena et al., 1997). The validations of this dust production model have established the physical consistency and the ability of the model to reproduce measurements of erosion thresholds and the dust fluxes for various conditions of the surface features.
However, the MB scheme contains multiple affecting factors that are hard to obtain precisely, resulting in difficulties of simulations utilized in this scheme. To isolate land surface features and their meteorological impacts, Marsham et al. (2011) further constructed an improved simplified MB scheme (hereafter referred to as the simplified MB scheme), which ignores the second-order effects of stability and roughness on the bulk behavior and replaces the frictional velocity U* with the wind speed U at 10 m. Cakmur et al. (2004), Evan et al. (2016), Chen et al. (2019a), and Chen et al. (2019b) employed the simplified MB scheme to simulate dust emission and reproduced dust emissions at the regional (e.g., North Africa and East Asia) and even global scales. The equation for the calculation of the dust emission fluxes is expressed as follows:
where C is an empirical constant with a value of 1 μg s2 m−5 in this study, B is the dynamic bareness with seasonal variations (as described in Section 2.2.1), u is the wind speed at 10 m, and ut (threshold wind speed) is a key parameter in the quantitative estimation of dust emission fluxes, which depends on the surface characteristics. The fixed ut has great uncertainty to dust emission in different dust sources. We choose different ut for different underlying surfaces (ND or AD sources) to simulate dust emission fluxes. The ND emission threshold, ut = 7 m s−1, is applied in this study (Chomette et al., 1999; Marsham et al., 2011; Chen et al., 2014). The valid range of ut in regard to AD emissions ranges from 6.5 to 13 m s−1 (Helgren and Prospero, 1987), and the smallest value 6.5 m s−1 is used in AD sources, consistent with Xi and Sokolik (2016), Chen et al. (2019a), and Chen et al. (2019b).
Results
Dynamic Dust Source Regions
High values of the global NDVI are mainly distributed in eastern North America, South America, central Africa, eastern and southeastern China, and Indonesia, with values ranging from 0.6 to 0.9 during 2001–2018 (Supplementary Figure S1), where the surface bareness is low (Figure 1). The NDVI low values range from 0 to 0.15, mostly in desert, such as the Sahara Desert, the Arabian Desert, the Neft Desert, the Karakum Desert, the Taklamakan Desert, and the Australian Desert, where surface bareness values are extremely high and even reach above 0.9. The ND emissions originate from areas where the cover type includes open shrublands, savannas, and barren or sparsely vegetated areas. In the permanent desert region, NDVI has little seasonal variation (Supplementary Figure S1). The AD sources mainly comprise areas containing grasslands, croplands, and cropland/natural vegetation mosaic areas. There are obvious seasonal variations especially in southern Russia, eastern North America, Europe, and central China (Supplementary Figure S2). Compared to ND (Supplementary Figure S3), the AD source areas are complex due to the small scale of the AD sources, diverse subsurface types, and high spatio-temporal dynamic variability.
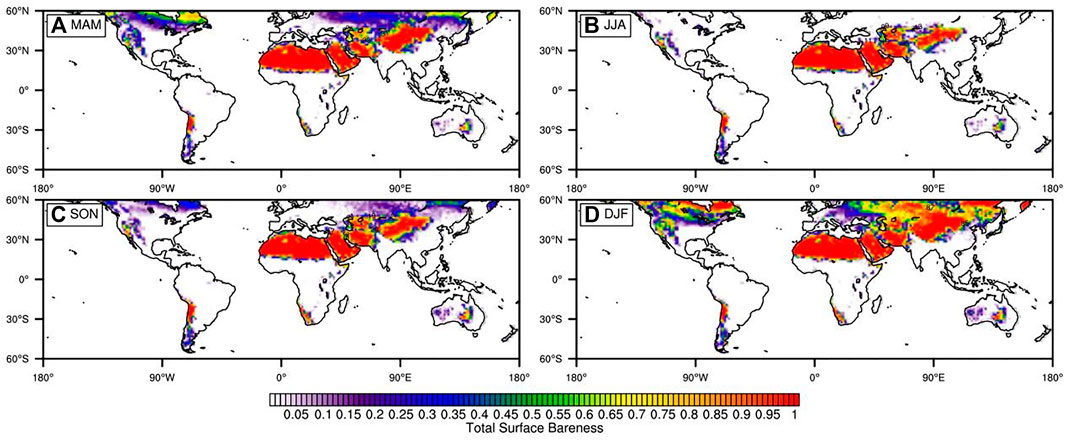
FIGURE 1. Seasonal variations in total surface bareness at the global scale during 2001–2018. (A) MAM: March, April and May; (B) JJA: June, July and August; (C) SON: September, October and November; (D) DJF: December, January and February (same below).
The global average surface bareness of the AD sources is commonly lower by approximately 20% than that of the ND sources. And the area of the AD sources is smaller by 8.1% than that of the ND sources. Nevertheless, the contributions of AD surface bareness to total surface bareness cannot be ignored. Especially, surface bareness of the AD sources in the south of the Tibet Plateau accounts for the largest contribution at 48.2 ± 1.9% to total surface bareness. The ratio of surface bareness of the AD sources to total bareness in southern Russia and northern Kazakhstan reaches 33.4% (MAM), 25.5% (JJA), 33.6% (SON), and 49.6% (DJF), respectively (Figure 2).
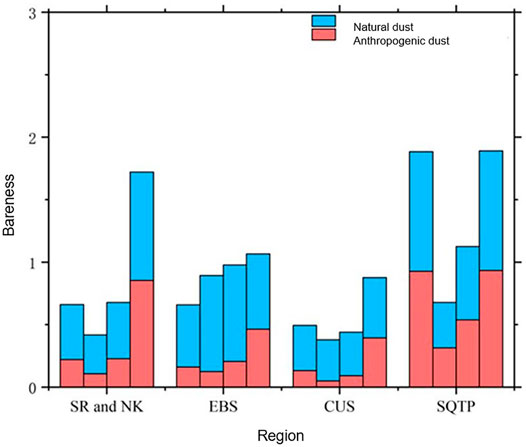
FIGURE 2. Seasonal comparison of the AD and ND surface bareness in typical regions during 2001–2018. The bars represent spring, summer, autumn, and winter from left to right. SR and NK represent southern Russia and northern Kazakhstan (45–54°N, 70–80°E); EBS represents eastern Black Sea (36–40°N, 39–48°E); CUS represents central United States (39–48°N, 100–120°W); SQTP represents the southern Tibet Plateau (30–32°N, 85–90°E).
Overall, a decreasing trend of ND source bareness is found in most areas, especially in the desert areas of the northwestern China, with a decrease rate of up to -0.01/decade. Additionally, a decreasing trend at a lower rate is found along the edge of the Sahara Desert, the Australian Desert, the Arabian Desert, the Lute Desert, and the Karakum Desert (Figure 3). Compared with ND surface bareness, the AD surface bareness exhibits an increasing trend in southern Russia and Kazakhstan, northern US, and southern Canada at a rate of up to 0.2/decade and a decreasing trend in northern and northwestern China, western and northwestern India, the southern side of the Sahara Desert, and the central United States at a rate of up to -0.3/decade. In particular, a decreasing trend of the surface bareness is found in northern and northwestern China (25–40°N, 88–136°E), with the rate of decrease reaching its maximum in winter, up to -0.04/decade. The maximum value in winter and spring is much higher than that in summer and autumn, with the regional average bareness extreme value reaching 0.4 and the maximum increase occurring in autumn, at 0.05/decade, in southern Russia and northern Kazakhstan (Figure 4). These results were also supported by Chen et al. (2019) who proved that the earth is greening especially in China and India. Human land use is the main driving force for greening the earth, and farmland greening has the greatest contribution to reducing the areas of bare soil and increasing the global leaf areas.
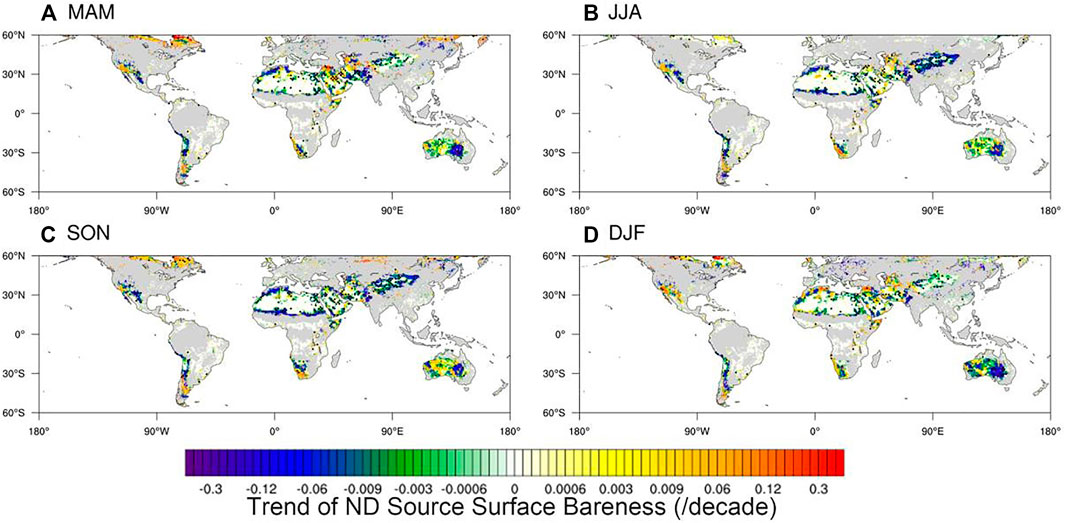
FIGURE 3. Trend of the seasonal ND surface bareness during 2001–2018. The dotted regions with statistically significant above the 90% confidence level are indicated.
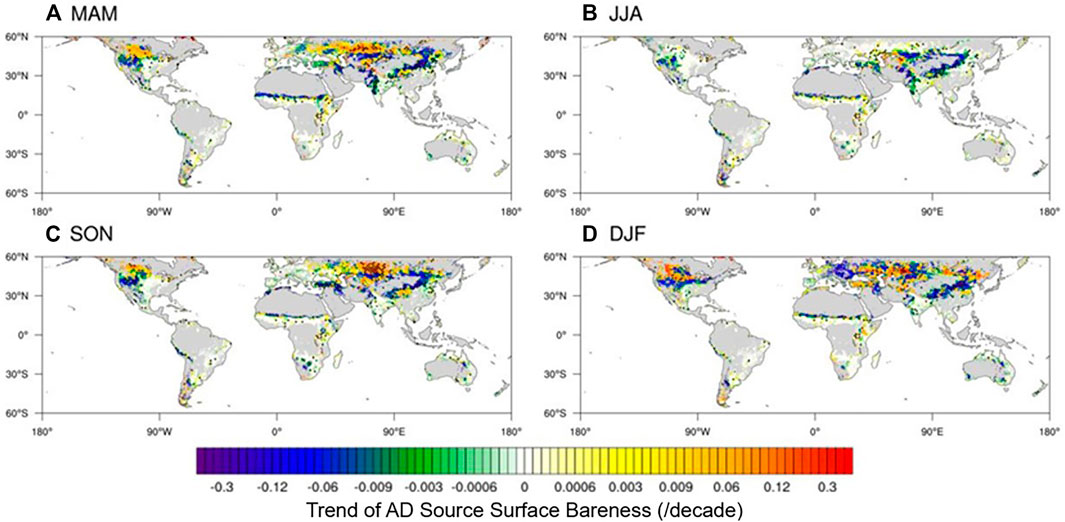
FIGURE 4. Same as Figure 3 of AD surface bareness.
Natural and Anthropogenic Dust Emissions
The high-value ND areas are primarily located in the Sahara Desert (15–35°N, 20°W∼40°E), the Arabian Peninsula (13–20°N, 35–60°E), the Karakum Desert (20–55°N, 55–73°E), East Asia (32–54°N, 73–133°E), the Australian Desert (12–46°S, 113–153°E), and other large desert areas, and the ND emission flux reaches a maximum of 50 μg m−2 s−1 or higher (Figure 5). AD emissions are widely scattered at the global scale (Figure 6) in contrast to the generally concentrated spatial distributions of ND emissions. AD source areas are complex due to the small scale of the AD sources, diverse subsurface types, and high spatiotemporal dynamic variability. The AD emission fluxes in southern Russia, northern China, and central United States are higher with the maximum value exceeding 50 μg m−2 s−1. There are obvious seasonal changes in AD emission flux. AD emissions are generally greater in winter and spring than in summer and autumn. For example, the regional average AD emission flux in Russia (46–56°N, 5–50°E) is 0.18 μg m−2 s−1 in summer, but 401.6 μg m−2 s−1 in winter.
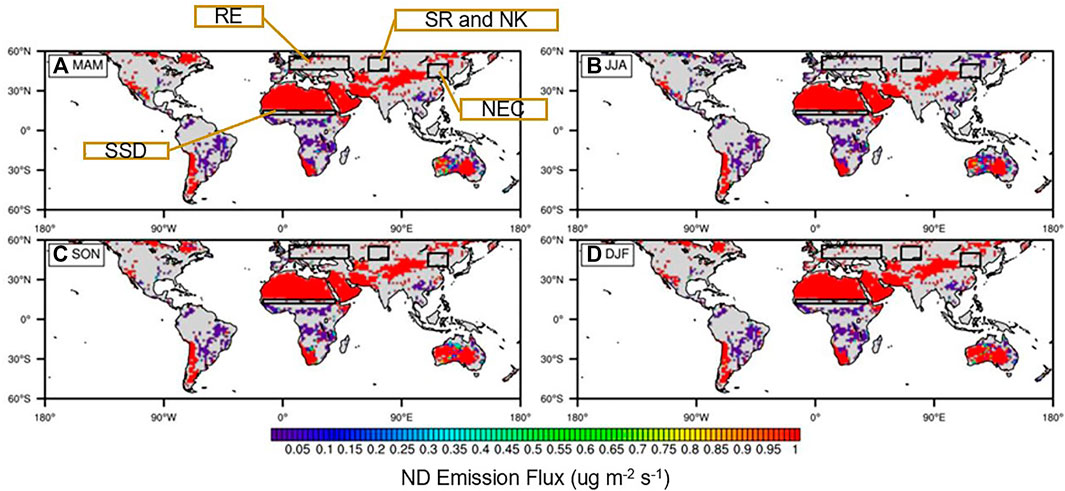
FIGURE 5. Seasonal variations of the ND emission flux at the global scale during 2001–2018. The black boxes correspond to the four major areas in Figure 7SR and NK: southern Russia and northern Kazakhstan (45°N∼55°N, 65°E∼80°E); NEC: Northeast China (40°N∼50°N, 110°E∼125°E); SSD: southern side of the Sahara Desert (12°N∼15°N, 15°W∼0°–40°E); RE: Russia in Europe (46°N∼56°N, 5°E∼50°E).
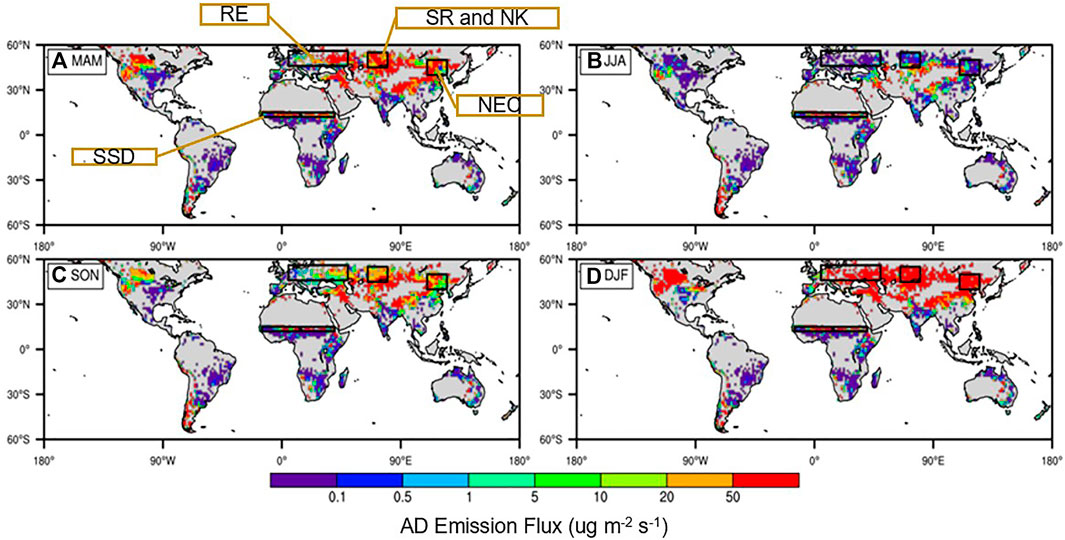
FIGURE 6. Same as Figure 5 of AD emission fluxes.
The AD emission fluxes accounted for 28.8% of the global dust emission flux (Figure 7A), which is similar to that of Huang et al. (2015), who concluded that the proportion of AD emissions is 25%. The proportion of AD in total dust emissions on a global scale showed a trend of first increasing and then decreasing. The contribution of AD was the largest in 2011, reaching 31.6%. The proportion of AD showed a fluctuating trend on five continents (Figure 7B), and the trend in South America was the slowest. The AD contribution ratios of Asia, Europe, Africa, North America, and South America reached the largest in 2012, 2017, 2010, 2015 and 2012, respectively, 33.6, 42.5, 12.2, 45.8, and 26.6%. In North America, AD accounts for a much larger proportion of total dust emissions than other continents, accounting for 40.9%, followed by Europe, while AD accounts for the smallest proportion in Africa, accounting for only 10.4% of total dust emissions. The AD emission flux accounts for the largest contribution to the total dust emission flux in southern Russia and northern Kazakhstan, at 97.6% (MAM), 98.2% (JJA), 97.6% (SON), and 99.2% (DJF) (Figure 8), consistent with Xi and Sokolik (2016) who indicated that the contribution of AD to the total dust emission flux is as high as 90% in the Central Asia.
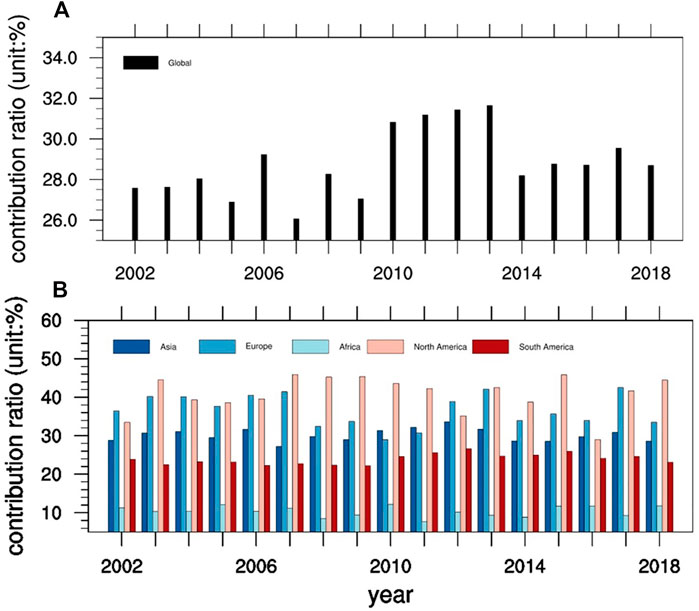
FIGURE 7. The evolution of the AD contribution ratio at the global scale (A) and typical regions (B) from 2001 to 2018. Global (60°S∼60°N, 180°W∼180°E); Asia (1–60°N, 26–178°E); Europe (37–60°N, 9°W∼0°–5°E); Africa (35°S∼37°N, 17°W∼0°–9°E); North America (7–60°N, 170°W∼55°W); South America (53°S∼7°N, 80°W∼35°W).
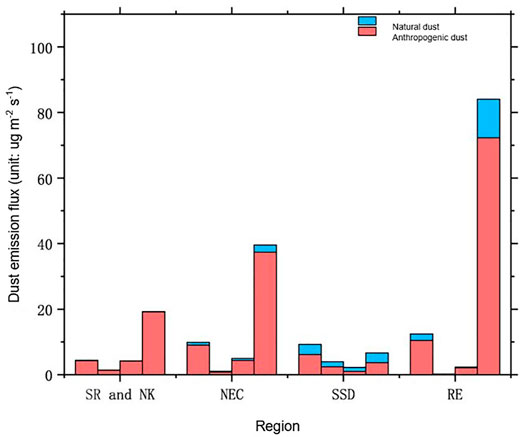
FIGURE 8. Same as Figure 5 of the AD and ND emission fluxes.
Overall, the simulated dust emission is well captured. As the AD is hard to lift up to the planet boundary layer for a long-range transport, the AD column is primarily influenced by the emission process in dust source regions, with relatively little influence from long-term transport (Huang et al., 2015). Therefore, dust weather observations at ground stations are adopted to evaluate AD schemes performance in simulating AD emissions in this study. Figure 9 shows a comparison of the normalized PM2.5 observation data to the normalized dust emission flux (the sum of the ND and AD emission fluxes) obtained in our simulations. The scattered points are concentrated in the region of 0.87 < R < 1.21 (R is the slope of the line from the origin), which confirms the credibility of our simulation results in Russia in Europe, western and northwestern India, northeastern China, and the central United States. The spatial distribution of the high-value AD emission centers agrees well with the results provided by Xi and Sokolik (2016) for Central Asia and the simulations reported by Chen et al. (2019a) and Chen et al. (2019b) at the global scale. The AD emission fluxes accounted for 28.8% of the global dust emission flux, which is similar to that of Huang et al. (2015), who concluded that the proportion of AD emissions is 25%. In previous studies, Tegen and Fung (1995) proposed that AD emissions account for 30–50% of the total global dust emissions. This difference can be attributed to our results considering the dynamic changes in dust source areas and not considering the dust directly stemming from human activities. Moreover, the simulated ND emissions in this study are mainly concentrated in desert areas, such as the Sahara Desert, the Taklimakan Desert, the Australian Desert, and the Arabian Desert, which are consistent with the results of Kim et al. (2013) at the global scale and the results Zhao et al. (2013) obtained with the chemical Weather Research and Forecasting model (WRF-Chem).
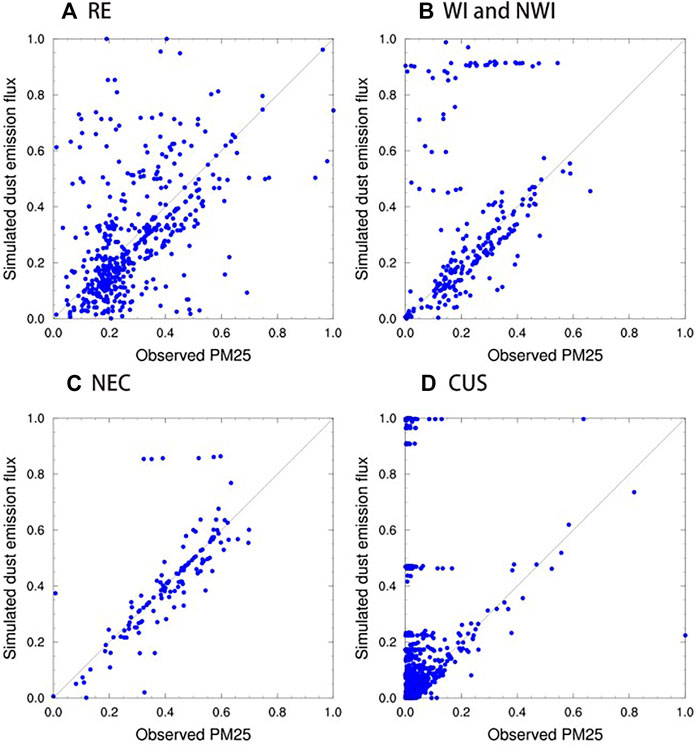
FIGURE 9. Scatter plot of the linear correlation between PM2.5 observations (standardized) and simulated dust emission fluxes (standardized). RE represents Russia (46–56°N, 5–50°E); WI and NWI represent western and northwestern India (15–37°N and 68–79°E); NEC represents northeastern China (40–50°N, 110–125°E); CUS represents central United States (35–48°N, 100–122°W).
In addition, the ND emission flux demonstrates an upward trend in the central Sahara Desert, southern Arabian Desert, and Iranian regions (Figure 10). The ND emission fluxes significantly vary from year to year in the desert areas of northwestern China (38–43°N, 78–91°E) from 2001 to 2018, with the maximum value exceeding 500 μg m−2 s−1 and the minimum value reaching approximately 100 μg m−2 s−1. And the ND emission fluxes in this region reveal a significant downward trend except in winter, at a rate of decline up to -45.8 μg m−2 s−1/decade in spring, and an upward trend in winter, at an increase rate of 15.8 μg m−2 s−1/decade. From 2004 to 2015, the Kubuqi Desert, China’s seventh largest desert, has entered the stage of regularization, scientific, and large-scale sand control and afforestation (Wang and Yang, 2018). During this stage, afforestation technology has been greatly improved and the effect of sand control has been significant, and the vegetation cover has increased from 3–5% in 1988 to 53% in 2016.
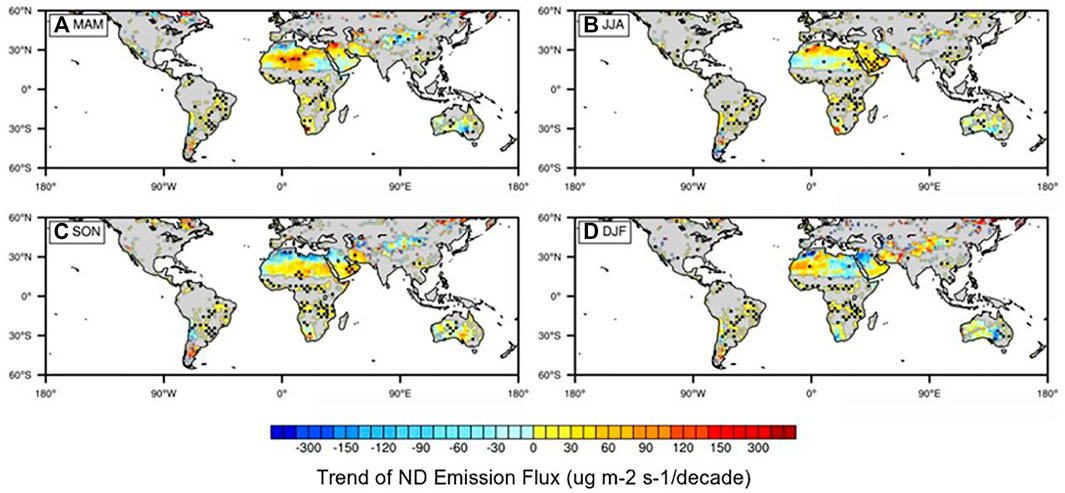
FIGURE 10. Same as Figure 5 of trend of the ND emission flux (units: μg m−2 s−1/decade).
The AD emission fluxes exhibit a decreasing trend in northern and northwestern China, central and northern United States, and western and northwestern India and an increasing trend in southern Russia and northern Kazakhstan (Figure 11). The AD emission flux shows a decreasing trend in northern and northwestern China, with the highest rate of decline in winter, reaching -74.9 μg m−2 s−1/decade. The AD emission flux in southern Russia and northern Kazakhstan during 2001–2018 demonstrates an upward trend in the rest of the seasons, at a rate of 26.0 ± 2.0 μg m−2 s−1/decade, except in summer when it remains basically unchanged.
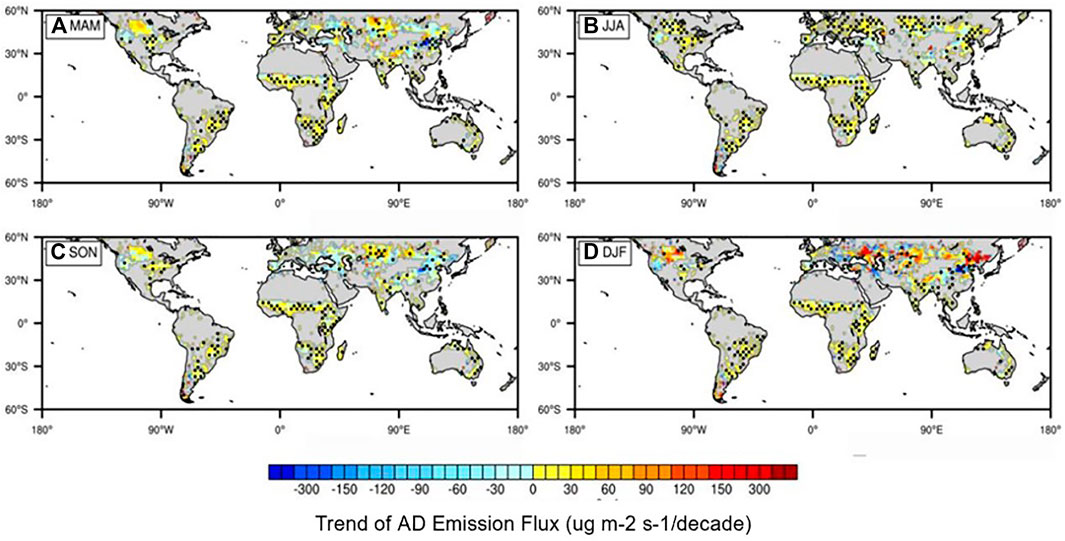
FIGURE 11. Same as Figure 5 of trend of the AD emission flux (units: μg m−2 s−1/decade).
Discussion and Conclusion
The static dust source function ignores the seasonal and interannual variations in the surface bareness during dust modeling, which leads to large uncertainties in the simulated dust emission fluxes. To quantitatively assess the temporal and spatial evolution features of the ND and AD sources surface bareness and emission flux, this study constructs ND and AD emission schemes based on the global dynamic surface bareness obtained from the NDVI dataset and the wind speed at 10 m obtained from ERA-Interim to simulate the ND and AD sources bareness and emission distribution characteristics and evolution trends at the global scale during 2001–2018.
By constructing a dynamic dust source function in this study, we found that the surface bareness of ND sources and AD sources showed different characteristics with space and time changes. The ND emissions originate from areas where the cover type includes open shrublands, savannas, and barren or sparsely vegetated areas, largely in northern Africa, the Arabian Islands, Iran, Northwest China, Turkmenistan, Uzbekistan, southern Kazakhstan, northeast Canada, etc. The ND sources are densely distributed, and the seasonal variations are not obvious. The AD sources mainly comprise areas containing grasslands, croplands, and cropland/natural vegetation mosaic areas, mostly in southern Russia, northern and northwestern China, central United States, and a narrow area in the south of the Sahara Desert. The AD source surface bareness is scattered and exhibits an obvious seasonal variability, which decreases during warm seasons.
The trend of the ND sources is not obvious at the global scale. The bareness reveals a decreasing trend in the desert areas of northwestern China with a decrease rate of up to −0.01/decade. Additionally, a decreasing trend is found along the edge of the Sahara Desert, the Australian Desert, the Arabian Desert, the Lute Desert, and the Karakum Desert. It is noted that the AD sources exhibit an increasing trend in southern Russia and Kazakhstan, northern United States, and southern Canada and a decreasing trend in northern and northwestern China, western and northwestern India, the southern side of the Sahara Desert, and the central United States. In particular, a decreasing trend of the AD surface bareness is shown in northern and northwestern China, at the rate of −0.04/decade.
Dust aerosols play an important role in the radiation budget and hydrological cycle. The current dust emission schemes can be divided into empirical dust emission scheme, dust emission scheme based on simplified physical process, or the detailed microphysical process. Although the empirical dust emission scheme is simple in form, the relationship between the applied dust emission rate and the critical friction velocity is not reasonable. And it is very difficult to truly estimate the coefficients, critical friction velocity, and dust mass fraction in actual simulation. In addition, due to the current difficulties in obtaining large-scale soil and surface data, especially soil plastic pressure and parent soil particle size distributions, the application of detailed microphysical dust emission schemes is also limited. In addition, a major and critical problem faced by the empirical dust emission and the detailed microphysical dust emission scheme is the lack of direct dust flux data for model verification. With the development of dust observation technology, especially the application of satellites, large-area continuous dust emission monitoring has become possible. This makes it possible to apply satellite data to correct and constrain the dust emission scheme of simple physical processes to show great advantages compared to the empirical and detailed microphysical dust emission scheme. The simplified MB scheme of simplified physical process with complexity between the two extremes focuses on the movement of dust, considers the dependence of dust emission on soil characteristics in the source parameterization, and greatly reduces the uncertainty of inversion of dust emission flux. In addition, the input parameter data of the simplified MB scheme is easier to obtain and is more suitable for global dust emission simulations.
The high-value ND areas are primarily located in the Sahara Desert, the deserts of the Arabian Peninsula, the Karakum Desert, desert in northern China, the Australian Desert, and other large desert areas, and the ND emission flux reaches a maximum of 50 μg m−2 s−1. Due to the small size of the AD sources, the diversity of subsurface types, the high spatiotemporal dynamic variability, and the need for extensive sampling and basic research, a high uncertainty exists in the study of AD. Compared to the ND sources, the distribution of the AD sources is more scattered and exhibits obvious seasonal variations, especially in winter and spring, and the surface bareness is much higher than that in summer and autumn. The AD emission fluxes exhibit a significant seasonal variation, and the distribution area is larger in winter and spring than that in summer and autumn. The AD sources occur due to wind-driven erosion caused by human disturbances. This kind of human disturbance mostly occurs in grassland, farmland, and other areas with a large bare surface area, while plant crop growth experiences a certain seasonality with the regional climate, resulting in the distribution of the AD emissions being relatively scattered and exhibiting certain seasonal variation characteristics.
The study of dust emission flux is a challenging job. There is an urgent need to advance our understanding of the physical process of dust emission using a variety of new observational techniques, new model schemes, and new theories. There are several uncertainties in this case study. (1) In the calculation of the AD emission fluxes, we apply a simplified MB model. Although the key variables required are easily accessible during the simulation, certain factors remain that influence the accuracy of the simulation results. (2) AD refers to the dust originating from the wind erosion of surfaces exposed through human disturbance (e.g., deforestation, farmland cultivation, and grassland grazing) without considering the direct dust generated by human activities (such as traffic activity and urban construction). The term human disturbance is not yet fully defined, and certain human disturbances cannot be fully considered in the dust emission calculations in this study. (3) The process of wind erosion is influenced not only by the wind field and surface bareness of the discharge source area but also by many other climatic fields, such as ground moisture, which are closely related to meteorological conditions such as precipitation. (4) The impact of surface roughness on the critical wind friction velocity of dust emissions is not considered, which may cause the surface of vegetation and the ground with similar NDVI to have the same effect on the critical wind friction velocity. In addition, the impact of snow accumulation needs to be eliminated.
The process of dust emission is controlled by global climate change, and in turn, AD greatly warms the atmosphere through accumulation, strengthens atmospheric circulation, and alters the regional precipitation efficiency, thereby affecting climate change. Therefore, the complex effects of AD on the regional climate should be further studied in the future. Additionally, studies should be conducted to construct more comprehensive AD deposition schemes, assimilate ground station observations with satellite observations, and combine these with WRF-Chem to more accurately simulate AD emissions. Moreover, the interaction between AD and climate change should be examined to better protect ecosystem functioning and human health.
Data Availability Statement
The raw data supporting the conclusions of this article will be made available by the authors, without undue reservation.
Author Contributions
SyC and ZW contributed to conception and design of the study. ZW and CL organized the database, performed the statistical analysis and wrote the first draft of the manuscript. SyC wrote sections of the manuscript. YC, YG, and SlC participated in the revision of the article format. All authors contributed to manuscript revision, read, and approved the submitted version.
Funding
This work was supported by the National Natural Science Foundation of China (grant numbers 91837103, 42175106), and Fundamental Research Funds for the Central Universities (grant numbers Lzujbky-2020-ct03), and Fudan University-Tibet University Joint Laboratory for Biodiversity and Global Change.
Conflict of Interest
The authors declare that the research was conducted in the absence of any commercial or financial relationships that could be construed as a potential conflict of interest.
Publisher’s Note
All claims expressed in this article are solely those of the authors and do not necessarily represent those of their affiliated organizations, or those of the publisher, the editors, and the reviewers. Any product that may be evaluated in this article, or claim that may be made by its manufacturer, is not guaranteed or endorsed by the publisher.
Acknowledgments
This NDVI dataset is available at https://ladsweb.modaps.eosdis.nasa.gov/. These landcover datasets are available at https://ladsweb.modaps.eosdis.nasa.gov/. ERA-interim datasets are available at https://apps.ecmwf.int/datasets/data/interim-full-daily/levtype=sfc/.
Supplementary Material
The Supplementary Material for this article can be found online at: https://www.frontiersin.org/articles/10.3389/feart.2022.802658/full#supplementary-material
References
Alfaro, S. C., and Gomes, L. (2001). Modeling mineral Aerosol Production by Wind Erosion: Emission Intensities and Aerosol Size Distributions in Source Areas. J. Geophys. Res. 106 (D16), 18075–18084. doi:10.1029/2000JD900339
Bradley, B. A., and Mustard, J. F. (2005). Identifying Land Cover Variability Distinct from Land Cover Change: Cheatgrass in the Great Basin. Remote sensing Environ. 94 (2), 204–213. doi:10.1016/j.rse.2004.08.016
Brown, M. E., Pinzon, J. E., Didan, K., Morisette, J. T., and Tucker, C. J. (2006). Evaluation of the Consistency of Long-Term NDVI Time Series Derived from AVHRR,SPOT-vegetation, SeaWiFS, MODIS, and Landsat ETM+ Sensors. IEEE Trans. Geosci. Remote Sensing 44 (7), 1787–1793. doi:10.1109/TGRS.2005.860205
Cakmur, R. V., Miller, R. L., and Torres, O. (2004). Incorporating the Effect of Small-Scale Circulations upon Dust Emission in an Atmospheric General Circulation Model. J. Geophys. Res. 109, D0720. doi:10.1029/2003JD004067
Che, H., Qi, B., Zhao, H., Xia, X., Eck, T. F., Goloub, P., et al. (2018). Aerosol Optical Properties and Direct Radiative Forcing Based on Measurements from the China Aerosol Remote Sensing Network (CARSNET) in Eastern China. Atmos. Chem. Phys. 18 (1), 405–425. doi:10.5194/acp-18-405-2018
Chen, C., Park, T., Wang, X., Piao, S., Xu, B., Chaturvedi, R. K., et al. (2019). China and India lead in Greening of the World through Land-Use Management. Nat. Sustain. 2 (2), 122–129. doi:10.1038/s41893-019-0220-7
Chen, S., Bi, H., Zhang, R., Wang, Y., Guo, J., Zhao, D., et al. (2021). Impact of Dust-Cloud-Radiation Interactions on Surface Albedo: a Case Study of 'Tiramisu' Snow in Urumqi, China. Environ. Res. Lett. 17, 015001–019326. doi:10.1088/1748-9326/ac3b18
Chen, S., Huang, J., Li, J., Jia, R., Jiang, N., Kang, L., et al. (2017a). Comparison of Dust Emissions, Transport, and Deposition between the Taklimakan Desert and Gobi Desert from 2007 to 2011. Sci. China Earth Sci. 60 (7), 1338–1355. doi:10.1007/s11430-016-9051-0
Chen, S., Huang, J., Qian, Y., Zhao, C., Kang, L., Yang, B., et al. (2017b). An Overview of mineral Dust Modeling over East Asia. J. Meteorol. Res. 31 (4), 633–653. doi:10.1007/s13351-017-6142-2
Chen, S., Huang, J., Zhao, C., Qian, Y., Leung, L. R., and Yang, B. (2013). Modeling the Transport and Radiative Forcing of Taklimakan Dust over the Tibetan Plateau: A Case Study in the Summer of 2006. J. Geophys. Res. Atmos. 118 (2), 797–812. doi:10.1002/jgrd.50122
Chen, S., Jiang, N., Huang, J., Xu, X., Zhang, H., Zang, Z., et al. (2018). Quantifying Contributions of Natural and Anthropogenic Dust Emission from Different Climatic Regions. Atmos. Environ. 191, 94–104. doi:10.1016/j.atmosenv.2018.07.043
Chen, S., Jiang, N., Huang, J., Zang, Z., Guan, X., Ma, X., et al. (2019a). Estimations of Indirect and Direct Anthropogenic Dust Emission at the Global Scale. Atmos. Environ. 200, 50–60. doi:10.1016/j.atmosenv.2018.11.063
Chen, S., Zhang, X., Lin, J., Huang, J., Zhao, D., Yuan, T., et al. (2019b). Fugitive Road Dust PM2.5 Emissions and Their Potential Health Impacts. Environ. Sci. Technol. 53 (14), 8455–8465. doi:10.1021/acs.est.9b00666
Chen, S., Zhao, C., Qian, Y., Leung, L. R., Huang, J., Huang, Z., et al. (2014). Regional Modeling of Dust Mass Balance and Radiative Forcing over East Asia Using WRF-Chem. Aeolian Res. 15, 15–30. doi:10.1016/j.aeolia.2014.02.001
Chomette, O., Legrand, M., and Marticorena, B. (1999). Determination of the Wind Speed Threshold for the Emission of Desert Dust Using Satellite Remote Sensing in the thermal Infrared. J. Geophys. Res. 104 (D24), 31207–31215. doi:10.1029/1999jd900756
Cook, B. I., Miller, R. L., and Seager, R. (2009). Amplification of the North American "Dust Bowl" Drought through Human-Induced Land Degradation. Proc. Natl. Acad. Sci. 106 (13), 4997–5001. doi:10.1073/pnas.0810200106
Du, H., Wang, T., Xue, X., and Li, S. (2019). Estimation of Soil Organic Carbon, Nitrogen, and Phosphorus Losses Induced by Wind Erosion in Northern China. Land Degrad. Dev. 30 (8), 1006–1022. doi:10.1002/ldr.3288
Evan, A. T., Flamant, C., Gaetani, M., and Guichard, F. (2016). The Past, Present and Future of African Dust. Nature 531 (7595), 493–495. doi:10.1038/nature17149
Genthon, C. (1992). Simulations of Desert Dust and Sea-Salt Aerosols in Antarctica with a General Circulation Model of the Atmosphere. Tellus B 44 (4), 371–389. doi:10.3402/tellusb.v44i4.15464
Gillette, D. A., Fryrear, D. W., Gill, T. E., Ley, T., Cahill, T. A., and Gearhart, E. A. (1997). Relation of Vertical Flux of Particles Smaller Than 10 μm to Total Aeolian Horizontal Mass Flux at Owens Lake. J. Geophys. Res. 102 (D22), 26009–26015. doi:10.1029/97JD02252
Gillette, D. A., and Passi, R. (1988). Modeling Dust Emission Caused by Wind Erosion. J. Geophys. Res. 93 (D11), 14233–14242. doi:10.1029/JD093iD11p14233
Ginoux, P., Chin, M., Tegen, I., Prospero, J. M., Holben, B., Dubovik, O., et al. (2001). Sources and Distributions of Dust Aerosols Simulated with the GOCART Model. J. Geophys. Res. 106 (D17), 20255–20273. doi:10.1029/2000JD000053
Han, Y., Wang, K., Liu, F., Zhao, T., Yin, Y., Duan, J., et al. (2016). The Contribution of Dust Devils and Dusty Plumes to the Aerosol Budget in Western China. Atmos. Environ. 126, 21–27. doi:10.1016/j.atmosenv.2015.11.025
Han, Z. (2010). Direct Radiative Effect of Aerosols over East Asia with a Regional Coupled Climate/chemistry Model. metz 19 (3), 287–298. doi:10.1127/0941-2948/2010/0461
Han, Z., Ueda, H., Matsuda, K., Zhang, R. J., Arao, K., Kanai, Y., et al. (2004). Model Study on Particle Size Segregation and Deposition during Asian Dust Events in March 2002. J. Geophys. Res. 109 (D19), 205. doi:10.1029/2004JD004920
Helgren, D. M., and Prospero, J. M. (1987). Wind Velocities Associated with Dust Deflation Events in the Western Sahara. J. Clim. Appl. Meteorol. 26, 1147–1151. doi:10.1175/1520-0450(1987)026<1147:wvawdd>2.0.co;2
Huang, J. P., Liu, J. J., Chen, B., and Nasiri, S. L. (2015). Detection of Anthropogenic Dust Using CALIPSO Lidar Measurements. Atmos. Chem. Phys. 15 (20), 11653–11665. doi:10.5194/acp-15-11653-2015
Huneeus, N., Schulz, M., Balkanski, Y., Griesfeller, J., Prospero, J., Kinne, S., et al. (2010). Global Dust Model Intercomparison in AeroCom Phase I. Atmos. Chem. Phys. 11 (15), 7781–7816. doi:10.5194/acp-11-7781-2011
Jia, R., Liu, Y., Chen, B., Zhang, Z., and Huang, J. (2015). Source and Transportation of Summer Dust over the Tibetan Plateau. Atmos. Environ. 123, 210–219. doi:10.1016/j.atmosenv.2015.10.038
Joussaume, S., and Jouzel, J. (1993). Paleoclimatic Tracers: An Investigation Using an Atmospheric General Circulation Model under Ice Age Conditions: 1. Desert Dust. J. Geophys. Res. 98 (D2), 2767–2805. doi:10.1029/92JD01921
Joussaume, S. (1990). Three-dimensional Simulations of the Atmospheric Cycle of Desert Dust Particles Using a General Circulation Model. J. Geophys. Res. 95 (D2), 1909–1941. doi:10.1029/JD095iD02p01909
Kim, D., Chin, M., Bian, H., Tan, Q., Brown, M. E., Zheng, T., et al. (2013). The Effect of the Dynamic Surface Bareness on Dust Source Function, Emission, and Distribution. J. Geophys. Res. Atmos. 118 (2), 871–886. doi:10.1029/2012JD017907
Kim, D., Chin, M., Kemp, E. M., Tao, Z., Peters-Lidard, C. D., and Ginoux, P. (2017). Development of High-Resolution Dynamic Dust Source Function - A Case Study with a strong Dust Storm in a Regional Model. Atmos. Environ. 159, 11–25. doi:10.1016/j.atmosenv.2017.03.045
Kok, J. F., Mahowald, N. M., Albani, S., Fratini, G., Gillies, J. A., Ishizuka, M., et al. (2014). An Improved Dust Emission Model with Insights into the Global Dust Cycle's Climate Sensitivity. Atmos. Chem. Phys. 14 (5), 6361–6425. doi:10.5194/acpd-14-6361-2014
Largeron, Y., Guichard, F., Bouniol, D., Couvreux, F., Kergoat, L., and Marticorena, B. (2015). Can We Use Surface Wind fields from Meteorological Reanalyses for Sahelian Dust Emission Simulations? Geophys. Res. Lett. 42 (7), 2490–2499. doi:10.1002/2014GL062938
Liu, D., Zhao, T., Boiyo, R., Chen, S., Lu, Z., Wu, Y., et al. (2019). Vertical Structures of Dust Aerosols over East Asia Based on CALIPSO Retrievals. Remote Sensing 11 (6), 701. doi:10.3390/rs11060701
Liu, Y., Hua, S., Jia, R., and Huang, J. (2019a). Effect of Aerosols on the Ice Cloud Properties over the Tibetan Plateau. J. Geophys. Res. Atmos. 124, 9594–9608. doi:10.1029/2019JD030463
Liu, Y., Zhu, Q., Huang, J., Hua, S., and Jia, R. (2019b). Impact of Dust-Polluted Convective Clouds over the Tibetan Plateau on Downstream Precipitation. Atmos. Environ. 209, 67–77. doi:10.1016/j.atmosenv.2019.04.001
Liu, Y., Huang, J., Shi, G., Takamura, T., Khatri, P., Bi, J., et al. (2011). Aerosol Optical Properties and Radiative Effect Determined from Sky-Radiometer over Loess Plateau of Northwest China. Atmos. Chem. Phys. 11 (252), 11455–11463. doi:10.5194/acp-11-11455-2011
Mahowald, N., Kohfeld, K., Hansson, M., Balkanski, Y., Harrison, S. P., Prentice, I. C., et al. (1999). Dust Sources and Deposition during the Last Glacial Maximum and Current Climate: a Comparison of Model Results with Paleodata from Ice Cores and marine Sediments. J. Geophys. Res. 104 (D13), 15895–15916. doi:10.1029/1999JD900084
Mao, R., Gong, D., Bao, J., and Fan, Y. (2011). Possible Influence of Arctic Oscillation on Dust Storm Frequency in North China. J. Geogr. Sci. 21 (02), 207–218. doi:10.1007/s11442-011-0839-4
Marsham, J. H., Knippertz, P., Dixon, N. S., Parker, D. J., and Lister, G. M. S. (2011). The Importance of the Representation of Deep Convection for Modeled Dust-Generating Winds over West Africa during Summer. Geophys. Res. Lett. 38 (16), L16803–L16808. doi:10.1029/2011GL048368
Marticorena, B., Bergametti, G., Aumont, B., Callot, Y., N'Doumé, C., and Legrand, M. (1997). Modeling the Atmospheric Dust Cycle: 2. Simulation of Saharan Dust Sources. J. Geophys. Res. 102 (D4), 4387–4404. doi:10.1029/96JD02964
Marticorena, B., and Bergametti, G. (1995). Modeling the Atmospheric Dust Cycle: 1. Design of a Soil-Derived Dust Emission Scheme. J. Geophys. Res. 100 (D8), 16415–16430. doi:10.1029/95JD00690
Meiyappan, P., Dalton, M., O’Neill, B. C., and Jain, A. K. (2014). Spatial Modeling of Agricultural Land Use Change at Global Scale. Ecol. Model. 291, 152–174. doi:10.1016/j.ecolmodel.2014.07.027
Munkhtsetseg, E., Shinoda, M., Ishizuka, M., Mikami, M., Kimura, R., and Nikolich, G. (2017). A Livestock Trampling Function for Potential Emission Rate of Wind-Blown Dust in a Mongolian Temperate Grassland. Atmos. Chem. Phys. 1–27. doi:10.5194/acp-2017-94
Neff, J. C., Ballantyne, A. P., Farmer, G. L., Mahowald, N. M., Conroy, J. L., Landry, C. C., et al. (2008). Increasing Eolian Dust Deposition in the Western United States Linked to Human Activity. Nat. Geosci 1 (3), 189–195. doi:10.1038/ngeo133
Nickling, W. G., McTainsh, G. H., and Leys, J. F. (1999). Dust Emissions from the Channel Country of Western Queensland, Australia. Z. Geomorphol. Suppl 116, 1–17.
Orlove, B. (2005). Human Adaptation to Climate Change: a Review of Three Historical Cases and Some General Perspectives. Environ. Sci. Pol. 8 (6), 589–600. doi:10.1016/j.envsci.2005.06.009
Penner, J. E., Charlson, R. J., Hales, J. M., Laulainen, N. S., Leifer, R., Novakov, T., et al. (1994). Quantifying and Minimizing Uncertainty of Climate Forcing by Anthropogenic Aerosols. Bull. Am. Meteorol. Soc. 75 (3), 380–400. doi:10.1175/1520-0477(1994)075<0375:qamuoc>2.0.co;2
Perlwitz, J., Tegen, I., and Miller, R. L. (2001). Interactive Soil Dust Aerosol Model in the GISS GCM: 1. Sensitivity of the Soil Dust Cycle to Radiative Properties of Soil Dust Aerosols. J. Geophys. Res. 106 (D16), 18167–18192. doi:10.1029/2000JD900668
Qin, K., Wu, L., Wong, M. S., Letu, H., Hu, M., Lang, H., et al. (2016). Trans-boundary Aerosol Transport during a winter Haze Episode in China Revealed by Ground-Based Lidar and CALIPSO Satellite. Atmos. Environ. 141, 20–29. doi:10.1016/j.atmosenv.2016.06.042
Reynolds, R. L., Yount, J. C., Reheis, M., Goldstein, H., Chavez, P., Fulton, R., et al. (2007). Dust Emission from Wet and Dry Playas in the Mojave Desert, USA. Earth Surf. Process. Landforms 32 (12), 1811–1827. doi:10.1002/esp.1515
Schulz, M., Balkanski, Y. J., Guelle, W., and Dulac, F. (1998). Role of Aerosol Size Distribution and Source Location in a Three-Dimensional Simulation of a Saharan Dust Episode Tested against Satellite-Derived Optical Thickness. J. Geophys. Res. 103 (D9), 10579–10592. doi:10.1029/97JD02779
Shao, Y. (2001). A Model for mineral Dust Emission. J. Geophys. Res. 106 (D17), 20239–20254. doi:10.1029/2001JD900171
Shao, Y. (2004). Simplification of a dust emission scheme and comparison with data. J. Geophys. Res. Atmos. 109 (10), 1–6. doi:10.1029/2003JD004372
Shao, Y., and Dong, C. H. (2006). A Review on East Asian Dust Storm Climate, Modelling and Monitoring. Glob. Planet. Change 52 (1-4), 1–22. doi:10.1016/j.gloplacha.2006.02.011
Shao, Y., Wyrwoll, K.-H., Chappell, A., Huang, J., LinMcTainsh, Z. G. H., McTainsh, G. H., et al. (2011a). Dust Cycle: An Emerging Core Theme in Earth System Science. Aeolian Res. 2 (4), 181–204. doi:10.1016/j.aeolia.2011.02.001
Shao, Y., Ishizuka, M., Mikami, M., and Leys, J. F. (2011b). Parameterization of Size-Resolved Dust Emission and Validation with Measurements. J. Geophys. Res. 116 (8), 1–9. doi:10.1029/2010JD014527
Shao, Y., Raupach, M., and Leys, J. (1996). A Model for Predicting Aeolian Sand Drift and Dust Entrainment on Scales from Paddock to Region. Soil Res. 34 (3), 309–342. doi:10.1071/SR9960309
Sugimoto, N., Uno, I., Nishikawa, M., Shimizu, A., Matsui, I., Dong, X., et al. (2003). Record Heavy Asian Dust in Beijing in 2002: Observations and Model Analysis of Recent Events. Geophys. Res. Lett. 30 (12), 1640. doi:10.1029/2002GL016349
Tegen, I., and Fung, I. (1995). Contribution to the Atmospheric mineral Aerosol Load from Land Surface Modification. J. Geophys. Res. 100 (D9), 18707–18726. doi:10.1029/95JD02051
Tegen, I., and Fung, I. (1994). Modeling of mineral Dust in the Atmosphere: Sources, Transport, and Optical Thickness. J. Geophys. Res. 99 (D11), 22897–22914. doi:10.1029/94JD01928
Tegen, I., Werner, M., Harrison, S. P., and Kohfeld, K. E. (2004). Relative Importance of Climate and Land Use in Determining Present and Future Global Soil Dust Emission. Geophys. Res. Lett. 31 (5), 1–4. doi:10.1029/2003GL019216
Wang, R., and Yang, G. L. (2018). Evaluation of Ecological Benefit of Combating Desertification in East Edge of Hobq Desert. Bull. Soil Water Conservation 38 (5), 174–179 (in Chinese). doi:10.13961/j.cnki.stbctb.2018.05.028
Wang, X., Dickinson, R. E., Su, L., Zhou, C., and Wang, K. (2018). PM2.5 Pollution in China and How it Has Been Exacerbated by Terrain and Meteorological Conditions. Bull. Am. Meteorol. Soc. 99 (1), 105–119. doi:10.1175/BAMS-D-16-0301.1
Wang, Z., Ueda, H., and Huang, M. (2000). A Deflation Module for Use in Modeling Long-Range Transport of Yellow Sand over East Asia. J. Geophys. Res. 105 (D22), 26947–26959. doi:10.1029/2000JD900370
Westphal, D. L., Toon, O. B., and Carlson, T. N. (1988). A Case Study of Mobilization and Transport of Saharan Dust. J. Atmos. Sci. 45 (15), 2145–2175. doi:10.1175/1520-0469(1988)045<2145:acsoma>2.0.co;2
Woodward, S. (2001). Modeling the Atmospheric Life Cycle and Radiative Impact of mineral Dust in the Hadley Centre Climate Model. J. Geophys. Res. 106 (D16), 18155–18166. doi:10.1029/2000JD900795
Xi, X., and Sokolik, I. N. (2016). Quantifying the Anthropogenic Dust Emission from Agricultural Land Use and Desiccation of the Aral Sea in Central Asia. J. Geophys. Res. Atmos. 121 (20), 12270–12281. doi:10.1002/2016JD025556
Xia, W., Wang, Y., Chen, S., Huang, J., Wang, B., Zhang, G. J., et al. (2021). Double Trouble of Air Pollution by Anthropogenic Dust. Environ. Sci. Technol. 56 (2), 761–769. doi:10.1021/acs.est.1c04779
Yang, X. H., He, Q., and Mamtimin, A. (2010). Dust Emission by Wind Erosion in Spring and Summer at Tazhong of Taklimakan Desert. Chin. desert 30 (04), 770–776. (in Chinese).
Zender, C. S., Bian, H. S., and Newman, D. (2003). Mineral Dust Entrainment and Deposition (DEAD) Model: Description and 1990s Dust Climatology. J. Geophys. Res. 108 (D14), 4416. doi:10.1029/2002JD002775
Zhao, C., Chen, S., Leung, L. R., Qian, Y., Kok, J. F., Zaveri, R. A., et al. (2013). Uncertainty in Modeling Dust Mass Balance and Radiative Forcing from Size Parameterization. Atmos. Chem. Phys. 13 (21), 10733–10753. doi:10.5194/acp-13-10733-2013
Zhao, C., Liu, X., Leung, L. R., Johnson, B., McFarlane, S. A., Gustafson, W. I., et al. (2010). The Spatial Distribution of mineral Dust and its Shortwave Radiative Forcing over North Africa: Modeling Sensitivities to Dust Emissions and Aerosol Size Treatments. Atmos. Chem. Phys. 10 (18), 8821–8838. doi:10.5194/acp-10-8821-2010
Keywords: dust emission, dust emission scheme, dynamic dust sources, anthropogenic dust, natural dust
Citation: Wang Z, Chen S, Liu C, Chen Y, Gong Y and Cheng S (2022) Dynamic Dust Source Regions and the Associated Natural and Anthropogenic Dust Emissions at the Global Scale. Front. Earth Sci. 10:802658. doi: 10.3389/feart.2022.802658
Received: 27 October 2021; Accepted: 03 January 2022;
Published: 21 February 2022.
Edited by:
Jane Liu, University of Toronto, CanadaReviewed by:
Tianliang Zhao, Nanjing University of Information Science and Technology, ChinaJose M. Baldasano, Universitat Politecnica de Catalunya, Spain
Copyright © 2022 Wang, Chen, Liu, Chen, Gong and Cheng. This is an open-access article distributed under the terms of the Creative Commons Attribution License (CC BY). The use, distribution or reproduction in other forums is permitted, provided the original author(s) and the copyright owner(s) are credited and that the original publication in this journal is cited, in accordance with accepted academic practice. No use, distribution or reproduction is permitted which does not comply with these terms.
*Correspondence: Siyu Chen, chensiyu@lzu.edu.cn