A Bayesian Approach to Inferring Depositional Ages Applied to a Late Tonian Reference Section in Svalbard
 Galen P. Halverson
 Chen Shen1
  Joshua H. F. L. Davies
 Lei Wu
- 1Department of Earth and Planetary Sciences/Geotop, McGill University, Montréal, QC, Canada
- 2Département des Sciences de La Terre et L’atmosphere/Geotop, Université Du Québec à Montréal, Montréal, QC, Canada
Increasing application of high precision uranium-lead (U-Pb) and rhenium-osmium (Re-Os) geochronology to the ancient geological record has resulted in massive improvement in age control and calibration of key Proterozoic stratigraphic successions and events. Nevertheless, some successions and time intervals remain poorly dated. Insufficient age constraints are particularly problematic for successions that are otherwise rich in geochemical, fossil, or other data with high potential to illuminate our understanding of Proterozoic Earth history. The latter Tonian succession in northeastern Svalbard is one such example. The ca. 820–740 Ma Akademikerbreen and lowermost Polarisbreen groups contain important microfossils and well-established carbon- and strontium-isotopic records, but they remain poorly dated. Here we use radioisotopic dates correlated from other Tonian successions across the globe using carbon isotope chemostratigraphy to calibrate a Tonian composite section in Svalbard by integrating Bayesian inference with a simple 1D thermal subsidence model. This approach allows us to assign realistic ages and uncertainties to all stratigraphic heights in a Akademikerbreen-lower Polarisbreen composite reference section. For example, the Bayesian age-height model yields ages for the onset and end of the Bitter Springs negative carbon isotope anomaly of 808.7 +3.3/−3.5 Ma and 801.9 +3.2/−3.3 Ma, respectively, and a total duration of 6.9 ± 0.2 Ma. These age and duration estimates can be applied to calibrate other Tonian successions that capture the Bitter Springs anomaly assuming that this anomaly is globally correlative.
Introduction
Accurate and precise geological ages are foundational to the Earth sciences, and advances in many different radioisotopic systems have dramatically improved our ability to date geological materials. In combination with other chronostratigraphic methods, such as astrochronology, magnetostratigraphy, biostratigraphy, and chemostratigraphy, improvements and wider application of radioisotopic dating have resulted in unprecedent temporal calibration of the Geologic Time Scale (Gradstein, 2020). Nevertheless, many gaps remain, and techniques for inferring ages where no or few direct radioisotopic dates are available remain essential for many purposes. This necessity is perhaps most acute in sedimentary successions where appropriate lithologies for radioisotopic dating, such as volcanic tuffs, are rare or absent. Other chronostratigraphic techniques help, but developing reliable age models becomes increasingly challenging with older strata, particularly in the Precambrian for which biostratigraphy and magnetostratigraphy are mostly unviable. Nevertheless, stratigraphic age models are essential for many purposes, such as correlating global geological, biological, and geochemical events and testing hypotheses for their causes (Reiners et al., 2018).
The simplest method to infer depositional ages between dated stratigraphic levels is to interpolate linearly, assuming a constant sediment accumulation rate. While straightforward, this and other interpolation approaches have many shortcomings, notably that they disregard or fail to fully utilize potentially valuable geological information. Furthermore, such interpolation methods typically do not automatically or adequately quantify uncertainties away from the dated stratigraphic levels (Parnell et al., 2011). Uncertainty can be incorporated into the age estimates between dated horizons by applying a Monte Carlo approach to resampling uncertainties in both age and stratigraphic thickness to generate a suite of viable sediment accumulation rates (MacLennan et al., 2018). However, many age modelling approaches, for example those using spline-fitting and linear regression, yield uncertainties between dated horizons that are lower than the actual analytical uncertainties of the original radioisotopic ages, and hence unrealistic (De Vleeschouwer and Parnell, 2014).
One class of age-depth models that is gaining in popularity employs Bayesian statistics to generate more realistic age uncertainties that account for both intrinsic analytical uncertainties and geological information, most importantly the principle of superposition. Distinct advantages of these models are that they generate age uncertainties that increase away from dated horizons while commonly decreasing age uncertainty at the dated horizons themselves due to constraints imposed by other chronostratigraphically proximal ages (Parnell et al., 2011). One widely applied and freely available model is Bchron, which implements variable sediment accumulation rates based on a simple, monotonic sedimentary process driven by a compound Poisson-gamma probability distribution whose parameters are estimated via Markov Chain Monte Carlo (MC-MC) samplers (Haslett and Parnell, 2008; Parnell et al., 2008). Though developed for recent sediments dated mainly by radiocarbon, this and similar models have also been applied to calibrating older sedimentary succession dated mainly by the U-Pb zircon method (e.g., De Vleeschouwer and Parnell, 2014; Trayler et al., 2020; Harrigan et al., 2021). The results are more robust age inferences with more realistic uncertainties. However, these methods are optimized for single stratigraphic sections or well-resolved reference sections with abundant radiometric ages at precisely known stratigraphic levels. For sedimentary successions where ages must be estimated based on correlations or other indirect or imprecise geological constraints, and where the ultimate control on sediment accumulation is not reasonably approximated by a Poisson-gamma sedimentation model, other techniques for developing age-depth models are required (e.g., Johnstone et al., 2019; Lougheed and Obrochta, 2019; Schoene et al., 2019).
Here we develop a stratigraphic age model employing a Bayesian approach that we have applied to a middle–late Tonian carbonate succession in northeastern Svalbard (Akademikerbreen Group and Russøya Member of the Hecla Hoek Series; Figure 1). These strata are exceptionally well preserved, record several key biogeochemical events and fossil first appearances, and make a natural reference section for the latter half of the Tonian Period (Figure 2; Halverson et al., 2018b). Although the succession has only a single direct Re-Os age constraint of 737.5 ± 9.6 Ma from the middle Russøya Member (Millikin et al., in press), ages from other Tonian successions globally can be correlated to the Svalbard succession, with variable degrees of confidence, based on carbon isotope chemostratigraphy (Figures 2, 3). Because this succession spans some 80 million years (ca. 820–740 Ma), long-term sediment accumulation rates are not controlled directly by stochastic sedimentary processes but rather by the generation of new accommodation space. Previous work has shown that the Akademikerbreen Group was deposited in a slowly thermally subsiding intracratonic setting (Maloof et al., 2006; Halverson et al., 2018a, 2018b). Therefore, we have integrated Bayesian inference with a simple 1D uniform stretching thermal subsidence model (e.g., McKenzie, 1978) as a means of generating an age-height model for the Tonian succession in Svalbard. This approach explicitly includes both the full analytical age uncertainties and height uncertainties, which arise due to ambiguity in correlations. The result is an age modeling approach, which while suitable only for certain long-duration stratigraphic successions where sediment accumulation is dominantly controlled by tectonic subsidence, is easily tested and updateable with newly acquired radioisotopic ages.
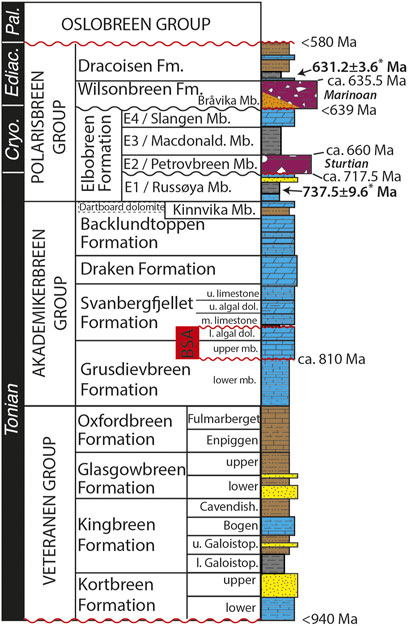
FIGURE 1. Overview of the Neoproterozoic stratigraphy of northeastern Svalbard, based on the established nomenclature for Spitsbergen (following Halverson et al., 2018a). No direct radioisotopic ages are available for the Neoproterozoic strata in Svalbard, except for a maximum age of ca. 940 Ma for the base of the Veteranen Group based on U-Pb zircon ages from underlying volcanics in Nordaustlandet (Johansson et al., 2000; Johansson et al., 2005). Additional age inferences, for example based on correlation of the Petrovbreen Member and Wilsonbreen Formation glaciogenic units with the global Sturtian and Marionan glaciations are discussed in the main text and reviewed in Halverson et al. (2018a). See also Figure 2 for additional ages correlated based on chemostratigraphy. BSA = Bitter Springs Anomaly; Fm = Formation; u = upper; mb = member; dol = dolostone. (*) New Re-Os ages from Millikin et al. (in press).
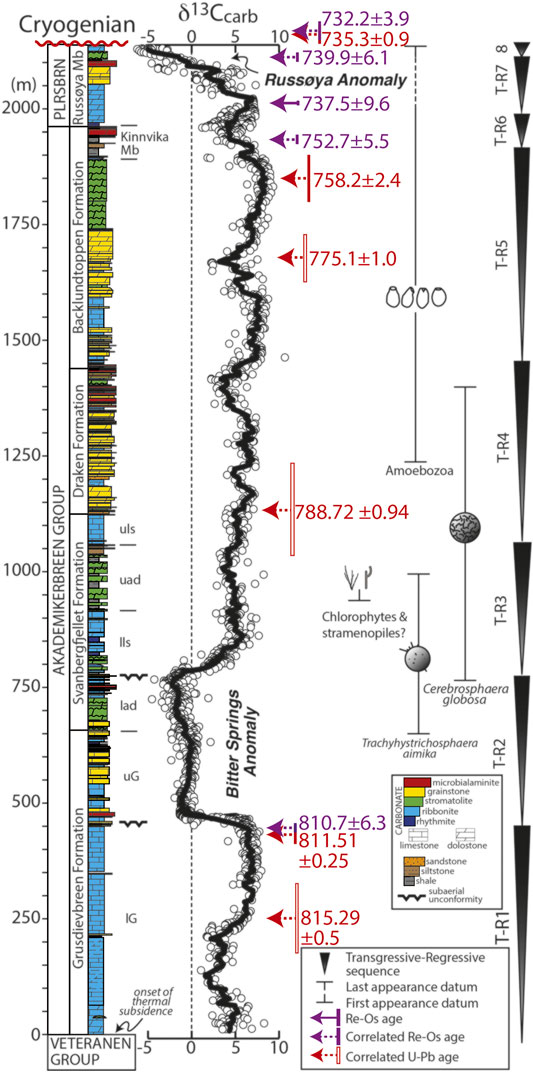
FIGURE 2. A composite stratigraphic column through the Akademikerbreen Group and lower Polarisbreen Group, constructed from multiple separate localities since the entire succession is not preserved in any one section (modified from Halverson et al., 2018a,b). Grey circles represent all available carbonate carbon isotope data for the succession mapped onto the composite stratigraphic column, and the solid line is a local area regression smoothing fit to these data (Supplementary Material for an explanation of the method). Approximate stratigraphic position of radiometric ages (in Ma) that can be confidently correlated into the Akademikerbreen–Russøya section are shown in arrows (Table 1 for sources of data). Vertical bars indicate the assigned uncertainty for these correlations, which are shown in Figure 3. (solid bars are the 95% interval for correlation with inferred normal uncertainty and open bars represent the full range of inferred uniform distributions). Stratigraphic last appearance datums and first appearance datums are for key fossil occurrences in Svalbard (Halverson et al., 2018b for additional context). Transgressive-Regressive (T-R) sequences are from Halverson et al. (2018a).
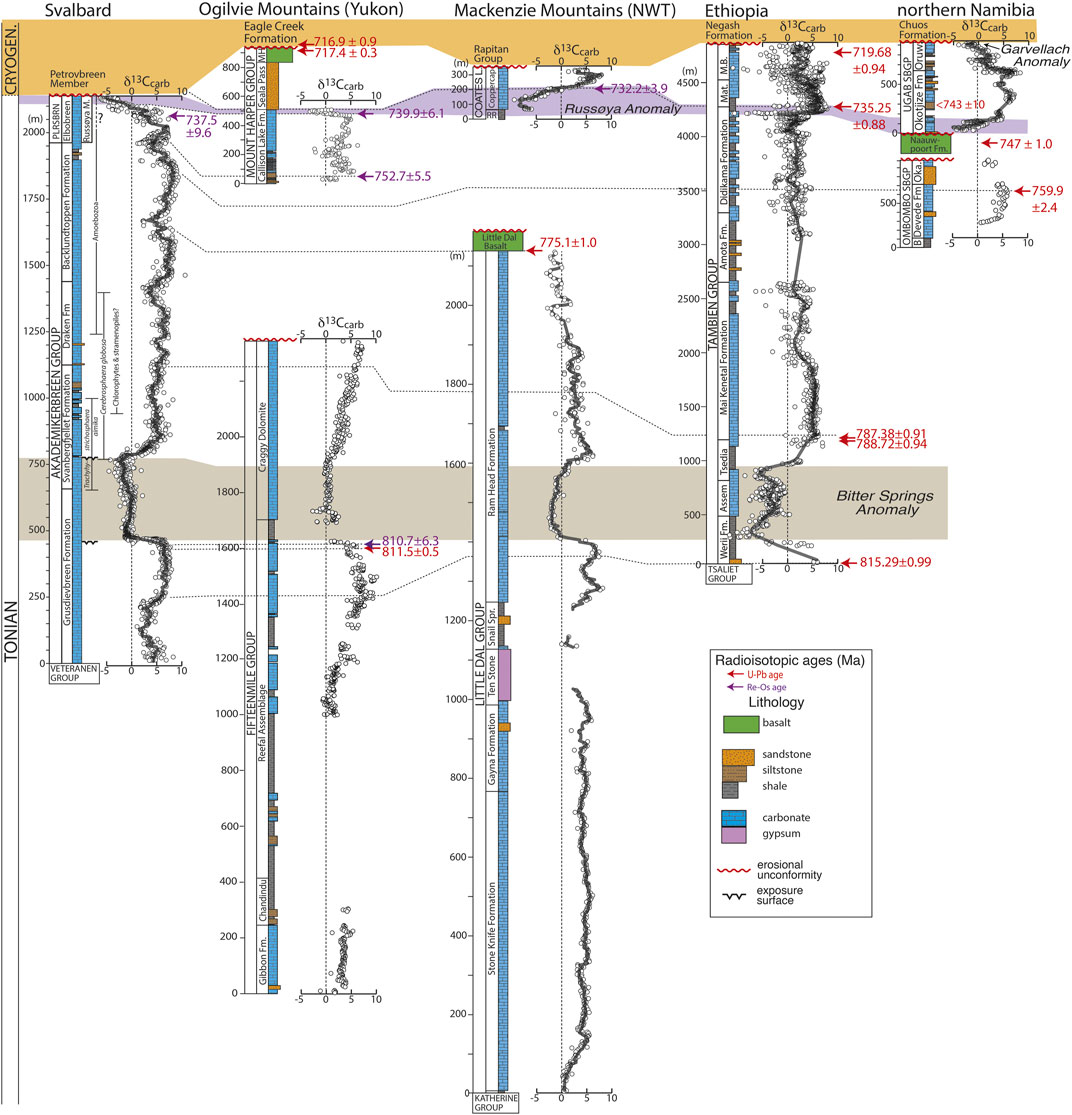
FIGURE 3. Proposed correlations of the Bitter Springs and Russøya anomalies between Svalbard and other Tonian successions containing key radioisotopic ages that are utilized in the age model via chemostratigraphic correlation. Dashed lines show the interpreted correlations to the Svalbard composite reference section from Figure 2. Ogilvie Mountains carbon isotope and stratigraphic data are from Strauss et al. (2014) and Macdonald et al. (2010). Mackenzie Mountains data are from Halverson (2006). Ethiopia data are from a compilation in Park et al. (2020). Namibia data are from Lamothe et al. (2019) and Hoffman et al. (2021). See Table 1 for sources of the ages. Inferred stratigraphic uncertainty of the correlations is shown in Figure 2.
Tonian Stratigraphy and Basin Evolution in Northeastern Svalbard
The Neoproterozoic stratigraphy of northeastern Svalbard has long figured prominently in the reconstruction of late Precambrian Earth history (e.g., Harland, 1964; Fairchild and Hambrey, 1984; Knoll et al., 1986; Halverson et al., 2005; Bao et al., 2009). These rocks are well exposed in nunataks and coastal settings in northeastern Spitsbergen and northwestern Nordaustlandet (Supplementary Figure S1). Although different nomenclature was historically used for the two regions, the close proximity and virtually identical stratigraphy of the so-called Hecla Hoek Series warrants using only a single set of stratigraphic names (Halverson et al., 2018a). Following this single nomenclature, the Neoproterozoic part of the Hecla Hoek Series is subdivided into the Veteranen, Akademikerbreen, and Polarisbreen groups (Figure 1).
The Veteranen Group comprises ∼4.4 km of predominantly siliciclastic rocks, though with some prominent carbonate beds, interpreted to be deposited predominantly in a shallow marine setting (Wilson, 1958; Gibson et al., 2021). Although basin evolution during deposition of the Veteranen Group has not been studied in detail, it is interpreted to record an initial, amagmatic rifting phase in the evolution of the basin that eventually gave rise to a thermal subsidence phase (Maloof et al., 2006; Halverson et al., 2018a; Gibson et al., 2021). In this scenario, the contact between the Veteranen Group and the overlying Akademikerbreen Group approximates the transition where extension ceased and thermal subsidence began (i.e., the equivalent of the rift-drift transition of a passive margin). The contact is gradational but corresponds to a maximum regressive surface at the top of the Veteranen Group (marked by mud-cracked, calcareous, intertidal–supratidal siltstone and shale), followed by a transgressive systems tract and a transition towards dominantly calcareous sediments, recording the onset of thermal subsidence in the lowermost Akademikerbreen Group (Figure 2).
The lower Grusdievbreen Formation represents the first of six transgressive-regressive (T-R) sequences that comprise the ∼1900 m of the Akademikerbreen Group (Figure 2; Halverson et al., 2018a). The top of this T-R sequence (TR1) corresponds to the first of only two basin-wide disconformities identified within the entire Akademikerbreen Group and coincides with the onset of the so-called Bitter Springs Anomaly (BSA; Halverson et al., 2007a). The BSA is a negative carbon isotope anomaly that is interpreted to be globally correlative (Figure 3) and is named after the Bitter Springs Formation in Central Australia where it was first well documented (Hill et al., 2000). In Svalbard, it begins with an abrupt shift in carbonate carbon isotope values (δ13Ccarb) from ∼7‰ to near zero or slightly negative values and ends with an equally abrupt return to highly positive δ13Ccarb values (∼5‰). The BSA spans nearly 300 m of section and comprises the whole of the second T-R sequence in the Akademikerbreen Group (TR2), which itself marks a transition of the Akademikerbreen basin from a storm-influenced ramp to a dominantly shallow carbonate platform. The top of TR2 is also the second disconformity within the Akademikerbreen Group and coincides with the boundary between the first and second of four informal members of the Svanbergfjellet Formation (Figure 2).
The remainder of the Akademikerbreen Group consists of the upper three members of the Svanbergfjellet Formation, the Draken Formation, and the thick Backlundtoppen Formation. Columnar stromatolites are abundant throughout these three almost entirely carbonate units, and δ13Ccarb remains >2‰ and as high as 8‰ in the upper Backlundtoppen Formation. The Kinnvika Member, which forms the topmost part of the Backlundtoppen Formation (and hence the Akademikerbreen Group; Figure 2), comprises TR6 and records the onset of significant terrigenous input and the end of the long-lived stable Akademikerbreen carbonate platform. No faulting associated with this shift in depositional style has been documented. However, an abrupt flooding event in TR6, initiation of siliciclastic deposition, and the development of bathymetric relief in the basin identified by variably subaqueous to subaerial facies at the top of the Kinnvika Member, together imply at least minor tectonic influence (Halverson et al., 2018a).
The Russøya Member of the Elbobreen Formation forms the base of the overlying late Tonian–Ediacaran Polarisbreen Group. The Russøya Member begins with a pronounced transgression and spans the final two T-R sequences (TR7, TR8) of the Tonian interval. Unlike the Akademikerbreen Group, which is relatively uniform laterally in terms of facies across the outcrop belt in northeastern Svalbard, the Russøya Member is more variable. On Spitsbergen the Russøya Member consists of mixed siliciclastics and carbonates and is up to ∼220 m thick. In contrast, on Nordaustlandet, to the northeast, the Russøya Member is composed almost entirely of carbonate (mixed limestone and dolomite), and it thins to <100 m in the northernmost part of the outcrop belt. This spatial variability in thickness and facies provides additional support for modest basin reorganization spanning the Akademikerbreen–Polarisbreen contact. For our reference section through the Akademikerbreen and lower Polarisbreen groups shown in Figure 2, we use the most complete section of the Russøya in Nordaustlandet, which is also close to the average thickness (∼180 m) of measured sections (Halverson et al., 2018a).
Despite variability in lithofacies, a deep negative δ13Ccarb anomaly (from ∼+5‰ to −5‰) is preserved in the upper Russøya Member in both Nordaustlandet and Spitsbergen sections (Figure 2; Halverson et al., 2004). Previously referred to as the Islay anomaly and thought to immediately predate the onset of Cryogenian glaciation (Hoffman et al., 2012), this Russøya anomaly is now considered to be older, most likely correlative with a ca. 740–732 Ma negative carbon isotope anomaly recorded in the Coppercap and Callison Lake formations in northwestern Canada (Rooney et al., 2014; Strauss et al., 2014; Halverson et al., 2018a) and Ethiopia (Swanson-Hysell et al., 2015) (Figure 3). A second late Tonian negative δ13Ccarb anomaly, referred to as the Garvellach anomaly after the Garvellach Islands in Scotland where it is well documented, appears to correspond closely to the onset of Cryogenian glaciation and is therefore considered to be ca. 720–717 Ma in age (Fairchild et al., 2018). This anomaly is absent in Svalbard, presumably due to missing (not deposited or eroded) latest Tonian strata (Halverson et al., 2018a), as well as in northwestern Canada, but present in Ethiopia and Namibia (Figure 3).
Based on the assumed correlation between the glaciogenic Petrovbreen Member and Sturtian (basal Cryogenian) glacial deposits worldwide (Hoffman et al., 2012), the contact between the Russøya Member and the overlying Petrovbreen Member divides Tonian strata below from Cryogenian strata above in northeastern Svalbard. Despite the apparent longevity (ca. 56 Ma) of the Sturtian glaciation (Rooney et al., 2020) and its formidable thickness in many locations (e.g., NW Canada and South Australia), its manifestation in northeastern Svalbard, the Petrovbreen Member, is thin (≤52 m) to absent (Halverson et al., 2004). Erosional relief on this boundary can be gauged by the degree of preservation of the Russøya anomaly and inversely correlated thickness of the overlying glacial deposits. It is estimated that total relief on this surface in northeastern Svalbard is ∼50 m (Halverson et al., 2018a), although this is strictly a minimum of the total erosional truncation that took place. Given the absence of the Garvellach anomaly in Svalbard and the minimal thickness of the Petrovbreen Member, it seems as though the generation of accommodation space in the basin decreased substantially in the latest Tonian, consistent with the later stages of a thermally subsiding basin.
Methods
Correlated Ages
The only volcanic strata reported from the entirety of the Veteranen–Polarisbreen groups are a pair of thin, altered basalt flows from the basal Kingbreen Formation in the lower Veteranen Group at one locality (Harland, 1997). Many intervals of relatively organic-rich strata occur in the Akademikerbreen and Polarisbreen groups, and two new rhenium-osmium (Re-Os) dates have recently been reported. An Re-Os date of 631.2 ± 3.6 Ma on the lower Dracoisen Formation confirms the earliest Ediacaran age of the basal Dracoisen cap dolostone (Figure 1; Millikin et al., in press). Another Re-Os age of 737.5 ± 9.6 Ma on organic-rich strata in the middle Russøya Member is consistent with dates bracketing the presumed equivalent anomaly in northwestern Canada (Figure 3; Strauss et al., 2014; Rooney et al., 2015).
The only available detrital zircon data are from four sandstone beds from the upper Russøya Member and a single siltstone sample from within the Wilsonbreen Formation. These samples all yielded similar age spectra, with a dominant peak between 1.0 and 1.7 Ga and without any younger zircons providing useful maximum depositional ages (Fairchild et al., 2016).
Due to the paucity of direct radioisotopic ages, we resort to applying ages to the Tonian succession based on correlation. For example, the correlation of the Petrovbreen Member with the global Sturtian glaciation allows a confident age assignment of ca. 717 Ma (Macdonald et al., 2010; MacLennan et al., 2018). Similarly, an age of ca. 635 Ma can be applied to the contact between the glaciogenic Wilsonbreen Formation and the overlying Dracoisen Formation, which marks the end of the Marinoan glaciation and the base of the Ediacaran Period (Halverson et al., 2018a; Figure 1). Although key fossil occurrences in Svalbard (Figure 2) hint at potential for Tonian biostratigraphy (also Riedman and Sadler, 2018; Riedman et al., 2021), the ages and global stratigraphic ranges of these fossils are not yet sufficiently resolved to be useful for chronostratigraphic purposes.
These geochronological deficiencies leave chemostratigraphy as the last-best option for applying ages to the Svalbard succession. Fortunately, not only is the Tonian succession in Svalbard extremely well preserved and suited for carbonate carbon (δ13Ccarb) and strontium isotope (87Sr/86Sr) stratigraphy (Halverson et al., 2007a, 2007b), but also many other carbonate-rich successions of this age occur globally (Li et al., 2013). Halverson et al. (2018b) proposed a series of ages that could be correlated with the Akademikerbreen and lower Polarisbreen groups based mainly on matching δ13Ccarb profiles (Figure 3), but also supported by 87Sr/86Sr data and other geological considerations such as locations of unconformities and relative stratigraphic thicknesses between chronological tie points. Furthermore, the interpreted ages for Svalbard plotted against stratigraphic height provide strong support that these units were deposited in a thermally subsiding basin with logarithmically decreasing sediment accumulation rates up-section, as would be expected following an episode of crustal stretching (Supplementary Figure S4). In addition to informing the Neoproterozoic evolution of the Hecla Hoek sedimentary basin, this finding supports the validity of the indirect dating approach and provides a means of inferring ages based on a thermal subsidence model based on a best fit curve to the data (Halverson et al., 2018b).
Here we build on that approach, using the same seven ages applied in Halverson et al. (2018b), along with three additional correlated ages and the new Re-Os age on the Russøya Member (Table 1). The key difference with the previous study is that here we explicitly take into consideration both the uncertainty on the radioisotopic ages and uncertainty on the stratigraphic placement of these ages within the Svalbard Tonian reference section in our model. Because both U-Pb and Re-Os dates are used in this analysis, it is essential to incorporate all uncertainties, including those associated with the isotopic tracer solutions and the decay constants (Condon et al., 2015). For most of the correlated ages, these full uncertainties were reported in the original publications. For dates published before this convention was established, we recalculated the ages and uncertainties using IsoPlotR (Vermeesch, 2018). The correlated ages we have added to our age model include U-Pb zircon ages from 1) a felsic tuff in the Devede Formation in northern Namibia, originally reported as 760.0 ± 0.9 Ma (Halverson et al., 2005) but updated here (with full uncertainty) to 759.9 ± 2.4 Ma (Figure 3), and 2) an intermediate dyke associated with the Little Dal basalt dated at 775.1 ± 1.0 Ma (Milton et al., 2017).
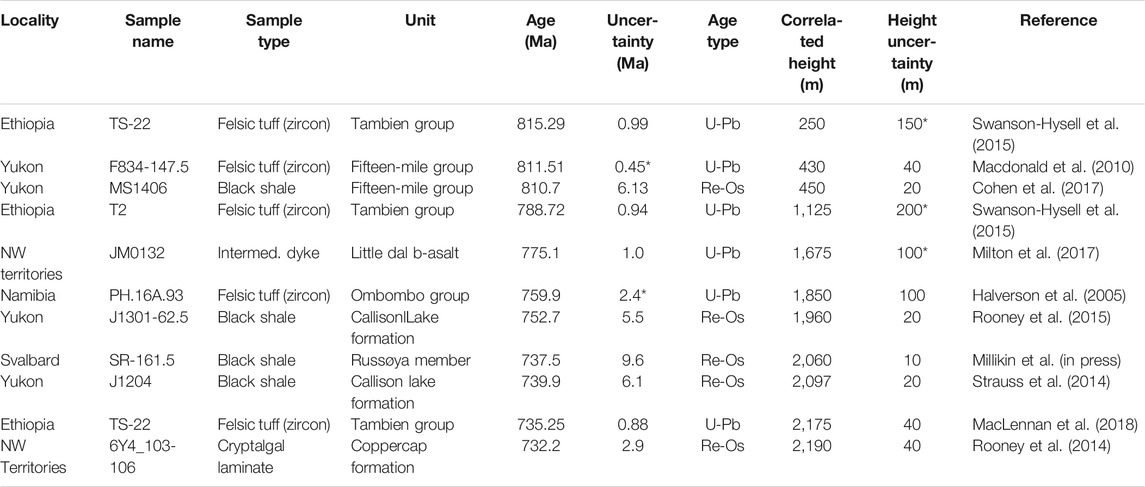
TABLE 1. The 11 radioisotopic dates applied to our Svalbard Tonian reference section age-depth model. This is not an exhaustive list of Tonian radioisotopic dates (Halverson et al., 2020 and Park et al., 2020 for recent compilations), but rather a list of dates that can be correlated, with variable degrees of confidence, to the reference section based mainly on carbon isotope stratigraphy (Halverson et al., 2018b). The uncertainty on the dates used here incorporates both the uncertainty in isotopic tracers and the uncertainty on the decay constants for the U-Pb and Re-Os systems. Consequently, the uncertainty listed here is in some cases larger than that which is quoted in some papers in which these dates were published or cited. Uncertainty on the correlated heights is at the 95% level where a normal distribution is applied in the model and the total range where a uniform distribution is applied (marked by *). See the Supplementary Information for a detailed account of the source of these dates and the justification for their correlation with Svalbard.
The assignment of stratigraphic uncertainties related to the correlations is less straightforward. The correlations are made possible mainly by salient structure in Neoproterozoic carbon isotope profiles, such as the onset and end of the Bitter Springs Anomaly and the minimum of the Russøya Anomaly (Figure 2). We apply an uncertainty based on our level of confidence in the correlation, and where the correlations are well guided by structure in the isotopic profile, we treat the uncertainties as a normal distribution (Table 1; Figure 3). Where isotopic structure is less well defined (hence the correlation more ambiguous), we apply a uniform distribution to the uncertainties. Note that even for the single Svalbard Re-Os age, we apply a height uncertainty because the age must still be correlated to the composite section. While this approach to assigning uncertainty is not objective, we err on the side of larger uncertainties where the fit is more tenuous, which effectively serves as a loose prior in our age model. We have not adjusted these correlations based on the model results.
All correlated ages, age uncertainties, stratigraphic positions, and stratigraphic uncertainties are summarized in Table 1. Note that stratigraphic range for uncertainties treated as normal are at the 95% level, and for those treated as uniform show the entire range. Additional background information on each of these ages and the justification for their correlation to the Svalbard Tonian reference section are provided in the Supplementary Material.
A Bayesian Subsidence Age-Height Model
We apply Bayesian inference to generate estimates of probable values of unknown parameters
Here, the
In the context of stratigraphic age-depth (or height) modelling, the data will include stratigraphic depths or heights and ages, the probability distributions of which are defined by parameters. For example, a radioisotopic age is described as a mean and uncertainty (typically reported at the 95% level, or 2−
This example illustrates how even seemingly trivial geological information can be used to develop more realistic stratigraphic ages from radiometric dates. Indeed, the power and utility of Bayesian inference is that it allows for adding reasonable geological constraints and other prior information in stratigraphic age-models. The popular Bchron method (Parnell et al., 2008) is built around a sedimentation model that is based on the observation that sediment accumulation in many settings takes place through a series of discrete sedimentation events. The sediment thickness following each event is variable, and the timing of the events is stochastic (Haslett and Parnell, 2008). This scenario can be modelled by using a combined Poisson-gamma (Tweedie) distribution. Within the Bayesian framework, the parameters for this distribution are first estimated as priors then updated based on available age-depth data through an MC-MC sampler. The updated priors themselves may be geologically informative insofar as they may bear on sedimentary processes or environments. Applied to age-depth modelling, they serve the more specific role of guiding updated aged-depth estimates that are informed by both the sedimentation model and the data. Importantly, this approach not only updates each radioisotopic date, but also can generate realistic age estimates with uncertainties (commonly referred to as credible intervals or highest posterior density intervals in the Bayesian context) for the entire sedimentary sequence.
The Bchron method was developed for recent and geologically short-duration sediment archives dated mainly by the radiocarbon technique (Parnell et al., 2008). However, other radioisotopic ages can be easily used in this method, and Trayler et al. (2020) have produced a Modified Bchron method that is better adapted for deep-time applications, for example allowing the use of maximum depositional age (MDA) constraints from detrital zircon data within the sediment accumulation model. Johnstone et al. (2019) developed an alternative approach for older stratigraphic successions focusing on evaluating depositional rates using an example from prograding platform margins, where the sediment accumulation model is based on observations that sediment accumulation rates vary systematically between the platform margin and the foreslope. The key parameters in this method (the stratigraphic location where the change from foreslope to margin deposition takes place and the ratio of the depositional gradient on the margin and the gradient on the foreslope) can be informed by existing geological data, and the updated parameters are geologically informative. However, the main purpose of these parameters is to guide the stratigraphic age-depth model.
In the case of the Svalbard Tonian reference section, deposition does not take place near a platform margin, so the prograding platform model is not applicable. We have applied the Modified Bchron method to our reference section (Figure 4). This model serves as a baseline age model of the type we seek, is consistent with our model assumption of decreasing sediment accumulation rates up-section, and provides a useful comparison of results based on subsidence-based approaches (Table 2). The drawback of the Modified BChron method in the case of Svalbard is that the actual sediment accumulation model—that is, the stochastic sedimentation model of Haslett and Parnell (2008)—does not adequately describe the controls on sediment accumulation in a relatively shallow, sedimentary basin over long time scales. In our case, where sedimentation occurs on a productive, shallow carbonate platform, the long-term sediment accumulation rate is controlled instead by the generation of accommodation space, which as shown in Supplementary Figure S4, can be modelled in terms of thermal subsidence (Halverson et al., 2018b). Therefore, we use the 1D, uniform stretching thermal subsidence equation (McKenzie, 1978) to model sediment accumulation rates. Here, the key geological parameter that is estimated by our Bayesian method is the stretching factor (β), which is the ratio of the thickness of the lithosphere prior to stretching to its thickness after stretching. Where stretching goes to completeness, and a spreading ridge forms, β equals infinity. We have left all other parameters in the thermal subsidence model fixed, because although allowing them to vary would result in increased variability in our B parameter, it would not affect the shape of our subsidence curve, and hence the ages derived from it. Given the fixed parameters (see Supplementary Material), the stretching factor for the Tonian basin of Svalbard was small—only about 1.25–1.35—consistent with the lack of evidence that a spreading ridge formed in the basin (Halverson et al., 2018b), but the precise value of which is of little significance beyond guiding the Bayesian model. The subsidence equation and description of the parameters in the equation are provided in the Supplementary Material, but the main point here is that the equation defines a curved line that is concave up when plotted as inverse height versus decreasing age, as in Supplementary Figure S4. That is, up-section, each increment of time results in a smaller increment of thickness.
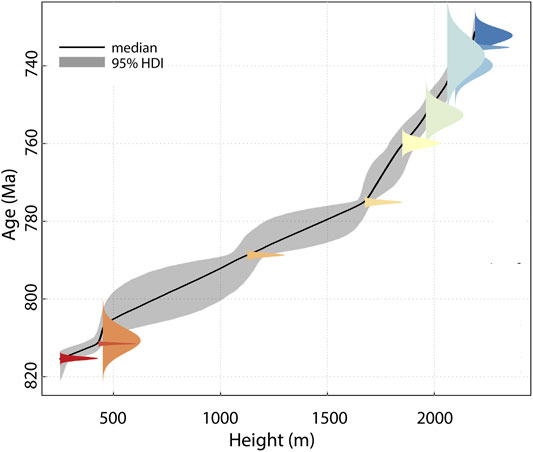
FIGURE 4. Results of applying the Modified Bchron age-depth model (Trayler et al., 2020) to the correlated Svalbard data (Table 1). Note that this program does not accommodate stratigraphic uncertainty directly, but because the thickness of samples can be included, this uncertainty is partially accounted for by prescribing a thickness corresponding to the uncertainty. Age estimates for key stratigraphic levels in the Svalbard Tonian composite section (Figure 2) are shown in Table 2. HDI = highest density interval (i.e., credible interval).
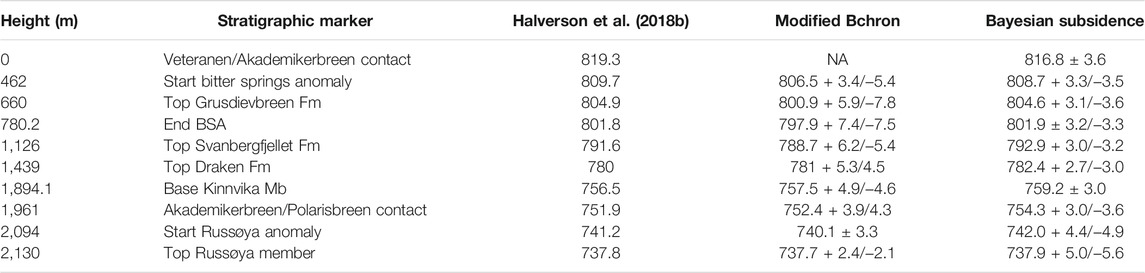
TABLE 2. Comparison of age estimates for key stratigraphic heights in the Svalbard Tonian reference section between this study and Halverson et al. (2018b), which did not explicitly account for age and height uncertainty.
Model Implementation
Most Bayesian age-depth methods incorporate the ages and uncertainties as parameters that can be directly modelled and updated via an MC-MC sampler. We attempted this approach using a Metropolis-Hastings algorithm which also incorporates our stratigraphic heights (of the correlated dates) and their uncertainties as parameters. However, this approach yielded unstable chains and inconsistent results between model runs with irregular posterior age and height distributions. We attribute these undesirable results to the likelihood that some correlations are inaccurate, but that the model seeks to find the best fit regardless. Therefore, we applied an alternative approach which allowed more flexibility to reject certain age combinations. This approach is similar to that proposed by Lougheed and Obrochta (2019), where combinations of ages and heights for each of the samples (age-height combinations) were first bootstrapped i times, after which any individual samples disobeying superposition were discarded, rather than discarding the entire combination (Figure 5). One advantage of this approach is that it provides fits for combinations with fewer than all the samples, which should, if the model is broadly correct, yield similar results when more samples are included. It also will reject certain correlated ages that may not be appropriate.
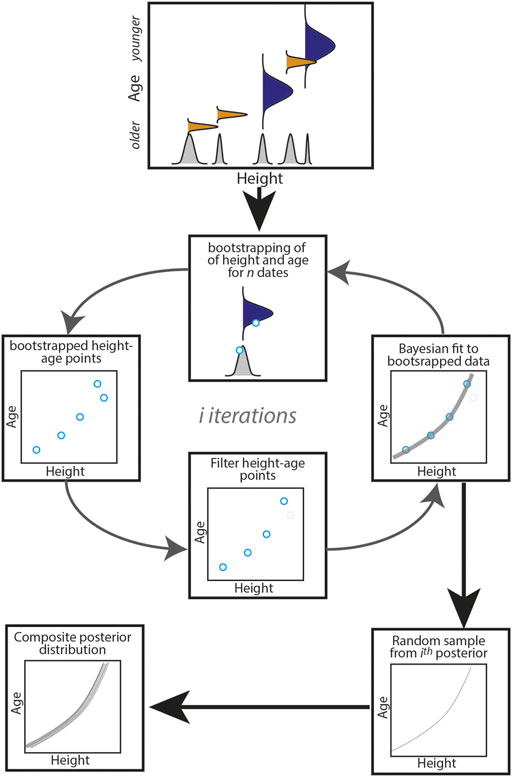
FIGURE 5. Schematic diagram illustrating the model workflow, which closely resembles a similar routine described by Lougheed and Obrochta (2019). It begins with a suite of n correlated ages (top of diagram), with corresponding 1−σ uncertainty shown by blue-filled distributions (note that this uncertainty is now less than the original quoted uncertainty on the ages, which was 95%), as well as their stratigraphic heights, with subjective height uncertainties in the position of the correlation (shown as blue- and orange-filled distributions to reflect both U-Pb and Re-Os ages). A total of i bootstrapped age-height combinations are generated from these distributions, and for each combination, the data are filtered to remove data that disobey stratigraphic superposition. Where the routine identifies a pair of points that disobeys superposition, it can remove either the stratigraphically higher or lower point in order to restore superposition. In order to minimize bias imposed by the filter, the model alternates between removing the upper and lower point in each successive iteration. The filtered data are then plugged into a simple Bayesian model and a single fit is picked randomly from the i posterior distributions. The i fits are collated into a single composite posterior, from which summary statistics on the parameters are generated.
Once each bootstrapped sample combination was filtered for stratigraphic superposition, the data were inserted into a simple subsidence-based, age-height Bayesian model to simulate posterior distributions using the quadratic approximation. The posterior is estimated using the efficient function “quap” available in the Rethinking package for R (McElreath, 2020). This Bayesian method utilizes three priors: β, the age of the onset of thermal subsidence, and the standard deviation of the model fit to the data. The age-height relationship is calculated using the 1D uniform stretching thermal subsidence equation, which is the same equation applied in Halverson et al., 2018b; (see section 1.3.1 in Supplementary Material). The model does not include the stratigraphic height of the extension-thermal subsidence transition because it is tightly correlated with the age of this transition.
We randomly selected a single fit to the age-height data from the posterior distributions of the parameters for each of the i iterations of bootstrapped data. The end result is i viable fits, which are collated to generate a composite posterior distribution (Figure 5). From this composite posterior, we summarize the statistics for the parameters (i.e., median, and the 95% credible interval). In turn, we can generate an age and uncertainty for any stratigraphic height in the reference section. We found that 5,000 iterations yielded stable and consistent results. The full model workflow is shown graphically in Figure 5, and the annotated code and related files can be downloaded from https://github.com/gphalverson/Svalbard_age-model.
Results
Figure 6 summarizes the results of our age-height model applied to the dates and stratigraphic heights shown in Table 1 and run with i = 5,000 iterations. Figure 6A shows a compilation of all sampled posterior fits to the bootstrapped data (gray lines), with the bootstrapped data represented by the clouds of red points. Figure 6B shows the composite posterior median (black curve) and the 95% credible interval. All subsequent reports of the results from the composite posterior are in terms of median and 95% credible interval, although we note that for most cases, the median is virtually identical to the mean value because the posterior distributions are nearly Gaussian.
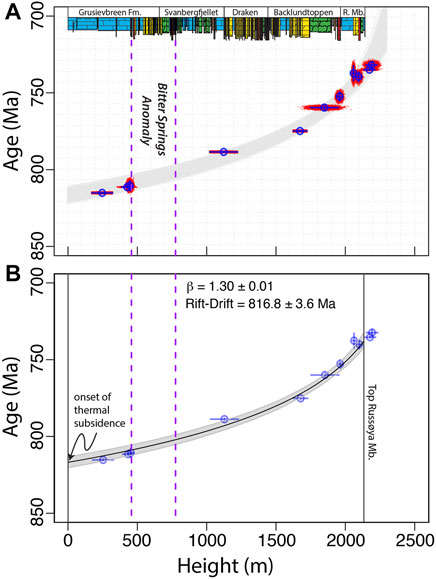
FIGURE 6. Results of the Bayesian age-height subsidence model applied to Svalbard. (A) shows all viable fits (grey curves) from 5,000 iterations of coupled bootstrapped-Bayesian model comprising the composite posterior distribution, along with the bootstrapped data (small red dots) and the original ages and uncertainties (open blue circles and solid blue lines). (B) Shows the best fit (median) to the composite posterior data and the grey shading indicates the 95% credible interval. The composite posterior distribution of the stretching factor (β) is 1.30, and the total posterior distribution defines a narrow range (also Figure 7). The age estimate for age of the onset of thermal subsidence (816.8 ± 3.6) is just the age estimate for 0 m in the section, which equals the Veteranen/Akademikerbreen contact (and base of the Grusdievebreen Formation). Vertical lines correspond to heights of interest (e.g., formation boundaries). The posterior distributions for each of these heights is shown in Figure 8.
From the curve in Figure 6B, it is evident that the range in credibility in the model can be attributed predominantly to the age of the onset of rifting (816.8 ± 3.6 Ma; Figure 7B), while the stretching factor defines a very narrow range around β = 1.30 (Figure 7A). Additional uncertainty is attributed to the standard deviation of the fit required to account for the scatter (the third parameter in the Bayesian model).
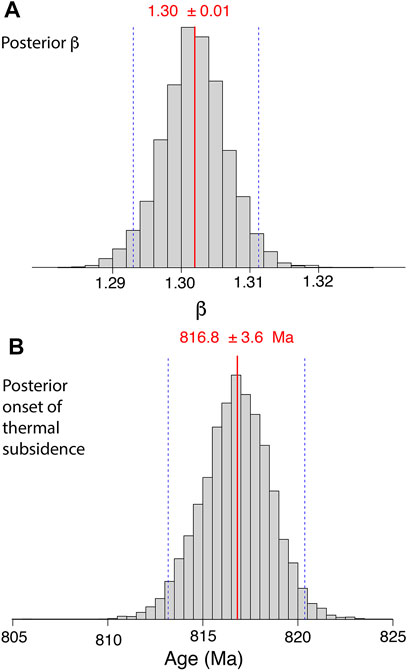
FIGURE 7. Posterior probability distributions for the (A) stretching factor, β, and (B) the age of the onset of thermal subsidence. Vertical red lines mark the median values, and the dashed blue lines demarcate the 95% credible intervals. Note the narrow range of β is an artefact of the model construction, where other model parameters were fixed. Thus, while the low value overall is consistent with limited lithospheric stretching, its precise value should not be mistaken for a high degree of confidence that it is accurate.
Using the fit and 95% credible interval shown in Figure 6B, we can generate a model age for any stratigraphic height within the succession, with accompanying credibility ranges. The results calculated every 5 m through the stratigraphic interval are provided in Supplementary Table S2. Figure 8 summarizes the posterior distributions for key heights of interest (Table 2), such as lithological boundaries, the onset and end of the Bitter Springs Anomaly and the onset of the Russøya anomaly (in both cases operationally defined by the heights of the δ13Ccarb = 0 crossovers). For example, the modelled age for the Grusdievbreen/Svanbjergfjellet boundary is 804.6 +3.1/−3.6 Ma and that for the Akademikerbreen/Polarisbreen contact is 754.3 + 3.0/−3.2 Ma (Figure 8).
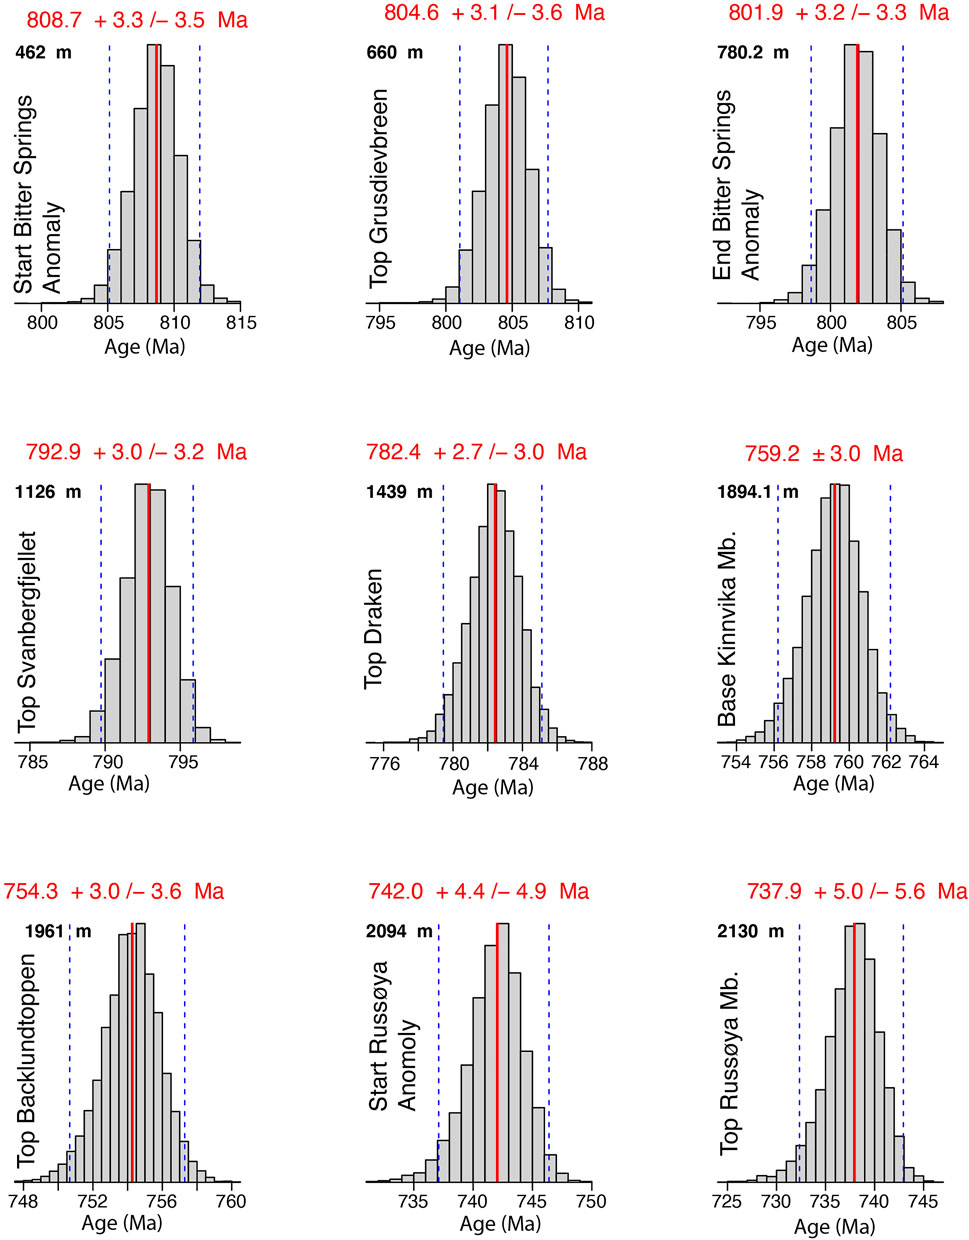
FIGURE 8. Age probability distributions for key heights in the Svalbard Tonian reference section, calculated based on the subsidence model and the composite posterior distributions for the stretching factor and age of rift-drift transition. Ages shown in red represent the median of the distributions plus the upper and lower bounds of their 95% credible intervals (also shown by dashed vertical lines).
The range in the credible intervals notably increases up-section such that the maximum uncertainty occurs at the top of the section. This pattern is a natural consequence of the thermal subsidence model, where due to decreasing subsidence rates up-section, a fixed difference in height results in increasing differences in age such that small differences in β and the age of onset of rifting are amplified.
Discussion
The age-height model here for the Svalbard Tonian reference section closely resembles the age-height model previously developed by Halverson et al. (2018b) because it is based on many of the same radiometric ages, as well as the same physical model linking height and age (i.e., the thermal subsidence model). Two correlated ages are included here that were not used in the previous model, but the key difference between the studies is the application of a probabilistic approach to quantify uncertainty in age estimates based on the data (the correlated ages) and the subsidence model. A summary of the difference in age estimates produced by the two models is shown in Table 2. In short, the estimates are overall similar and the original age estimates for all key stratigraphic heights lie within the 95% credible intervals of the current age model.
Building the uncertainty into both the correlations and in the radioisotopic dates themselves into the model allows us to explore a range of viable solutions. Because the stratigraphic and age ranges overlap in some instances, it is essential to account for superposition—that is, to ensure a monotonic decrease in age with increasing stratigraphic height. This requirement is particularly important for this model because only one of the eleven radioisotopic dates used is from Svalbard, and the proposed correlations are not only uncertain, but may be simply incorrect. The way the model has been designed, by bootstrapping the ages and heights, it naturally rejects unviable age-height combinations prior to performing the Bayesian analysis. In contrast, if age and stratigraphic uncertainties are treated as parameters, all ages will be kept and updated, even though their relative stratigraphic positions may be incorrect. We explored such a model through an MC-MC approach and found that it yielded generally similar results, but these results were less consistent between model runs, due in part to more complex, often bimodal posterior distributions that arose presumably due to the uncertainty in certain correlations and the larger parameter space that needed to be explored by the model.
Age of the Onset of Thermal Subsidence
Previous studies invoking thermal subsidence as the dominant mechanism of generation of accommodation space for the Akademikerbreen Group have proposed the contact between the Veteranen and Akademikerbreen groups as the stratigraphic level at which thermal subsidence initiated (Maloof et al., 2006; Halverson et al., 2018a; Halverson et al., 2018b). We note that in this case, there is no direct geological evidence that this transition was associated with initiation of a passive margin, although it may have been. In any case, extension evidently ceased near the Veteranen-Akadmikerbreen boundary such that the dominant subsidence mechanism became thermal. Assuming that the initial space accommodating the Veteranen Group was generated via stretching, this contact is a reasonable approximation for the transition because it corresponds to a change from dominantly siliciclastic to dominantly carbonate deposition, reflecting a loss of proximal crystalline source terrane due to removal of adjacent topography. Furthermore, the Akademikerbreen Group is nearly homogenous laterally across the outcrop belt, and the lack of evidence for syndepositional faulting strongly indicates tectonic quiescence during deposition of the nearly 2 km of carbonate strata (Halverson et al., 2018a).
Notwithstanding the geological evidence in support of the rifting-thermal subsidence transition occurring at the Veteranen-Akademikerbreen boundary, it is also possible and indeed likely that this transition did not occur precisely at the contact as we have identified it. It would be ideal to incorporate the uncertainty of its stratigraphic position into our model, such that the height of the onset of thermal subsidence was one of the priors that could be updated by the model. However, because the stratigraphic height and the age of the transition are tightly correlated within the model as constructed, doing so effectively destabilizes the model such that many different viable solutions are possible. Given that we have more prior evidence in support of the stratigraphic location of the transition than for its age, we have left it fixed and only treat the age of the transition as a parameter to be estimated. The result is a model age for the onset of thermal subsidence of 816.8 ± 3.6 Ma fixed at the Veteranen-Akademikerbreen contact (Figure 6). If the stratigraphic level for the transition were shifted, its age would change accordingly. However, although the position of the transition affects the stretching factor nominally, unless this change were large (>∼100 m), it would not significantly influence the age for the contact between the Veteranen and Akademikerbreen groups. The age offset with different prescribed stratigraphic levels for this transition does increase up-section, but it remains within the 95% credibility range.
Age and Duration of the Bitter Springs Anomaly
Based on our model, the ages for the onset and end of Bitter Springs Anomaly are 808.7 + 3.3/−3.5 Ma and 801.9 + 3.2/−3.3 Ma, respectively, (Figure 8). These estimates are similar to those proposed by Halverson et al. (2018b) (Table 1) and consistent with available radioisotopic ages that constrain the onset and end of the BSA in the Fifteenmile Group of Yukon (Macdonald et al., 2010; Cohen et al., 2017) and the Tambien Group of Ethiopia (Swanson-Hysell et al., 2015; Park et al., 2020). Because the BSA is so prominent, it can be confidently identified in a large number of other poorly dated stratigraphic successions, such as the Amadeus basin in Central Australia (Hill et al., 2000; Swanson-Hysell et al., 2010), the Little Dal Group and Shaler Supergroup in northwestern Canada (Halverson, 2006; Thomson et al., 2015), the Eleonore Bay Group in East Greenland (Wörndle et al., 2019), and possibly the Vindhyan Supergroup of northern India (George et al., 2018). Therefore, the model ages generated here can be applied to these other successions. While such correlated model ages do not inspire the same confidence as direct radioisotopic dates on the stratigraphy, they nevertheless serve as useful placeholder estimates that can be validated and tested by subsequent radioisotopic ages or age-height models.
The Bitter Springs Anomaly interrupts an otherwise prolonged interval of high δ13Ccarb values that characterizes Tonian carbonates globally (Figure 3). Although it has been questioned whether the BSA represents a global seawater phenomenon at all (e.g., Klaebe et al., 2017; Schmid, 2017), its widespread reproducibility, including in kerogen (Swanson-Hysell et al., 2010), strongly suggests a marine origin. Furthermore, its close temporal association with increased oxygenation of the atmosphere and oceans at about this time based on multiple lines of evidence (Planavsky et al., 2014; Cole et al., 2016; Lu et al., 2017) makes isolating a mechanism for the first order shifts in δ13C important for understanding the pattern of Neoproterozoic oxygenation. Even assuming a marine origin, no consensus exists on what triggered the onset or end of the BSA. However, given the intimate link between carbon and oxygen in most pathways for driving large negative δ13C anomalies (e.g., Bristow and Kennedy, 2008), determining the timescale of the anomaly is important in constraining the cause of the BSA.
While the estimates for the age of the onset and end of the BSA have relatively large 95% credible intervals compared to the median duration of ca. 6.9 m.y., the actual uncertainty in the duration is much smaller (Figure 9). This shrinkage in uncertainty is due to the fact that both ages are strongly correlated through the subsidence model. That is, where the age for the onset of the BSA is shifted older relative to its median age in any given posterior sample, the age of the end of the BSA will also be shifted older and vice versa. Therefore, rather than randomly sample from the posterior distributions of each age and subtract the difference (or calculate the uncertainty via quadratic addition), we subtracted the ages in each posterior sample to generate a distribution of age differences. The result is a duration of 6.9 ± 0.2 Ma (Figure 9). This duration can be applied as a constraint in age models for other basins containing the BSA, potentially decreasing uncertainty in those age models.
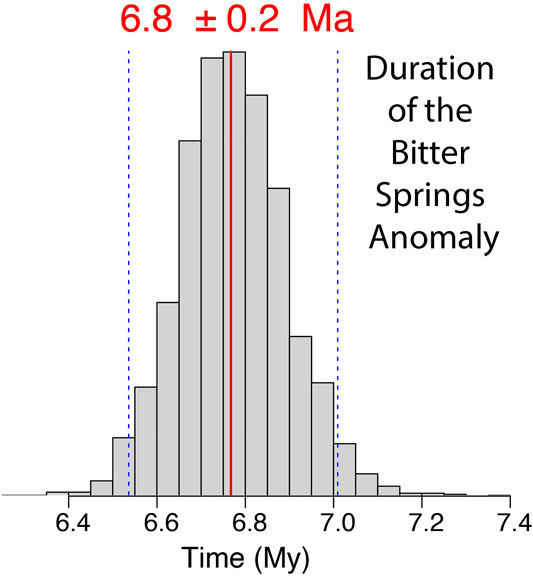
FIGURE 9. The posterior distribution for the duration of the Bitter Springs Anomaly, generated by subtracting the difference between the ages of its onset and end in each posterior sample.
It is important to emphasize that this narrow credible interval is the result not specifically of the individual radioisotopic dates used in the model (Table 1), but rather of the model itself. However, though “model-dependent,” this narrow credibility interval is validated by our prior knowledge that the stratigraphic heights in Svalbard for the onset and end of the BSA must be linked because both reflect the sediment accumulation processes intrinsic to this basin. In other words, even if the thermal subsidence model itself were not appropriate to describe the generation of accommodation space, the mechanism for generating subsidence and controlling sediment accumulation rates was presumably the same at the beginning and end of the BSA, consistent with geological evidence that the BSA spans a single transgressive-regressive sequence (TR-2; Figure 2). Therefore, these ages must be linked and not independent. This example demonstrates the power of incorporating geological priors into age-height modelling.
Demise of the Akademikerbreen Carbonate Platform
The Akademikerbreen Group records a remarkably stable, long-lived carbonate platform that initiated as a storm-influenced ramp (lower Grusdievbreen Formation) and evolved into a broad, shallow platform characterized by extensive stromatolitic biostromes and associated wave and tidally influenced facies (Knoll and Swett, 1990; Halverson et al., 2018a). This stability came to an end just prior to the end of Akademikerbreen deposition, with the abrupt input of siliciclastic sediments (mud to fine sand) of the Kinnvika Member, accompanying a basin-wide transgression (Figure 1; Halverson et al., 2004). The segmentation and increased lateral facies heterogeneity in the overlying Russøya Member suggests that this shift in depositional style was linked to regional tectonics. The age of 759.2 ± 3.0 Ma for the base of the Kinnvika Member (Figure 8) provides an estimate for the timing of this event.
This tectonic event may be manifested more broadly. The Kinnvika Member, plus the overlying Russøya Member of the basal Polarisbreen Group, together comprise three transgressive-regressive sequences (Figure 2) that have been correlated across northern Laurentia (Figure 3; Halverson et al., 2018a). In northern Canada, these sequences comprise the Callison Lake Formation, Coates Lake Group, and Killian Formation, the former two of which at least record local, fault-controlled extensional or transtensional basin generation (Strauss et al., 2014; Strauss et al., 2015). This age for the base of the Kinnvika Member therefore provides a useful estimate for the timing of the formation of these basins (ca. 759 Ma), which is consistent with all available radioisotopic ages from northwestern Canada (Strauss et al., 2014; Rooney et al., 2014; Milton et al., 2017; see also Supplementary Information). The manifestation of such a tectonic event in Svalbard is evidently subdued given the lack of evidence for acceleration in subsidence rates at this time.
Age of the Russøya Anomaly
These post-759 Ma basins in northern Laurentia all preserve a late Tonian negative δ13Ccarb anomaly. Halverson et al. (2018a) argued that this anomaly is distinct from a negative anomaly that appears to coincide temporally more closely with the onset of Cryogenian glaciation ca. 717 Ma, now informally referred to as the Garvellach anomaly (Figure 3; Fairchild et al., 2018; Lamothe et al., 2019). U-Pb zircon dates and δ13Ccarb data from the Tambien Group of Ethiopia appear to confirm a pair of distinct late Tonian negative δ13Ccarb anomalies, and a date from the recovery phase of the older anomaly provides a tight constraint of 735.25 ± 0.88 Ma (MacLennan et al., 2018; Park et al., 2020). This age is used in our age model (Table 1; Figure 2), which in turns yields an estimate of 742.0 + 4.4/−4.9 Ma for the onset of the Russøya anomaly (defined as the crossover from positive to negative δ13Ccarb values). Therefore, this anomaly initiated at least 20 m.y. prior to the onset of the Sturtian glaciation.
Because the return to positive δ13Ccarb values is not preserved in the Russøya Member—presumably due to erosion beneath the Petrovbreen Member (Sturtian) glacial surface (Halverson et al., 2018a)—our model cannot provide an estimate for the age of the end of the anomaly. However, it must be close to 735.25 ± 0.88 Ma, which is consistent with an age of 737.9 + 5.0/−5.6 Ma for the top of the most complete section of the Russøya Member, which ends near the nadir of the anomaly. We also note that the reliability of our age model decreases upsection, and this limitation in the model may be exacerbated by renewed tectonic influences on the basin, as indicated by the influx of clastics in the Kinnvika Member and segmentation of the basin in the Russøya Member.
An Age-Calibrated Late Tonian δ13Ccarb Reference Section
Halverson et al. (2018a) previously generated a composite δ13Ccarb record for the late Tonian carbonate stratigraphy of Svalbard (Akademikerbreen Group and Russøya Member). This composite was produced by correlating all available carbon isotope data into the reference section and taking a LOESS-like smoothing fit of the complete data set (Supplementary Material). This fit generated both mean δ13Ccarb values for evenly spaced heights and 95% uncertainty bounds. Here we integrate our height-age model for the same reference section to generate an age-calibrated reference section for the late Tonian (Figure 10; Supplementary Table S2). This record begins at the Veteranen-Akademikerbreen contact (i.e., ca. 817 Ma) and ends at the top of the Russøya Member. Due to apparent truncation and/or non-deposition of carbonate strata in Svalbard in the latest Tonian, this record does not extend to the Tonian-Cryogenian boundary. Nevertheless, it covers nearly 80 m.y. of Neoproterozoic Earth history, spanning two major negative carbon isotope anomalies, as well as an increase in seawater 87Sr/86Sr ratios from 0.7063 to 0.7070, followed by a subsequent decline in the late Tonian (Supplementary Table S3; Cox et al., 2016; Zhou et al., 2020). It also spans several important biostratigraphic datums, including the first and last appearance datums of the acritarch Cerebrosphaera globosa and the appearance of vase-shaped microfossils (Figure 2; Halverson et al., 2018b).
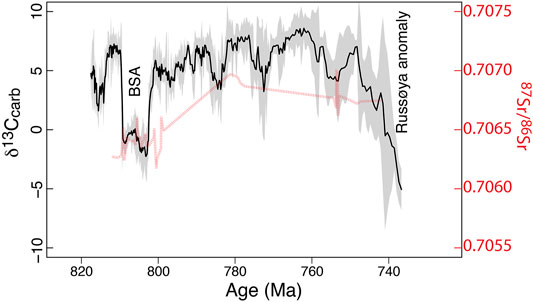
FIGURE 10. Age-calibrated carbonate carbon isotope (δ13Ccarb) and strontium isotope (87Sr/86Sr) records for the late Tonian of Svalbard. The ages are from the age model developed here. The δ13Ccarb record is a LOESS-like smoothing fit (Supplementary Material) to a compilation of all carbon isotope data from the Akademikerbreen Group and Russøya Member (Halverson et al., 2018a). The black line is the mean of the fit, while the gray shading shows the 95% credible interval on the fit. The age-calibrated data for this figure can be found in Supplementary Tables S2, S3.
Shortcomings and Tests of the Model
The model that we have presented here represents just one of likely many potential approaches to generating a geologically realistic age-height model for the Tonian stratigraphy of Svalbard. We have also applied the Modified Bchron method of Trayler et al. (2020) for comparison. The results if this model are shown graphically in Figure 4 and the median age and 95% credible intervals for the key heights in the succession are summarized in Table 2. Notably, the Modified Bchron age distributions all overlap the age distributions from our Bayesian subsidence method. The greatest difference between these two methods arises in stratigraphic intervals with fewer ages, where the Bayesian subsidence approach is more strongly influenced by other ages away from those intervals and hence guides (through the subsidence curve) the ages in this region. An opposing scenario occurs where ages are more densely distributed. Here, the Modified Bchron technique yields narrower credible intervals, while the Bayesian subsidence model results in larger uncertainty because it is forced to hew to the subsidence curves. These results highlight the fact that different age-height modelling approaches may be more appropriate depending on the spacing and uncertainty of the available age constraints.
A limitation of this Bayesian subsidence model is the nearly complete lack of direct radioisotopic ages from Svalbard used to generate it. However, the utility of the Akademikerbreen + Russøya stratigraphy as a reference section for the late Tonian (Figure 2) justifies this preliminary attempt at an age calibration. Furthermore, the acquisition of additional direct ages on the Svalbard succession will provide both a direct test of the model and a means of updating it. Direct ages have little or no height uncertainty (some uncertainty may be entailed in correlating the ages into the composite reference section). Consequently, they naturally exert stronger control on the posterior distributions than ages with large height uncertainty.
Because no useful detrital zircon age data exist for the purpose of age calibration, we have not included a way to incorporate maximum depositional ages (MDAs) into our model. However, this could be done in a relative straightforward way simply by generating probability distribution functions for MDAs, as has been demonstrated by Johnstone et al. (2019) and incorporated in the Modified Bchron model (Trayler et al., 2020).
It is not clear that the present model will find applicability to other basins of the same or different ages. Subsidence histories in basins are often complex, with competing or interacting controls on the generation of accommodation space. Being able to apply a thermal subsidence model requires evidence that a basin was indeed subsiding thermally over a specific interval in its history. Even in Svalbard, evidence for at least minor basin reorganization near the Akademikerbreen–Polarisbreen contact suggests that more than one subsidence mechanisms may be responsible for generating accommodation space during Akademikerbreen–lower Polarisbreen times. On the other hand, similar methods could apply different controls on accommodation space, such as extension or flexure, or even periodic fluctuations in sea level, through a single stratigraphic succession.
Our model is also designed to integrate over millions of years and 100 s of meters of section. As formulated, it cannot explicitly account for variable sediment accumulation rates as a result of facies changes or sea level fluctuations. Nor can it account for time or strata missing at unconformities. In Svalbard, unconformities are not particularly problematic as only two subaerial exposure surfaces have been identified within the Akademikerbreen Group, and carbon isotope data and outcrop observations suggest that these were not long-lived and did not entail appreciable erosion (Halverson et al., 2007a). But in other successions, unconformities may play a much larger role in how age related to stratigraphic height, just as they likely do above the top of the Russøya Member, which accounts for why we did not extend our model through the whole of the Polarisbreen Group. Incorporating unconformities explicitly in the model will be an important advance, but it will probably also be necessary to apply separate models to stratigraphic intervals separated by significant unconformities.
A logical next step in a subsidence-type model like that proposed here will be to incorporate backstripping and decompaction to generate tectonic subsidence curves (versus sediment-loaded curves). This approach would account for variable compaction between different lithofacies and could build uncertainty and prior constraints in compaction parameters. As such, it may be better suited to account for higher shale content in some parts of the succession, such as the upper Svanbergfjellet Formation, and to capture changes in the style of tectonic subsidence, for example across the Akademikerbreen–Polarisbreen contact.
Conclusion
The Tonian carbonate strata of northeastern Svalbard (Akademikerbreen and lower Polarisbreen groups) serve as a useful reference for late Tonian time because they are well preserved and exposed and contain many key geochemical and fossil data. The physical, sequence, and chemical stratigraphy of these rocks has been integrated from multiple sections to generate a single composite reference section for interval of the Tonian spanning from ca. 820–740 Ma (Figure 2). Unfortunately, despite its importance as a late Tonian reference section, this succession has thus far yielded only one direct Re-Os age (Millikin et al., in press). However, it has previously been argued, based on sedimentological and stratigraphic grounds, that the base of the Akademikerbreen Group approximates a transition from extensional to thermal subsidence following an episode of intracratonic crustal stretching that gave rise to the Neoproterozoic sedimentary basin in northeastern Svalbard (Maloof et al., 2006; Gibson et al., 2021). Chemostratigraphic correlation of Tonian ages from other sedimentary successions globally appears to validate this hypothesis (Figure 3), and Halverson et al. (2018b) used this information to develop a simple age model for this reference section based on a simple 1D thermal subsidence model.
Here we have updated the age model for the Svalbard Tonian reference section by applying Bayesian inference. This approach explicitly incorporates uncertainty both from the correlated radioisotopic ages used to construct it (Table 1) and from the actual correlations themselves. Like other available Bayesian age-height models (e.g., Figure 5), the method imposes a prior constraint of stratigraphic superposition, meaning successively higher ages must be younger. The result is a revised age-height model for the Svalbard Tonian reference section that includes 95% credible intervals for each age assignment. This model is used to generate age estimates for key heights within the reference section (Table 2). For example, the onset of the of the Bitter Springs Anomaly (BSA), defined as the height where δ13Ccarb crosses from positive to negative values (the top of the informal lower member of the Grusdievbreen Formation) is estimated to be 808.7 + 3.3/−3.5 Ma, while the end of the BSA (the contact between the lower two members of the Svanbergfjellet Formation) is estimated to be 801.9 + 3.2/−3.3 Ma (Figure 8).
Age estimates for different stratigraphic heights in our model are not independent from one another but rather are linked by the thermal subsidence model. Consequently, durations between stratigraphic heights in the reference section can be calculated with greater precision than individual ages. The duration of the BSA is here estimated to be 6.9 ± 0.2 Ma (Figure 9). Because the onset and the end of the BSA are well expressed in several other Tonian stratigraphic successions globally, these age and duration estimates can be applied to those successions. Similarly, the estimate of 742.0 + 4.4/−4.9 Ma for the onset of the Russøya negative δ13Ccarb anomaly can be applied to other successions where it is recorded (Figure 3). To the extent that this age is broadly correct, it implies that ca. 20 million years of time are missing on the disconformable contact between the Russøya Member and the overlying Cryogenian Petrovbreen Member. An unconformity of this magnitude is not surprising given the evidently slowing depositional rates by the time of Russøya deposition, coupled with likely prolonged and significant sea level fall associated with the Sturtian glaciation.
The age model presented here can be easily tested and improved with the acquisition of new Tonian radioisotopic ages, both in Svalbard and elsewhere. The Bayesian age-height approach used here may also find application to other stratigraphic successions, where the tectonic generation of accommodation space is the principal control on long-term sediment accumulation rates. Such models need not rely on a thermal subsidence mechanism, but rather could be designed around extensional or flexural subsidence or other geodynamic or eustatic controls on accommodation space. The results may also be integrated with other stratigraphic age-height modelling approaches.
Data Availability Statement
The original contributions presented in the study are included in the article/Supplementary Material. The datasets generated for this study can be found at https://github.com/gphalverson/Svalbard_age-model-2021. Further inquiries can be directed to the corresponding author.
Author Contributions
GH, CS, and JD conceived the study. GH generated the model and wrote the code with the help of the co-authors, and LW cleaned and adapted the code and associated documentation for publication. GH wrote the manuscript and drafted the figures, with assistance from the co-authors.
Funding
Support for this work was provided by Natural Sciences and Engineering Research Council of Canada (NSERC) Discovery grants to GH and JD. LW is supported by a Wares Postdoctoral Fellowship (McGill University). CS received support from a Mountjoy Fellowship (McGill University).
Conflict of Interest
The authors declare that the research was conducted in the absence of any commercial or financial relationships that could be construed as a potential conflict of interest.
Publisher’s Note
All claims expressed in this article are solely those of the authors and do not necessarily represent those of their affiliated organizations, or those of the publisher, the editors and the reviewers. Any product that may be evaluated in this article, or claim that may be made by its manufacturer, is not guaranteed or endorsed by the publisher.
Supplementary Material
The Supplementary Material for this article can be found online at: https://www.frontiersin.org/articles/10.3389/feart.2022.798739/full#supplementary-material
References
Bao, H., Fairchild, I. J., Wynn, P. M., and Spötl, C. (2009). Stretching the Envelope of Past Surface Environments: Neoproterozoic Glacial Lakes from Svalbard. Science 323, 119–122. doi:10.1126/science.1165373
Bristow, T. F., and Kennedy, M. J. (2008). Carbon Isotope Excursions and the Oxidant Budget of the Ediacaran Atmosphere and Ocean. Geol 36, 863–866. doi:10.1130/g24968a.1
Cohen, P. A., Strauss, J. V., Rooney, A. D., Sharma, M., and Tosca, N. (2017). Controlled hydroxyapatite biomineralization in an -810 million-year-old unicellular eukaryote. Sci. Adv. 3, e1700095.
Cole, D. B., Reinhard, C. T., Wang, X., Gueguen, B., Halverson, G. P., Gibson, T., et al. (2016). A Shale-Hosted Cr Isotope Record of Low Atmospheric Oxygen during the Proterozoic. Geology 44, 555–558. doi:10.1130/g37787.1
Condon, D. J., Schoene, B., McLean, N. M., Bowring, S. A., and Parrish, R. R. (2015). Metrology and Traceability of U-Pb Isotope Dilution Geochronology (EARTHTIME Tracer Calibration Part I). Geochimica et Cosmochimica Acta 164, 464–480. doi:10.1016/j.gca.2015.05.026
Cox, G. M., Halverson, G. P., Stevenson, R. K., Vokaty, M., Poirier, A., Kunzmann, M., et al. (2016). Continental Flood basalt Weathering as a Trigger for Neoproterozoic Snowball Earth. Earth Planet. Sci. Lett. 446, 89–99. doi:10.1016/j.epsl.2016.04.016
De Vleeschouwer, D., and Parnell, A. C. (2014). Reducing Time-Scale Uncertainty for the Devonian by Integrating Astrochronology and Bayesian Statistics. Geology 42, 491–494. doi:10.1130/g35618.1
Fairchild, I. J., and Hambrey, M. J. (1984). The Vendian Succession of Northeastern Spitsbergen: Petrogenesis of a Dolomite-Tillite Association. Precambrian Res. 26, 111–167. doi:10.1016/0301-9268(84)90042-1
Fairchild, I. J., Bonnand, P., Davies, T., Fleming, E. J., Grassineau, N., Halverson, G. P., et al. (2016). The Late Cryogenian Warm Interval, NE Svalbard: Chemostratigraphy and Genesis. Precambrian Res. 281, 128–154. doi:10.1016/j.precamres.2016.05.013
Fairchild, I. J., Spencer, A. M., Ali, D. O., Anderson, R. P., Anderton, R., Boomer, I., et al. (2018). Tonian-Cryogenian Boundary Sections of Argyll, Scotland. Precambrian Res. 319, 37–64. doi:10.1016/j.precamres.2017.09.020
George, B. G., Ray, J. S., Shukla, A. D., Chatterjee, A., Awasthi, n., and Laskar, A. H. (2018). Stratigraphy and Geochemistry of the Balwan Limestone, Vindhyan Supergroup, India: Evidence for the Bitter Springs δ13C Anomaly. Precambrian Res. 313, 18–30. doi:10.1016/j.precamres.2018.05.008
Gibson, T. M., Millikin, A. E. G., Anderson, R. P., Myrow, P. M., Rooney, A. D., and Strauss, J. V. (2021). Tonian Deltaic and Storm-Influenced marine Sedimentation on the Edge of Laurentia: The Veteranen Group of Northeastern Spitsbergen, Svalbard. Sediment. Geology. 426, 106011. doi:10.1016/j.sedgeo.2021.106011
Gradstein, F. M. (2020). “Evolution and Biostratigraphy,” in Geologic Time Scale 2020. Editors F. M. Gradstein, J. G. Ogg, M. D. S. Schmitz, and G. M. Ogg (Elsevier), 35–137. doi:10.1016/b978-0-12-824360-2.00003-6
Halverson, G. P., Maloof, A. C., and Hoffman, P. F. (2004). The Marinoan Glaciation (Neoproterozoic) in Northeast Svalbard. Basin Res. 16, 297–324. doi:10.1111/j.1365-2117.2004.00234.x
Halverson, G. P., Hoffman, P. F., Schrag, D. P., Maloof, A. C., and Rice, A. H. N. (2005). Toward a Neoproterozoic Composite Carbon-Isotope Record. Geol. Soc. America Bull. 117, 1181–1207. doi:10.1130/b25630.1
Halverson, G. P. (2006). A Neoproterozoic Chronology. In Xiao, S. and Kaufman, A., editors, Neoproterozoic Geobiology and Paleobiology, volume 27 of Topics in Geobiology, 231–271. Dordrecht, the Netherlands: Springer.
Halverson, G. P., Maloof, A. C., Schrag, D. P., Dudás, F. Ö., and Hurtgen, M. (2007a). Stratigraphy and Geochemistry of a Ca 800 Ma Negative Carbon Isotope Interval in Northeastern Svalbard. Chem. Geology. 237, 5–27. doi:10.1016/j.chemgeo.2006.06.013
Halverson, G. P., Dudás, F. Ö., Maloof, A. C., and Bowring, S. A. (2007b). Evolution of the 87Sr/86Sr Composition of Neoproterozoic Seawater. Palaeogeogr. Palaeoclimatol. Palaeoecol. 256, 103–129. doi:10.1016/j.palaeo.2007.02.028
Halverson, G. P., Kunzmann, M., Strauss, J. V., and Maloof, A. C. (2018a). The Tonian-Cryogenian Transition in Northeastern Svalbard. Precambrian Res. 319, 79–95. doi:10.1016/j.precamres.2017.12.010
Halverson, G. P., Porter, S. M., and Gibson, T. M. (2018b). Dating the Late Proterozoic Stratigraphic Record. Emerging Top. Life Sci. 2, 137–147. doi:10.1042/etls20170167
Halverson, G., Porter, S., and Shields, G. (2020). “The Tonian and Cryogenian Periods,” in The Geologic Time Scale 2020. Editors F. M. Gradstein, J. G. Ogg, M. D. Schmitz, and G. M. Ogg (Elsevier), 495–519. doi:10.1016/b978-0-12-824360-2.00017-6
Harland, W. B. (1997). “Chapter 7 Northeastern Spitsbergen,” in The Geology of Svalbard, Geological Society Memoir 17. Editor W. B. Harland (London: Geological Society of London), 110–131. doi:10.1144/gsl.mem.1997.017.01.07
Harland, W. B. (1964). Critical Evidence for a Great Infra-cambrian Glaciation. Geol. Rundsch 54, 45–61. doi:10.1007/bf01821169
Harrigan, C. O., Schmitz, M. D., Over, D. J., Trayler, R. B., and Davydov, V. I. (2021). Recalibrating the Devonian Time Scale: A New Method for Integrating Radioisotopic and Astrochronological Ages in a Bayesian Framework. Geological Society of America Bulletin. doi:10.1130/B36128.1
Haslett, J., and Parnell, A. (2008). A Simple Monotone Process with Application to Radiocarbon-Dated Depth Chronologies. Appl. Stat. 57, 399–418. doi:10.1111/j.1467-9876.2008.00623.x
Hill, A. C., Arouri, K., Gorjan, P., and Walter, M. R. (2000). “Geochemistry of marine and Nonmarine Environments of a Neoproterozoic Cratonic Carbonate/evaporite: the Bitter Springs Formation, Central Australia,”. Carbonate Sedimentation and Diagenesis in an Evolving Precambrian World. Editors J. Grotzinger, and N. James (Tulsa: SEPM Special Publications), 67, 327–344. doi:10.2110/pec.00.67.0327
Hoffman, P. F., Halverson, G. P., Domack, E. W., Maloof, A. C., Swanson-Hysell, N. L., and Cox, G. M. (2012). Cryogenian Glaciations on the Southern Tropical Paleomargin of Laurentia (NE Svalbard and East Greenland), and a Primary Origin for the Upper Russøya (Islay) Carbon Isotope Excursion. Precambrian Res. 206-207, 137–158. doi:10.1016/j.precamres.2012.02.018
Hoffman, P. F., Halverson, G. P., Schrag, D. P., Higgins, J. A., Domack, E. W., Macdonald, F. A., et al. (2021). Snowballs in Africa: Sectioning a Long-Lived Neoproterozoic Carbonate Platform and its Bathyal Foreslope (NW Namibia). Earth-Science Rev. 219, 103616. doi:10.1016/j.earscirev.2021.103616
Johansson, A., Larianov, A. N., Tebenkov, A. M., Gee, D. G., Whitehouse, M. J., and Vestin, J. (2000). Grenvillian Magmatism of Western and central Nordaustlandet, Northeastern Svalbard. Trans. R. Soc. Edinb. 90, 221–234. doi:10.1017/S0263593300002583
Johansson, A., Gee, D. G., Larionov, A. N., Ohta, Y., and Tebenkov, A. M. (2005). Grenvillian and Caledonian Evolution of Eastern Svalbard - a Tale of Two Orogenies. Terra Nova 17, 317–325. doi:10.1111/j.1365-3121.2005.00616.x
Johnstone, S. A., Schwartz, T. M., and Holm-Denoma, C. S. (2019). A Stratigraphic Approach to Inferring Depositional Ages from Detrital Geochronology Data. Front. Earth Sci. 7. doi:10.3389/feart.2019.00057
Klaebe, R. M., Kennedy, M. J., Jarrett, A. J. M., and Brocks, J. J. (2017). Local Paleoenvironmental Controls on the Carbon-Isotope Record Defining the Bitter Springs Anomaly. Geobiology 15, 65–80. doi:10.1111/gbi.12217
Knoll, A. H., and Swett, K. (1990). Carbonate Deposition during the Late Proterozoic Era: An Example from Spitsbergen. Am. J. Sci. 290-A, 104–132.
Knoll, A. H., Hayes, J. M., Kaufman, A. J., Swett, K., and Lambert, I. B. (1986). Secular Variation in Carbon Isotope Ratios from Upper Proterozoic Successions of Svalbard and East Greenland. Nature 321, 832–838. doi:10.1038/321832a0
Lamothe, K. G., Hoffman, P. F., Greenman, J. W., and Halverson, G. P. (2019). Stratigraphy and Isotope Geochemistry of the Pre-sturtian Ugab Subgroup, Otavi/Swakop Group, Northwestern Namibia. Precambrian Res. 332, 105387. doi:10.1016/j.precamres.2019.105387
Li, Z.-X., Evans, D. A. D., and Halverson, G. P. (2013). Neoproterozoic glaciations in a revised global palaeogeography from the breakup of Rodinia to the assembly of Gondwanaland. Sedimentary Geology 294, 219–232.
Lougheed, B. C., and Obrochta, S. P. (2019). A Rapid, Deterministic Age-Depth Modeling Routine for Geological Sequences with Inherent Depth Uncertainty. Paleoceanography and Paleoclimatology 34, 122–133. doi:10.1029/2018pa003457
Lu, W., Wörndle, S., Halverson, G. P., Zhou, X., Bekker, A., Rainbird, R. H., et al. (2017). Iodine Proxy Evidence for Increased Ocean Oxygenation during the Bitter Springs Anomaly. Geochem. Persp. Let. 5, 53–57. doi:10.7185/geochemlet.1746
Macdonald, F. A., Schmitz, M. D., Crowley, J. L., Roots, C. F., Jones, D. S., Maloof, A. C., et al. (2010). Calibrating the Cryogenian. Science 327, 1241–1243. doi:10.1126/science.1183325
MacLennan, S., Park, Y., Swanson-Hysell, N., Maloof, A., Schoene, B., Gebreslassie, M., et al. (2018). The Arc of the Snowball: U-Pb Dates Constrain the Islay Anomaly and the Initiation of the Sturtian Glaciation. Geology 46, 539–542. doi:10.1130/g40171.1
Maloof, A. C., Halverson, G. P., Kirschvink, J. L., Schrag, D. P., Weiss, B. P., and Hoffman, P. F. (2006). Combined Paleomagnetic, Isotopic, and Stratigraphic Evidence for True Polar Wander from the Neoproterozoic Akademikerbreen Group, Svalbard, Norway. Geol. Soc. America Bull. 118, 1099–1124. doi:10.1130/b25892.1
McElreath, R. (2020). Statistical Rethinking: A Bayesian Course with Examples in R and Stan. Second Edition. Boca Raton): Chapman and Hall/CRC, 612.
McKenzie, D. (1978). Some Remarks on the Development of Sedimentary Basins. Earth Planet. Sci. Lett. 40, 25–32. doi:10.1016/0012-821X(78)90071-7
Millikin, A. E. G., Strauss, J. V., Halverson, G. P., Bergmann, K. D., Tosca, N. J., and Rooney, A. D. Calibrating the Russøya Excursion in Svalbard, Norway, and Implications for Neoproterozoic Chronology. Geology. in press. doi:10.1130/G49593.1
Milton, J. E., Hickey, K. A., Gleeson, S. A., and Friedman, R. M. (2017). New U-Pb Constraints on the Age of the Little Dal Basalts and Gunbarrel-Related Volcanism in Rodinia. Precambrian Res. 296, 168–180. doi:10.1016/j.precamres.2017.04.030
Park, Y., Swanson-Hysell, N. L., MacLennan, S. A., Maloof, A. C., Gebreslassie, M., Tremblay, M. M., et al. (2020). The lead-up to the Sturtian Snowball Earth: Neoproterozoic Chemostratigraphy Time-Calibrated by the Tambien Group of Ethiopia. GSA Bull. 132, 1119–1149. doi:10.1130/b35178.1
Parnell, A. C., Haslett, J., Allen, J. R. M., Buck, C. E., and Huntley, B. (2008). A Flexible Approach to Assessing Synchroneity of Past Events Using Bayesian Reconstructions of Sedimentation History. Quat. Sci. Rev. 27, 1872–1885. doi:10.1016/j.quascirev.2008.07.009
Parnell, A. C., Buck, C. E., and Doan, T. K. (2011). A Review of Statistical Chronology Models for High-Resolution, Proxy-Based Holocene Palaeoenvironmental Reconstruction. Quat. Sci. Rev. 30, 2948–2960. doi:10.1016/j.quascirev.2011.07.024
Planavsky, N. J., Reinhard, C. T., Wang, X., Thomson, D., McGoldrick, P., Rainbird, R. H., et al. (2014). Low Mid-proterozoic Atmospheric Oxygen Levels and the Delayed Rise of Animals. Science 346, 635–638. doi:10.1126/science.1258410
Reiners, P. W., Carlson, R. W., Renne, P. R., Cooper, K. M., Granger, D. E., McLean, N. M., et al. (2018). Geochronology and Thermochronology. John Wiley & Sons, 464.
Riedman, L. A., Porter, S. M., and Czaja, A. D. (2021). Phosphatic Scales in Vase-Shaped Microfossil Assemblages from Death Valley, Grand Canyon, Tasmania, and Svalbard. Geobiology 19, 364–375. doi:10.1111/gbi.12439
Riedman, L. A., and Sadler, P. M. (2018). Global Species Richness Record and Biostratigraphic Potential of Early to Middle Neoproterozoic Eukaryote Fossils. Precambrian Res. 319, 6–18. doi:10.1016/j.precamres.2017.10.008
Rooney, A. D., Macdonald, F. A., Strauss, J. V., Dudás, F. Ö., Hallmann, C., and Selby, D. (2014). Re-Os Geochronology and Coupled Os-Sr Isotope Constraints on the Sturtian Snowball Earth. Proc. Natl. Acad. Sci. USA 111, 51–56. doi:10.1073/pnas.1317266110
Rooney, A. D., Strauss, J. V., Brandon, A. D., and Macdonald, F. A. (2015). A Cryogenian Chronology: Two Long-Lasting Synchronous Neoproterozoic Glaciations. Geology 43, 459–462. doi:10.1130/g36511.1
Rooney, A. D., Yang, C., Condon, D. J., Zhu, M., and Macdonald, F. A. (2020). U-pb and Re-os Geochronology Tracks Stratigraphic Condensation in the Sturtian Snowball Earth Aftermath. Geology 48, 625–629. doi:10.1130/g47246.1
Schmid, S. (2017). Neoproterozoic Evaporites and Their Role in Carbon Isotope Chemostratigraphy (Amadeus Basin, Australia). Precambrian Res. 290, 16–31. doi:10.1016/j.precamres.2016.12.004
Schoene, B., Eddy, M. P., Samperton, K. M., Keller, C. B., Keller, G., Adatte, T., et al. (2019). U-pb Constraints on Pulsed Eruption of the Deccan Traps across the End-Cretaceous Mass Extinction. Science 363, 862–866. doi:10.1126/science.aau2422
Strauss, J. V., Brandon, A. D., Rooney, A. D., Macdonald, F. A., and Knoll, A. H. (2014). 740 Ma Vase-Shaped Microfossils from Yukon, Canada: Implications for Neoproterozoic Chronology and Biostratigraphy. Geology 42, 659–662. doi:10.1130/g35736.1
Strauss, J. V., Macdonald, F. A., Halverson, G. P., Tosca, N. J., Schrag, D. P., and Knoll, A. H. (2015). Stratigraphic Evolution of the Neoproterozoic Callison Lake Formation: Linking the Break-Up of Rodinia to the Islay Carbon Isotope Excursion. Am. J. Sci. 315, 881–944. doi:10.2475/10.2015.01
Swanson-Hysell, N. L., Rose, C. V., Calmet, C. C., Halverson, G. P., Hurtgen, M. T., and Maloof, A. C. (2010). Cryogenian Glaciation and the Onset of Carbon-Isotope Decoupling. Science 328, 608–611. doi:10.1126/science.1184508
Swanson-Hysell, N. L., Maloof, A. C., Condon, D. J., Jenkin, G. R. T., Alene, M., Tremblay, M. M., et al. (2015). Stratigraphy and Geochronology of the Tambien Group, Ethiopia: Evidence for Globally Synchronous Carbon Isotope Change in the Neoproterozoic. Geology 43, 323–326. doi:10.1130/G36347.1
Thomson, D., Rainbird, R. H., Planavsky, N., Lyons, T. W., and Bekker, A. (2015). Chemostratigraphy of the Shaler Supergroup, Victoria Island, NW Canada: A Record of Ocean Composition Prior to the Cryogenian Glaciations. Precambrian Res. 263, 232–245. doi:10.1016/j.precamres.2015.02.007
Trayler, R. B., Schmitz, M. D., Kohn, M. J., Cuitiño, J. I., Bargo, M. S., Kay, R. F., et al. (2020). An Improved Approach to Age-Modeling in Deep Time: Implications for the Santa Cruz Formation, Argentina. Geol. Soc. America Bull. 132, 233–244. doi:10.1130/b35203.1
Vermeesch, P. (2018). IsoPlotR: A Free and Open Toolbox for Geochronology. Geosci. Front. 9, 1479–1493. doi:10.1016/j.gsf.2018.04.001
Wilson, C. B. (1958). The Lower Middle Hecla Hoek Rocks of Ny Friesland, Spitsbergen. Geol. Mag. 95, 305–327. doi:10.1017/S0016756800062865
Wörndle, S., Crockford, P. W., Kunzmann, M., Bui, T. H., and Halverson, G. P. (2019). Linking the Bitter Springs Carbon Isotope Anomaly and Early Neoproterozoic Oxygenation through I/[Ca + Mg] Ratios. Chem. Geology. 524, 119–135. doi:10.1016/j.chemgeo.2019.06.015
Keywords: Neoproterozoic, geochronology, Bayesian statistics, chemostratigraphy, age-depth modelling
Citation: Halverson GP, Shen C, Davies JHFL and Wu L (2022) A Bayesian Approach to Inferring Depositional Ages Applied to a Late Tonian Reference Section in Svalbard. Front. Earth Sci. 10:798739. doi: 10.3389/feart.2022.798739
Received: 20 October 2021; Accepted: 18 January 2022;
Published: 23 February 2022.
Edited by:
Hajime Naruse, Kyoto University, JapanReviewed by:
Nicholas L. Swanson-Hysell, University of California, Berkeley, United StatesDavid De Vleeschouwer, University of Bremen, Germany
Copyright © 2022 Halverson, Shen, Davies and Wu. This is an open-access article distributed under the terms of the Creative Commons Attribution License (CC BY). The use, distribution or reproduction in other forums is permitted, provided the original author(s) and the copyright owner(s) are credited and that the original publication in this journal is cited, in accordance with accepted academic practice. No use, distribution or reproduction is permitted which does not comply with these terms.
*Correspondence: Galen P. Halverson, galen.halverson@mcgill.ca