Dissolved Nitrogen Speciation and Concentration During Spring Thaw in the Greenland Ice Sheet Dark Zone: Evidence for Microbial Activity
 Alexandra T. Holland1
  Christopher J. Williamson1
  Andrew J. Tedstone1,2
  Alexandre M. Anesio3
  Martyn Tranter3*and The Black Bloom Group
- 1Bristol Glaciology Centre, School of Geographical Sciences, University of Bristol, Bristol, United Kingdom
- 2Department of Geosciences, University of Fribourg, Fribourg, Switzerland
- 3Department of Environmental Science, Aarhus University, Roskild, Denmark
This study provides the first contemporaneous measurements of the concentration and speciation of dissolved nitrogen (N) in snow, meltwater and ice during the onset of the ablation season at a site within the Dark Zone of the Greenland Ice Sheet. The decaying, partially leached snow pack near S6 in south-west Greenland produced meltwater with relatively constant nitrate (NO3−) concentrations, approximating the snow pack average (1.1 µM). By contrast, ammonium (NH4+) (0–∼ 4 µM) and dissolved organic nitrogen (DON) (0–∼ 3 µM) concentrations were more variable, and sometimes higher than the average snow pack concentrations of 1.0 and 0.4 µM, respectively. This variability could be the result of microbial uptake and production within the melting snow pack. We observed pooled meltwater at the snow-ice interface that appeared to scavenge DON (∼1–8 µM) and possibly NO3− (∼1–2 µM) from the underlying ice, whose initial surface was a continuum of superimposed ice and weathering crust from the previous season. The shallow meteoric ice (∼10 cm–1 m) beneath the snow pack had high concentrations of DON and NH4+(6.5 and 2.6 µM, respectively), while NO3− concentrations were similar to the snow pack (1.1 µM). The absence of NH4+ in the snowmelt traversing the snow-ice interface may also point to microbial activity occurring at this boundary layer. Melt modelling indicated the presence of liquid meltwater at the snow-ice interface and that at least 10 cm of the surface ice below the snow pack was at 0°C. Solar radiation transmitted through the thin snow pack to the ice surface is absorbed by pigmented glacier algae causing melt of the surrounding ice, allowing the possibly of photosynthesis to begin under the thinning snowpack in these micro-melt environments. Hence, we conjecture that glacier algal blooms can commence before the snow pack has completely melted, occuring at a time when meltwaters are enhanced in nutrients scavenged from the snowpack, superimposed ice and the remnants of the weathering crust from the previous year.
Introduction
The “Dark Zone” along the western margin of the Greenland Ice Sheet (GrIS) is an annually occurring area of dark surface ice, up to ∼ 50 km wide and some 20–30 km from the ice margin, with an albedo as low as 0.2 (Wientjes and Oerlemans, 2010; Box, et al., 2012; Stroeve, et al., 2013; Cook, et al., 2020). Its increasing area and duration over the past 2 decades has coincided with increasing surface melt (Rignot and Kanagaratnam, 2006; Rignot, et al., 2011; Shepherd, et al., 2012). The factors which control the extent and duration of the surface darkening have been contested, and include high concentrations of Holocene dust melting out of meteoric ice (Wientjes and Oerlemans, 2010; Wientjes, et al., 2011; Wientjes, et al., 2012), increased atmospheric deposition of black or brown carbon (Keegan, et al., 2014; Ryan, et al., 2018) and algal blooms (Yallop, et al., 2012; Williamson, et al., 2019; Williamson, et al., 2020). Recent studies have confirmed that Streptophyte glacier algae, which contain a unique dark UV/VIS absorbing pigment, purpurogallin phenolic pigment (Remias, et al., 2012; Yallop, et al., 2012; Stibal, et al., 2017a; Williamson, et al., 2020), are a significant factor responsible for the interannual variability in the extent, duration and scale of the Dark Zone (Tedstone, et al., 2017; Cook, et al., 2020) and account for an average decrease in albedo of between 0.13 and 0.25 for ice containing low and high algal biomass, respectively (Cook, et al., 2020).
Stimulation of algal blooms is likely impacted by the availability of nutrients, yet knowledge of nutrient concentrations during the onset of the melt season is limited (Stibal, et al., 2015; Wadham, et al., 2016; Williamson, et al., 2018; Holland, et al., 2019). We contend that a knowledge of nutrient inputs from melting snow to ice surface environments is essential for understanding the development of surface microbial communities during the early stages of the melt season, as snowmelt has already been shown to be a key nutrient source to many Arctic (Telling, et al., 2011; Telling, et al., 2012), Antarctic (Telling, et al., 2014) and other high altitude habitats (Bales, et al., 1990; Williams, et al., 1991). Concentrations of nutrients in snowmelt are typically not constant, particularly during the ‘ionic pulse’ of the early melt period. The ionic pulse occurs when solutes fractionate into snowmelt at higher concentrations than are present in the overall parent snow cover (Davies, et al., 1982; Hewitt, et al., 1991; Harrington and Bales, 1998), with the initial 30% of meltwater often containing ∼50–80% of the total snow pack solute load (Johannessen, et al., 1975; Johannessen and Henriksen, 1978; Cragin, et al., 1996). This arises because solutes are excluded from ice crystal interiors onto their surfaces during snow metamorphism over winter. A secondary effect, called preferential elution, is the result of the different solubilities of individual solute species in ice (Cragin, et al., 1996), causing insoluble ions, such as NO3−, to elute earlier and in higher concentrations than soluble ones. Several factors can enhance the effect of the magnitude of the ionic pulse, such as freeze-thaw cycles, bands of solute-rich snow or ice and deeper snow cover (Tsiouris, et al., 1985; Bales, et al., 1990; Cragin, et al., 1996). Banding of solute is routinely caused during melt-freeze cycles, when surface melt refreezes at depth in the snow pack (Brimblecombe, et al., 1987; Harrington and Bales, 1998). In particular, the meltwater which refreezes at the base of the snow pack above the cold ice, referred to as superimposed ice, is often rich in solutes (Bales, et al., 1990).
Snowmelt may be the main nitrogen (hereafter referred to as N) input in some supraglacial environments, comprising >95% of the total N input on a Svalbard glacier for example (Hodson, et al., 2005). Recent average annual nitrate (NO3−) concentrations in snowfall on Greenland are of the order of 2.8–5.6 µM, as recorded at Summit Station (Fibiger, et al., 2016). Concentrations may be lower nearer to the margin, with one study reporting values of 1.0 ± 0.3 µM near the south-west margin of the GrIS on the Kangerlussuaq-Transect (K-Transect) (Telling, et al., 2012). Ammonium (NH4+) concentrations in snow are usually lower, with those from Summit ranging from 0.35–0.89 µM (Silvente and Legrand, 1993; Dibb, et al., 1998), whereas values were below detection on the K-Transect (Telling, et al., 2012). At present, there is little available data on dissolved organic nitrogen (DON) concentrations in snow pack environments (Telling, et al., 2012).
Ablating surface ice can also be an important N source later in the season after the snow cover has melted, particularly when N concentrations in snow and ice are comparable. This is the case in the three studies of the Dark Zone bare ice habitats to date, where dissolved inorganic nitrogen (DIN) (comprising mostly of NO3− and NH4+) concentrations ranged from 0.6 to 1.3 µM (Telling, et al., 2012; Wadham, et al., 2016; Holland, et al., 2019). These values are similar to those reported in a review of Greenland ice core N concentrations, which had a mean DIN concentration of 1.4 µM (Wolff, 2013). NO3− concentrations typically exceed those of NH4+ in meteoric ice beneath surface ice, with average values of 0.97 and 0.45 µM, respectively (Mayewski, et al., 1994; Fuhrer, et al., 1996; Wolff, 2013). Concentrations of NO3− decrease in surface ice during algal blooms, dropping to zero (Telling, et al., 2012; Holland, et al., 2019), whereas NH4+ concentrations were found to increase, reaching values of up to 1 µM (Holland, et al., 2019). Surface ice concentrations of DIN are also significant in that they were found to exceed the estimated nitrogen requirement for balanced microbial growth in cryoconite holes located 2–7.5 km inland from the margin of the GrIS during the late ablation season (Telling, et al., 2012). However, the persistence of N fixation in the cryoconite holes suggests that other supraglacial microorganisms, such as glacier algae (Yallop, et al., 2012; Williamson, et al., 2019), were also utilizing N released from ablating surface ice (Telling, et al., 2012). Therefore, the ablating surface ice likely acts as a significant N source for several supraglacial habitats and microbial communities. There are relatively few reported values of DON for surface ice in the literature at present, with one study reporting relatively high DON concentrations (14.0 µM) in surface ice colonized by glacier algae in the GrIS Dark Zone (Holland, et al., 2019). Average DON concentrations of 1.6 µM were also reported for surface ice containing dispersed cryoconite in the same location (Wadham, et al., 2016), whereas quantifiable concentrations of DON could not be found in the surface ice closer to the GrIS margin (Telling, et al., 2012).
Knowledge of the controlling factors on the initiation of glacier algal blooms is currently limited. Recent work has shown that glacier algae, which colonise melting surface ice environments down to depths of ∼30 cm, are frozen into the ice during the end of the melt season and may initiate algal blooms during the following melt season (Nicholes, et al., 2019). As the snow pack thins during spring, the algal cells may be activated by light penetrating the snow cover (Figure 1). Both adsorption of solar radiation and subsequent metabolism generate heat (Williamson, et al., 2020), thereby melting the surrounding ice and consolidating niches for further growth. These niches are eventually bathed by early ablation season snow melt that soaks through the base of the snow cover and into the rotting underlying ice. Hence, the composition of early snow and ice melt that wets the ice surface in spring may be a potential factor controlling of the spring initiation of glacier algal blooms.
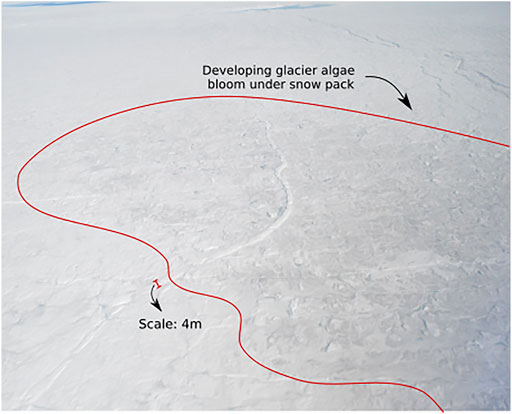
FIGURE 1. The onset of glacier algal blooms near the snowline in the vicinity of the K-Transect, SW Greenland (Figure 2A). The snow-filled supraglacial channel running centre image through the bottom left has a width of ∼4 m for scale. It is evident that glacier algae (encircled by red line) are darkening the surface even as the last snow is ablating.
The aims of the present study, therefore, are twofold. First, we aim to document DIN and DON concentrations in the snow pack, surface ice and snowmelt during the ablation season near to S6 on the K-Transect within the GrIS Dark Zone. Second, we aim to infer the key processes which regulate N species and concentrations at this key phase of the life cycle of ice algae, when the first photosynthetic activity of the year is expected to occur. Our goal is to constrain N concentrations, phase and species association in snow- and ice-melt in the GrIS Dark Zone at the onset of melt, which could, for example, inform future microbiological research of nutrient cycling in snow and underlying ice surfaces during the spring thaw and laboratory ice algae incubation experiments of the likely speciation and range of N concentrations that occur during the snowmelt season.
Methodology
Field Site and Sampling
Field Site
A field camp was established within the Dark Zone, inland from Kangerlussuaq, during the spring (June 1–26) of 2017, during the early melt season. The camp was located approximately 30 km from the ice margin, near to the “S6” weather station on the K-Transect (Figure 2A; 67°04′43.3″ N, 49°20′29.7″ W). The ablation of the snow surface was monitored, and snow, meltwater, ice core and snow covered surface ice samples were collected.
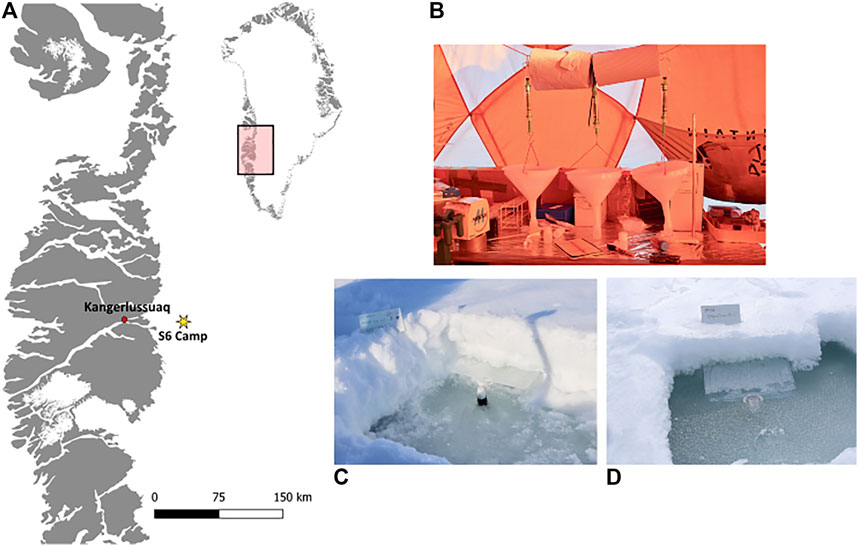
FIGURE 2. Camp location on the south-west margin of the GrIS (A), with inserts showing the crude laboratory snowmelt experiment (B), the in-situ snow pack meltwater collection (C), as well as the flooded in-situ snow pack meltwater (D).
Surface Ablation Monitoring
Ablation was measured using 25 plastic ablation stakes, 20 of which on were on the corners of five quadrants located throughout the sampling area (each 5 × 5 m). Each stake was placed in a hole drilled through the snow and into underlying ice Measurements were taken every 1–3 days, from June 3 to 26.
Snow Sampling
Seven snow pits were dug using a pre-cleaned shovel in randomly selected locations upwind of camp. The snow cover was ∼30–40 cm deep and contained five distinct layers, identified by hardness and crystal type. There was typically a coarse, loosely packed, base layer of facetted ice crystals, similar to depth hoar, topped by a basal ice layer some 3–4 cm thick. Ice crystals in the basal layer rounded when liquid water was present. A hard, coarse, tightly packed snow layer was found above the basal ice layer, containing ∼2–3, thin (1–2 cm thick) ice layers interspersed throughout. Finally, the top of the snow pack consisted of a loose, coarse layer, topped by a freeze layer. Samples of each distinctive layer were collected and transferred into sterile Whirl-pak™ bags using a pre-cleaned scoop.
Snowmelt Sampling
Meltwater sampling was conducted daily from June 1–13, with rapid surface melting commencing around June 3. The rolling topography of the underlying ice resulted in areas where liquid water and slush ponded at the base of the snow pack in topographic lows soon after the onset of rapid melting (Figure 2D). Ponded meltwater remained at the base of the pack until June 13th. By contrast, topographic high spots were characterized by wet basal snow layers only, and excess water drained away across the ice surface.
Three snow pits were dug at a randomly selected sampling area upwind of camp. In-situ snowmelt water was collected by inserting a 38 × 49 × 3 cm pre-cleaned plastic tray at a slight upward angle at the base of the snow pack and securing a pre-cleaned 30 ml high-density polyethylene plastic bottle (Nalgene™) in the basal ice below the tray (Figure 2C). Meltwater from the snow pack collected on the tray and drained into the bottle. Bottles were changed daily or when full, depending on the rate of melt. Unfortunately, due to the rolling ice topography, described above, the bases of two of the snow pits flooded (Figure 2D). Instead, the meltwater that pooled in these pits was collected daily by direct sampling of the in-situ meltwater into three, 30 ml pre-cleaned high-density polyethylene plastic bottle (Nalgene™) bottles.
Snowmelt Elution Experiments
A 10 × 10 × ∼30–40 cm section of snow containing all the layers of each experimental snow pack, described above, was collected on June 1st using a pre-cleaned shovel and transferred into a sterile Whirl-pak™ bag. The sampled snow section was then homogenized using the pre-cleaned shovel to break it apart, then shaken and inverted to mix the snow. The homogenized sections were taken immediately to the laboratory tent where 500 g of each sample was transferred into pre-cleaned funnels. The funnels were hung from a ring stand and a pre-cleaned 30 ml high-density polyethylene plastic bottle (Nalgene™) was placed underneath to collect the meltwater (Figure 2C). Bottles were replaced when full. Each bottle is referred to as a melt fraction in the text below.
Surface Ice Sampling
Samples of the surface ice (n = 19) at the snow-ice interface were also collected throughout the field season (June 2–17) at random locations upwind of camp. First, the snow pack above the ice surface was removed, then the top ∼2 cm of ice were sampled using a pre-cleaned ice saw and collected into a sterile Whirl-pak™ bag.
Ice Core Sampling
Seven ice cores were collected using a 1 m Kovacs Corer in randomly selected locations upwind of camp. Cores were laid out on tin foil where they were sectioned using a pre-cleaned hand saw. Distinct sections were determined by visible changes in ice structure and impurity loadings. A typical core contained ∼four to six distinct sections, denoted by changes in opacity, bubble content, cryoconite debris content and colour.
Sample Treatment and Analytical Methods
Samples of snow and ice were returned to the field laboratory tent and left to melt overnight. All samples were analysed for dissolved inorganic and organic nutrients and major ions. Samples were filtered through a 25 mm × 0.22 µm cellulose nitrate inline syringe filter (Whatman™) and stored in two x 1.5 ml PP Autosampler vials for major ion analysis and a pre-cleaned 30 ml high density polyethylene plastic bottle (Nalgene™) for nutrient analysis. The vials for major ion analysis were chilled to the ambient air temperature of ∼3°C, while the Nalgene™ bottles for nutrient analysis were frozen immediately to a temperature of −20°C using a Waeco 32 L Freezer. Samples were maintained at these temperatures during transport and in storage at the LowTex Laboratory at the University of Bristol. Nutrient samples were thawed immediately prior to analysis using a hot water bath set at a temperature of ∼40°C. Procedural blanks (n = 10) were collected during the course of the sampling season by processing deionized water in place of sample.
DIN species include NH4+, NO2− and NO3− and were quantified as NH4+, NO2− and total oxidised nitrogen (TOxN) (NO2− + NO3−) spectrophotometrically using a Gallery Plus Automated Photometric Analyzer (Thermo Fisher Scientific, United Kingdom). This combination of analysis allows the original NO3− concentration to be determined by subtracting NO2− from TOxN. The limit of detection (LoD) for all nutrients and major ions was determined by the mean concentration plus three times the standard deviation of procedural blanks (n = 6). TDN is the sum of DIN and DON and was determined by digesting the samples with a potassium persulfate, sodium hydroxide and boric acid reagent and autoclaving at 121°C for 30 min. This process causes the oxidation of organic nitrogen compounds, which can then be measured as TOxN, as above. Measurements were based on the hydrazine-sulfanilamide reaction method, with a measurement wavelength of 540 nm. DON was estimated by subtracting DIN from TDN (i.e. DON = TDN-DIN). LoDs were 2.4 µM (NH4+), 0.09 µM (NO2−) and 0.34 µM (TOxN and TDN/DON). Precisions were ±2.1% (NH4+), ±0.49% (NO2−) and ±1.7% (TOxN and TDN/DON), and accuracies were −1.8% (NH4+), 0.16% (NO2−) and -9.6% (TOxN and TDN/DON), as determined from comparison with gravimetrically diluted 1,000 mg L−1 NH4+-N, NO2−-N and NO3−-N certified stock standards to a concentration of 3.6 µM (NH4+ and NO2−) and 2.9 µM (TOxN and TDN/DON) (Sigma TraceCERT®).
DIP (dissolved inorganic phosphorus, principally PO43−) was quantified by a Gallery Plus Automated Photometric Analyzer (Thermo Fisher Scientific, United Kingdom), using the molybdenum blue method with a measurement wavelength of 880 nm. The LoD was 0.13 µM (PO43−). Precision was ±2.0%, and accuracy was -8.3%, as determined from comparison with gravimetrically diluted 1,000 mg L−1 PO4-P certified stock standards to a concentration of 1.61 µM (Sigma TraceCERT®).
Major ions (Cl−, SO42−, Na+ and K+) were quantified using capillary ion chromatography on a Thermo Scientific™ Dionex™ analytical ICS-5000, fitted with a simultaneous ionpactm AS11-HC 2 × 250 mm anion-exchange column and an ionpactm CS12 2 × 250 mm cation-exchange column. The LoDs were 0.18 µM (Cl−), 0.03 µM (SO42−), 0.62 µM (Na+) and 0.38 µM (K+). Accuracies were 4.3% (Cl−), -15% (SO42−), -17% (Na+) and 3.5% (K+). Precisions were ±0.64 (Cl−), ±0.95 (SO42−), ±1.3 (Na+) and ±2.1 (K+), as determined from comparison with a gravimetrically diluted single ion 1,000 mg L−1 Fluka™ TraceCERT® ion chromatography standard to a concentration of 250 μg L−1 for each ion.
Snowmelt Modelling
Simulations of meteorological and surface conditions over S6 were performed using version 3.9.6 of MAR, a regional climate model with a coupled near-surface snow pack component (Fettweis, et al., 2017). MAR uses an implementation of the detailed snow pack scheme “Crocus” (Vionnet, et al., 2012). Crocus simulates snow pack layering and metamorphism as a function of energy and mass transfer between the snow pack and the atmosphere, and the snow pack and the ice below. The snow pack is vertically discretized on a one-dimensional grid. The vertical resolution varied from 5 cm in the uppermost 10–15 cm by 0.65 m. MAR was run on an equal-area 15 km resolution grid for the whole of the GrIS and was forced at its boundaries every 6 h by ECMWF ERA-Interim analysis (Dee, et al., 2011). We utilized results from the pixel in the model domain which was coincident with S6. We examined simulated density, temperature, liquid water content and total meltwater production in the upper 0.65 m of the snow pack.
Data Analysis
All measurements below the LoD were considered to be 0 for all statistical analyses. All DIN, DON, DIP and major ion data were water blank-corrected using values from the respective field procedural blanks if they were above the LoD. Additionally, all blank corrected values that were negative were assumed to be 0 for all statistical analyses. Nutrient concentrations in the top ∼10 cm of all ice cores were removed prior to calculation of the mean and standard error so as not to include the solute rich surface ice. Statistical analysis was performed in RStudio v.1.1.414 (RStudio, Inc. 2018). Non-parametric statistical analyses were used on all data after testing the homogeneity of variance and normality of distribution. Spearman’s rank-order correlations were used to identify correlations between nutrient concentrations and time for snow meltwater samples. Identification of statistical differences in concentrations by date for snow pack meltwater and snow covered surface ice were achieved using Kruskal–Wallis rank sum tests, with post-hoc Dunn’s test of multiple comparisons applied to all significant Kruskal–Wallis results.
Results
Surface Ablation
The average melt rate calculated from all 25 ablation stakes over 23 days was ∼1.5 cm day−1. Stakes in quadrant five exemplify the average temporal evolution of ablation from all 25 stakes (Figure 3). Some surface melting was already evident on June 1st. Only patches of snow cover remained on June 26th.
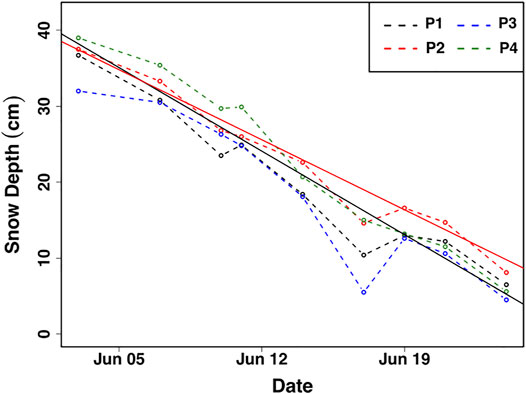
FIGURE 3. Representative surface ablation measurements from quadrant five during the sampling period. Average ablation rates of ∼1.6 and ∼1.5 cm day−1 from quadrant 5 (black solid line) and from all 25 steaks (red solid line), respectively, are given as best fit linear regression lines. P1—4 represent the four ablation poles comprising Quadrant five.
Nutrients in the Snow Pack and Underlying Ice
DIP concentrations were seldom detected in any of the snow, ice and snowmelt samples (Table 1). Hence, the remainder of the paper deals exclusively with the concentrations of DIN and DON.
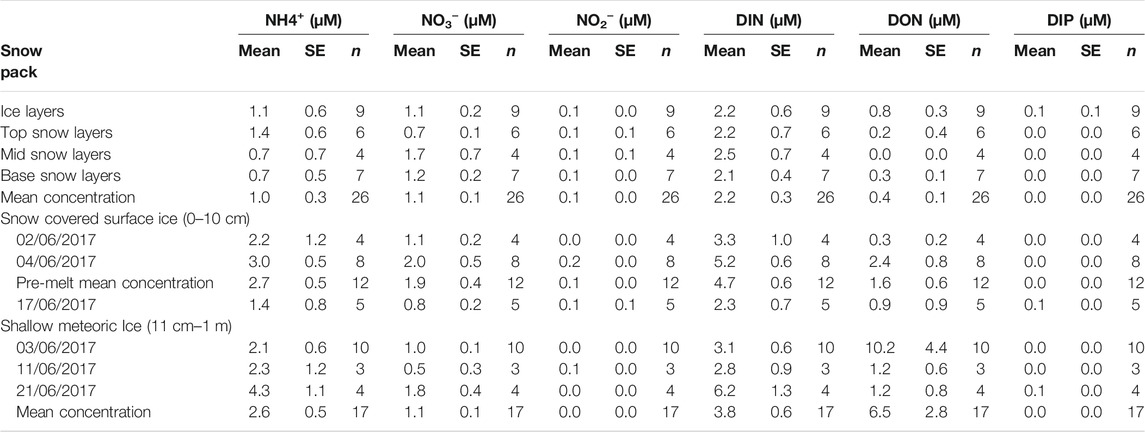
TABLE 1. Mean ± SE concentration of N species ammonium (NH4+) nitrate (NO3−), nitrite (NO2−) and dissolved organic nitrogen (DON) in the snow pack, underlying surface ice and shallow meteoric ice (to a depth of ∼1 m) near S6 on the K-Transect, SW Greenland. Dissolved inorganic phosphorus (DIP) data is also presented, although almost values are below quantification. n for snow pack samples denotes the number of layers sampled, n for snow covered surface ice samples denotes the number of samples taken on that date, and n for ice core samples denotes the number of ice layers, other than the surface 10 cm, which were sampled. Mean composition for snow covered surface ice samples only includes pre-melt sampling dates (02/06/17 and 04/06/17).
The composition of the snow pack, snow covered surface ice and underlying meteoric ice showed some striking differences, with the underlying ices containing higher average concentrations of NH4+ and the shallow meteoric ice have the highest average concentrations of DON The average DIN concentration in the snow pack was 2.2 ± 0.3 µM, consisting mostly of NH4+ (1.0 ± 0.3 µM) and NO3− (1.1 ± 0.1 µM), with minimal NO2− (0.1 ± 0.0 µM). DON concentrations were relatively low, with an average concentration of 0.4 ± 0.1 µM (Table 1). The snow pack was relatively homogeneous in terms of solute distribution, despite the presence of ice layers which usually point to redistribution of both water and solute by melting. The mean concentration of each layer was within a factor of two, with the exception of the low average concentrations of DON, where mean concentrations varied from 0.0 to 0.8 µM.
Snow covered surface ice was solute rich before significant flooding of the snow-ice interface occurred. Average DIN concentrations were 4.7 ± 0.6 µM, consisting mostly of NH4+ (2.7 ± 0.5 µM) and NO3− (1.9 ± 0.4 µM), with minimal NO2− (0.1 ± 0.0 µM). DON concentrations were lower, with an average concentration of 1.6 ± 0.6 µM (Table 1). The DIN and DON concentration of five surface ice samples towards the end of the sampling season, following extensive melting, was lower for all the major N species. The average DIN concentration decreased significantly to 2.3 ± 0.7 µM (χ2 = 4.9, p < 0.05), still consisting mostly of NH4+ (1.4 ± 0.8 µM) and NO3− (0.8 ± 0.2 µM), with minimal NO2− (0.1 ± 0.1 µM), while the average DON concentration dropped to 0.9 ± 0.9 µM (Table 1). The latter difference was statistically insignificant because of the high standard deviation.
The underlying shallow meteoric ice was richer in nutrients than the snow pack, but lower in concentration than the snow covered surface ice. The average DIN concentration was 3.8 ± 0.6 µM, consisting mostly of NH4+ (2.6 ± 0.5 µM) and NO3− (1.1 ± 0.1 µM). By contrast, DON concentrations were the highest, with an average concentration of 6.5 ± 2.8 µM, although these concentrations were variable. Elevated NH4+ concentrations were associated with sections containing visible impurities, such as dispersed cryoconite, glacier algae and the particulates which they trap.
Snowmelt Concentrations
The snowmelt elution experiments showed the elution of solutes into the first meltwater fractions, as is commonly observed in other laboratory experiments (Figure 4). The fractionation factor was defined as the concentration of the ion in the particular melt fraction divided by the average concentration of the ion in all the melt fractions. Values above one indicates that the first melt fractions were enriched in solute.
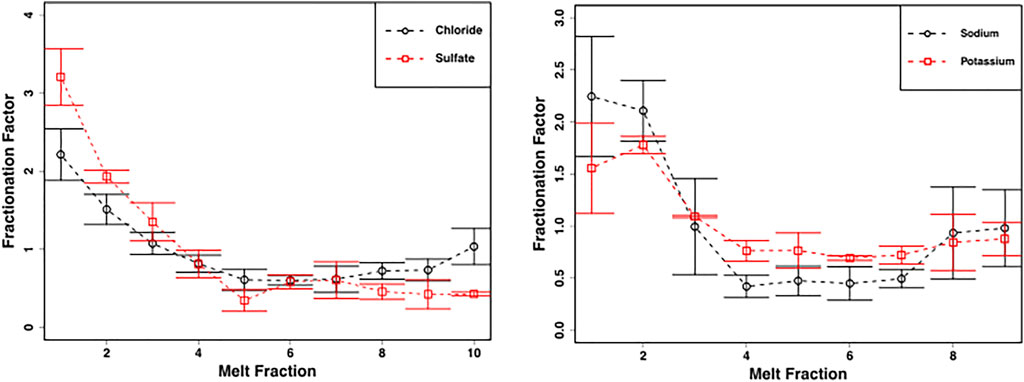
FIGURE 4. Mean ± SE chloride and sulphate concentrations (left panel) and sodium and potassium concentrations (right panel) from homogenized snow pack sections in crude laboratory melt experiment (Figure 2C) (n = 3) demonstrate fractionation of solute into the first meltwater fractions.
NO3− concentrations were significantly higher in the first meltwater fractions (χ2 = 19.0, p < 0.05), with values of 3.2 ± 0.6 µM equivalent to a fractionation factor of ∼3, and were significantly, negatively correlated to increasing melt fractions (p < 0.00001, ρ = −0.7) (Figure 5). The latter meltwater fractions were more dilute, declining to concentrations of ∼0.7 ± 0.1 µM in the last meltwaters (Figure 5).
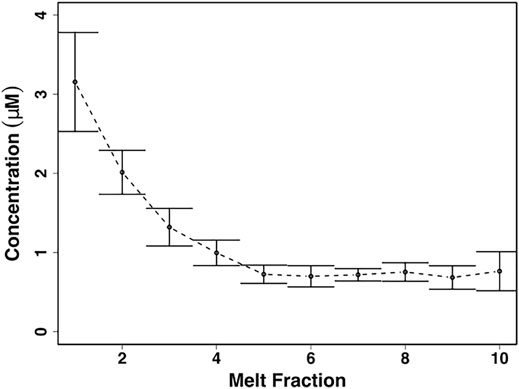
FIGURE 5. Mean ± SE nitrate (NO3−) concentrations from homogenized snow pack sections in crude laboratory melt experiment (n = 3) (Figure 2C).
NO3− concentrations in the snow pack, collected by the drip trays, were relatively constant, ∼ 1–2 μM, similar to the average concentration of NO3− in the snow pack (Figure 6). NH4+ and DON concentrations, however, fluctuated greatly, from 0–4 µM for both, with the higher concentrations well in excess of those found in the snow pack. The flooded snow pit waters showed some differences, with significantly higher initial concentrations of NO3− (∼2 µM), before declining to ∼1 µM (χ2 = 24.8, p < 0.001), resulting in a significant, negative correlation with time (p < 0.0001, ρ = −0.6). DON concentrations were more variable, ranging from ∼2 to 7 μM, with concentrations significantly higher towards the end of the sampling period than during the onset of melt (χ2 = 25.4, p < 0.001), resulting in a significant, positive correlation over time (p < 0.01, ρ = 0.4). In marked contrast, concentrations of NH4+ were usually below detection, and could only be detected in two samples, where concentrations were ∼2 and ∼1 µM (Figure 6).
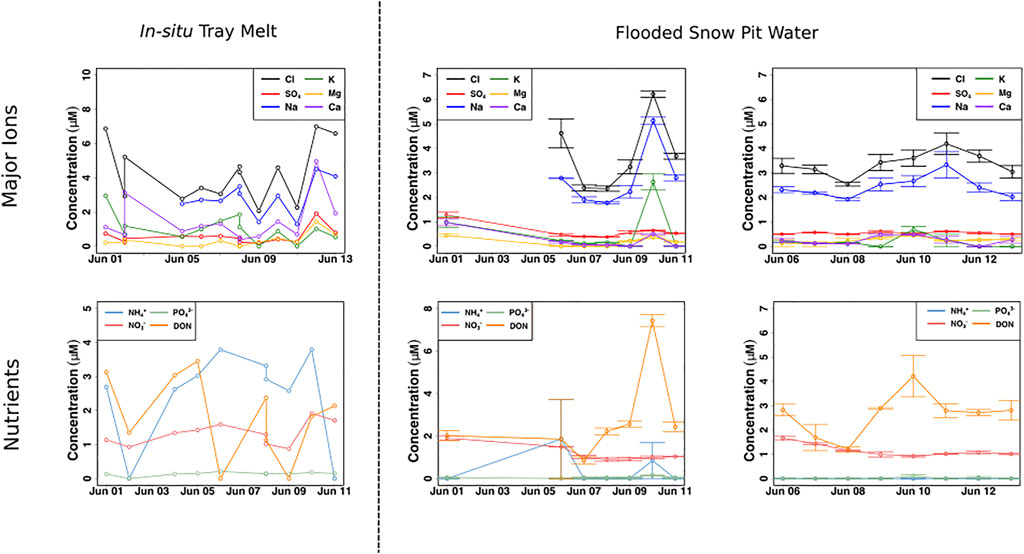
FIGURE 6. Far-left panel portrays meltwater concentrations of chloride (Cl−), sulfate (SO42−), sodium (Na+), potassium (K+), magnesium (Mg2+) and calcium (Ca2+) from the in-situ tray snowmelt (n = 1). The centre and far-right figures portray mean ± SE ammonium (NH4+), nitrate (NO3−), phosphate (PO43−) and dissolved organic nitrogen (DON) concentrations of the flooded snow pit meltwater (n = 2).
Modelled Meltwater Production During Transition From Snow to Ice
MAR calculated an initial snow pack depth of ∼40 cm on June 1st (Figure 7A). The underlying dark blue colour denotes ice, with a density of ∼920 kg m3. The overlying, and progressively thinning yellow through blue-green coloration denotes snow). This was consistent with our field observations of snow depth, given variations due to the underlying rolling topography of the surface ice. The temperature of most of the snow pack and snow covered surface ice (to a depth of at least 10 cm) was calculated to be 0°C for most of the sampling period (Figure 7B). MAR indicated that the snow pack already contained liquid water on June 1st, consistent with our field observations and the collection of melt within the snow pack, while the presence of liquid water in the snow pit and the flooding of basal snow in ice topographic lows was also consistent with the model liquid water content (Figure 7C). Finally, the calculated daily meltwater production was ∼10 mm water equivalent (w.e.) during the snow pack sampling season (Figure 7D). Our average measured surface lowering ranged from 1.4–1.6 cm day−1, which, when multiplied by snow density calculated by MAR (∼0.5–0.6 kg cm−3; Figure 7A), was equivalent to a daily production of ∼7–10 mm w.e., confirming the consistency of our field measurements with MAR output.
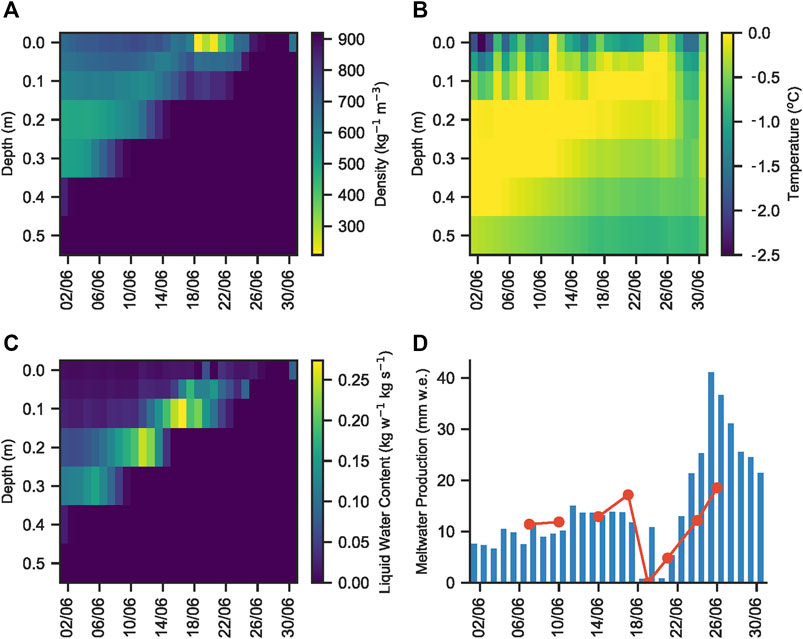
FIGURE 7. (A) Modelled snow and ice density, (B) temperature, (C) liquid water content and (D) daily meltwater production, as calculated by MAR in the vicinity of S6 on the K-Transect, SW Greenland, from June 1–July 1. The red line on plot (D) shows daily meltwater production calculated using Quadrant five daily snow pack melt rate multiplied by an average snow density of 0.6 kg m3, as determined from plot (A).
Discussion
This paper is the first to document N concentrations and speciation in snowmelt during the spring thaw on the GrIS. The snow pack that was sampled on June 1st had already been partially melted, as was evident from the ice layers both within, and near the base of the snow pack. The average NO3− concentration of the snow pack, 1.1 µM (Table 1), is lower than those found in the interior of the ice sheet (Fibiger, et al., 2016), but comparable to those nearer the margin (Telling, et al., 2012). It is equivocal whether the elevated average concentrations of NO3− contained in the surface ice, 1.9 µM (Table 1), with respect to the underlying shallow meteoric ice, 1.1 µM, is the result of refreezing of earlier solute-rich meltwater. Superimposed ice formation, when snow melt refreezes on the underlying cold ice surface, is common on Greenland (Huybrechts, et al., 1991), and so is a plausible explanation for the increased average NO3− concentration. However, a difficulty with this explanation is that DON and NH4+ concentrations in both the surface ice (mean values 1.6 and 2.7 µM, respectively) and shallow meteoric ice are high (mean values 6.5 and 2.6 µM, respectively) are even higher in comparison with the average snow pack concentrations (mean values 0.4 and 1.0 µM, respectively; Table 1). Elution studies generally show that NO3− is preferentially eluted with respect to NH4+, since the latter is more readily soluble in ice crystals (Cragin et al., 1996). The nature of the surface ice beneath the snow cover was such that is was difficult to be certain that it was truly superimposed ice. The surface ice was relatively bubble free but appeared to form a continuum with the previous season’s weathering crust. This is likely a consequence of earlier concentrated snowmelt soaking into and refreezing within the weathering crust (Figure 8). Therefore, it may well be that the surface ice was a mixture of both superimposed ice and weathering crust, which better explains the relative concentrations of NO3−, NH4+ and DON concentrations in the snow pack, shallow surface ice and meteoric ice. DON concentrations are discussed further below.
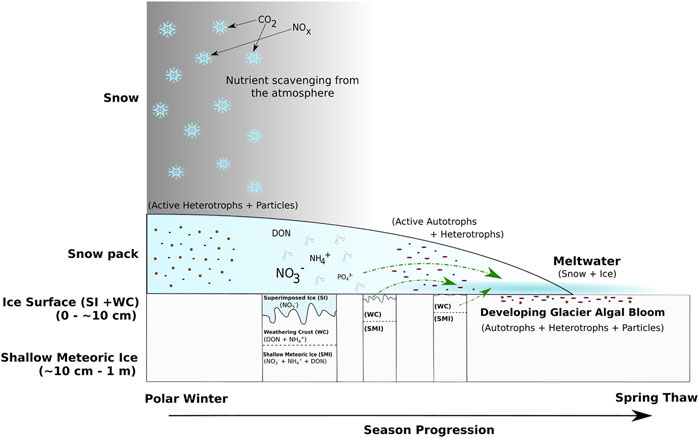
FIGURE 8. Conceptual diagram of the transition from polar winter to spring thaw in the supraglacial environment of the GrIS Dark Zone. Green lines represent nutrient inputs to surface ice environments during the spring thaw. Active microbial communities represent potential influencers on nutrient concentration and phase released by the different sources.
The average ablation rate from June 3–26, was ∼1.5 cm day−1, resulting in copious meltwater flowing both through the snow pack and across the snow-ice interface. The concentration of NO3− in snowmelt collected within the snow pack was relatively constant, with values oscillating around the mean snow pack concentration (1.1 µM; Figure 6), tracking the changes in major ion concentrations to a first approximation (Figure 6). This suggests that NO3− in snowmelt is associated with factors such as variations in melt rate, melt routing and solute banding in the snow path, which control the overall composition of more conservative solutes in snow and snowmelt, such as Cl− (Tsiouris, et al., 1985; Cragin, et al., 1996). NH4+ and DON concentrations, however, were much more variable, with both exceeding the average snow pack concentration by factors of ∼3 and ∼10, respectively, while also on occasion having values below quantification. It is therefore possible that microbiological processes in the melting snow pack may be influencing the concentrations of NH4+ and DON. NH4+ is oxidized by several types of microbes in many oxic environments (Venter, et al., 2004; Könneke, et al., 2005; He, et al., 2018) and both NH4+ and DON are common by-products of microbial activity (Telling, et al., 2012; Stibal, et al., 2012a). Hence, microbial communities within the melting snow pack may have an impact on the oscillating concentrations of NH4+ and DON.
The crude laboratory melt experiments show that even the leached, well metamorphosed snow found in the snow pack during early June shows solute fractionation into the first meltwaters, including NO3−, during melting (Figures 4, 5). This is in marked contrast to the more constant NO3− concentrations found in the snow pack meltwaters. The most likely explanation for this is that, stochastically, leaching of the surface layers of solute-rich ice crystals by meltwater is approximately balanced by the melting of solute-poor ice crystal interiors throughout the snowpack, so that, on average, the snowmelt composition is similar to the average composition of the snow pack. This is unlikely to be the case earlier in the melt season, when the first meltwaters draining from snow packs are often solute-rich (Tranter, et al., 1986; Cragin, et al., 1996; Hodson, 2006).
The nutrient composition in meltwaters that flooded the base of the snow pits was very different to that in the snow pack (Figure 6). This is an important observation for those designing glacier algae incubation studies and modelling the potential for glacier algal productivity in the early melt season. Initial NO3− concentrations were significantly higher than concentrations later in the sampling period, reaching nearly 2 μM, nearly double the average snow pack concentration, then decreasing and stabilizing around 1 μM, similar to the average snow pack concentration, for the remainder of the sampling period. DON concentrations fluctuated significantly, with initial concentrations of ∼2 μM, then later reaching as high as 7 µM. By contrast, NH4+ concentrations were mostly undetected. The pre-melt snow covered surface ice contained comparable concentrations of NO3−, 1.9 µM (Table 1), making it a likely source of the additional flooded meltwater NO3−, while both the shallow meteoric ice and surface ice are the most likely DON sources. High DON concentrations, between 5–14 μM, have been reported for surface ice hosting high concentrations of glacier algae in the GrIS Dark Zone during the summer months (Holland, et al., 2019). Therefore, it is likely that DON frozen into the weathering crust during the previous autumn is a source to meltwater flowing across the snow-ice interface. The lack of NH4+ in the flooded basal meltwaters, in contrast with the relatively high average concentrations in the surface and shallow meteoric ice (∼2.6 µM) points to microbial processes being a sink near the snow-ice interface.
Our field observations suggest that there may be a mixed transition layer of bubble-free surface ice through to higher proportions of bubbly meteoric ice within the top 10 cm of ice, consistent with the presence of superimposed ice above frozen snowmelt that flooded the weathering crust of the previous year (Figure 8). Hence, we postulate that nutrients from the superimposed ice and the previous season’s weathering crust are leached as snowmelt floods and partially melts the surface ice. Evidence for the leaching of nutrients from the surface ice is shown by a significantly lower DIN concentration, the lowest NO3− and NH4+ concentrations and lower than average DON concentrations (Table 1) in snow covered surface ice collected on June 17th, which had been subject to wetting by snowmelt. NO3− concentrations from the snow covered surface ice collected on June 17th, 0.8 µM (Table 1), were similar to those reported for ice collected in June on a transect through the GrIS Dark Zone (∼0.6 µM (Telling, et al., 2012)). The inverse correlations between NO3− and DON concentrations over time in the meltwater traversing the snow-ice interface further supports the potential leaching of surface ice. NO3− rich superimposed ice likely melted first, giving rise to significantly higher early NO3− concentrations, and the subsequent exposure of DON rich weathering crust and meteoric ice giving rise to the later significant increase in DON concentrations (Figure 8).
Melt modelling indicated that at least 10 cm of the surface ice underlying the snow pack had a temperature of 0°C (Figure 7B), likely warmed by meltwater flowing over the ice surface, the absorption of solar radiation from light penetrating the shallow snow cover and latent heat release associated with superimposed ice formation (Wadham and Nuttall, 2002). Furthermore, solar radiation that penetrates to the snow-ice interface can be absorbed by glacier algae frozen into the weathering crust of the previous year. Glacier algae have been shown to repurpose absorbed ultraviolet and short-wave radiation for localized melt generation via excess heat generated during metabolization (Williamson, et al., 2020). This likely leads to further ice melt in the micro-environments under the snow pack, similar to the frozen cryoconite holes in the McMurdo Dry Valleys, Antarctica, melting out first at depth in the ice (Bagshaw, et al., 2007). This concurs with field observations of shallow meteoric ice containing wet layers in the presence of glacier algae and dispersed cryoconite. We further note that glacier algal abundances of 2.2 ± 0.8 × 10² cells ml−1 for ice cores and 2.1 ± 0.8 × 10³ cells ml−1 for surface ice collected in early June 2017 from a nearby sampling site (Nicholes, et al., 2019). Hence, we contend that the melt modelling results, supported by our field observations, are evidence that conditions at the snow-ice interface were conducive to the development of micro-environments in which glacier algae can begin to metabolise before the snow cover is fully ablated (Figure 1).
Conclusion
This study provides the first dataset on the concentration and speciation of dissolved N in snowmelt within the Dark Zone of the GrIS. The variation in dissolved N concentrations and speciation point to active microbial processes in the snowpack and underlying surface ice, involving uptake of NH4+. A further key observation is that growth of glacier ice algae in the surface ice beneath the snowpack, a continuum of the weathering crust from the previous melt season and refrozen snowmelt (superimposed ice), occurs before the snowpack has completely melted. These assertions require confirmation by detailed microbiological studies. Our aim has been to use the comparison of the concentrations of the N species in the snow pack, underlying surface ice and shallow meteoric ice to provide an insight into the physical and biological processes that control the abundance and species. We contend that, as snowmelt has been shown to be an important nutrient source to many other cryospheric environments, knowledge regarding its impact on the seasonal growth cycle of glacier algae is critical. Melting had already occurred before sampling commenced. The decaying, partially leached snow pack gave rise to meltwaters in which the NO3− concentration was relatively constant and approximated the average NO3− concentration of the snow pack (1.1 µM). By contrast, NH4+ and DON concentrations were more variable, fluctuating notably higher and lower than their average snow pack concentration, 1.0 and 0.4 µM respectively. This variability could be the result of microbial uptake and production within the melting snow pack. Snowmelt flooding at the snow-ice interface appears to scavenge DON and NO3− from the superimposed ice, weathering crust continuum, yet NH4+ is largely absent, presumably as a result of consumption by microbial activity. Absorption of solar radiation by pigmented glacier algae, likely results in localized melting and production of micro-environments in which the glacier algae can metabolise before the surface snow cover disappears. The assertion is consistent with field observations of localized areas of melt around debris-rich layers in the shallow meteoric ice cores and is supported by modelling results from MAR. Hence, glacier algal blooms may commence before the snow pack has completely melted (Figure 1) and occur at a time when meltwaters percolating into the remains of the weathering crust from the previous melt season are enhanced in nutrients, as a result of scavenging from the snow pack, superimposed ice layers and the former weathering crust itself. These processes should be considered when prescribing microbiological studies and incubation experiments to understand the initiation of glacier algal blooms.
Data Availability Statement
The raw data supporting this article will be made available by the authors, without undue reservation.
Author Contributions
AH and MT conceived and designed the study. AH, CW, AA, and The Black and Bloom Group collected the samples. AH conducted all nutrient and data analysis. AH and AT analysed the results of the snow melt modeling. AH and MT wrote the manuscript, and all authors reviewed the final version.
Funding
This project has received funding from the European Commission (Horizon 2020 Marie Sklodowska-Curie Actions, Grant No. 675546). This work was also funded in part by the United Kingdom Natural Environment Research Council Consortium (Black and Bloom (NE/M021025/1)). MT acknowledges support from the ERC during the completion and review of the manuscript (ERC Synergy Grant 856416 DEEP PURPLE).
Conflict of Interest
The authors declare that the research was conducted in the absence of any commercial or financial relationships that could be construed as a potential conflict of interest.
The reviewer TV declared a past co-authorship with one of the authors MT to the handling editor.
Publisher’s Note
All claims expressed in this article are solely those of the authors and do not necessarily represent those of their affiliated organizations, or those of the publisher, the editors and the reviewers. Any product that may be evaluated in this article, or claim that may be made by its manufacturer, is not guaranteed or endorsed by the publisher.
Acknowledgments
The authors would like to thank and acknowledge the entire Black and Bloom group, especially those involved in the sample collection conducted during the 2017 field season. The authors would also like to thank Fotis Sgouridis and Ioanna Petropoulou for their assistance with laboratory instrument maintenance and upkeep, which made sample analysis possible. MAR v3.9.6 outputs were provided by Xavier Fettweis (University of Liege, Belgum).
References:
Bagshaw, E. A., Tranter, M., Fountain, A. G., Welch, K. A., Basagic, H., and Lyons, W. B. (2007). Biogeochemical Evolution of Cryoconite Holes on Canada Glacier, Taylor Valley, Antarctica. J. Geophys. Res. 112, G4. doi:10.1029/2007JG000442
Bales, R. C., Sommerfeld, R. A., and Kebler, D. G. (1990). Ionic Tracer Movement through a Wyoming Snowpack. Atmos. Environ. A. Gen. Top. 24 (11), 2749–2758. doi:10.1016/0960-1686(90)90162-g
Box, J. E., Fettweis, X., Stroeve, J. C., Tedesco, M., Hall, D. K., and Steffen, K. (2012). Greenland Ice Sheet Albedo Feedback: Thermodynamics and Atmospheric Drivers. The Cryosphere 6 (4), 821–839. doi:10.5194/tc-6-821-2012
Brimblecombe, P., Clegg, S. L., Davies, T. D., Shooter, D., and Tranter, M. (1987). Observations of the Preferential Loss of Major Ions from Melting Snow and Laboratory Ice. Water Res. 21 (10), 1279–1286. doi:10.1016/0043-1354(87)90181-3
Cook, J. M., Tedstone, A. J., Williamson, C., McCutcheon, J., Hodson, A. J., Dayal, A., et al. (2020). Glacier Algae Accelerate Melt Rates on the South-Western Greenland Ice Sheet. The Cryosphere 14, 309–330. doi:10.5194/tc-14-309-2020
Cragin, J. H., Hewitt, A. D., and Colbeck, S. C. (1996). Grain-scale Mechanisms Influencing the Elution of Ions from Snow. Atmos. Environ. 30 (1), 119–127. doi:10.1016/1352-2310(95)00232-n
Davies, T. D., Vincent, C. E., and Brimblecombe, P. (1982). Preferential Elution of strong Acids from a Norwegian Ice Cap. Nat. 300 5888, 161–163. doi:10.1038/300161a0
Dee, D. P., Uppala, S. M., Simmons, A. J., Berrisford, P., Poli, P., Kobayashi, S., et al. (2011). The ERA-Interim Reanalysis: Configuration and Performance of the Data Assimilation System. Q.J.R. Meteorol. Soc. 137 (656), 553–597. doi:10.1002/qj.828
Dibb, J. E., Talbot, R. W., Munger, J. W., Jacob, D. J., and Fan, S.-M. (1998). Air-snow Exchange of HNO3and NOyat Summit, Greenland. J. Geophys. Res. 103 (D3), 3475–3486. doi:10.1029/97jd03132
Fettweis, X., Box, J. E., Agosta, C., Amory, C., Kittel, C., Lang, C., et al. (2017). Reconstructions of the 1900-2015 Greenland Ice Sheet Surface Mass Balance Using the Regional Climate MAR Model. The Cryosphere 11, 1015–1033. doi:10.5194/tc-11-1015-2017
Fibiger, D. L., Dibb, J. E., Chen, D., Thomas, J. L., Burkhart, J. F., Huey, L. G., et al. (2016). Analysis of Nitrate in the Snow and Atmosphere at Summit, Greenland: Chemistry and Transport. J. Geophys. Res. Atmos. 121 (9), 5010–5030. doi:10.1002/2015jd024187
Fuhrer, K., Neftel, A., Anklin, M., Staffelbach, T., and Legrand, M. (1996). High-resolution Ammonium Ice Core Record Covering a Complete Glacial-Interglacial Cycle. J. Geophys. Res. 101 (D2), 4147–4164. doi:10.1029/95jd02903
Harrington, R., and Bales, R. C. (1998). Modeling Ionic Solute Transport in Melting Snow. Water Resour. Res. 34 (7), 1727–1736. doi:10.1029/98wr00557
He, H., Zhen, Y., Mi, T., Fu, L., and Yu, Z. (2018). Ammonia-oxidizing Archaea and Bacteria Differentially Contribute to Ammonia Oxidation in Sediments from Adjacent Waters of Rushan Bay, China. Front. Microbiol. 9, 116. doi:10.3389/fmicb.2018.00116
Hewitt, A., Cragin, J., and Colbeck, S. (1991). “Effects of crystal Metamorphosis on the Elution of Chemical Species from Snow,” in Proceedings of the 48th Annual Eastern Snow Conference, Guelph, June 5–7, 1–10.
Hodson, A. (2006). Biogeochemistry of Snowmelt in an Antarctic Glacial Ecosystem. Water Resour. Res. 42 (11), W11406. doi:10.1029/2005wr004311
Hodson, A. J., Mumford, P. N., Kohler, J., and Wynn, P. M. (2005). The High Arctic Glacial Ecosystem: New Insights from Nutrient Budgets. Biogeochemistry 72 (2), 233–256. doi:10.1007/s10533-004-0362-0
Holland, A. T., Williamson, C. J., Sgouridis, F., Tedstone, A. J., McCutcheon, J., Cook, J. M., et al. (2019). Dissolved Organic Nutrients Dominate Melting Surface Ice of the Dark Zone (Greenland Ice Sheet). Biogeosciences 16 (16), 3283–3296. doi:10.5194/bg-16-3283-2019
Huybrechts, P., Letreguilly, A., and Reeh, N. (1991). The Greenland Ice Sheet and Greenhouse Warming. Glob. Planet. Change 3 (4), 399–412. doi:10.1016/0921-8181(91)90119-H
Johannessen, M., Dale, T., Gjessing, E., Henriksen, A., and Wright, R. (1975). Acid Precipitation in Norway: the Regional Distribution of Contaminants in Snow and the Chemical Concentration Processes during Snowmelt. IAHS Publ. 118, 116–120.
Johannessen, M., and Henriksen, A. (1978). Chemistry of Snow Meltwater: Changes in Concentration during Melting. Water Resour. Res. 14 (4), 615–619. doi:10.1029/wr014i004p00615
Keegan, K. M., Albert, M. R., McConnell, J. R., and Baker, I. (2014). Climate Change and forest Fires Synergistically Drive Widespread Melt Events of the Greenland Ice Sheet. Proc. Natl. Acad. Sci. 111 (22), 7964–7967. doi:10.1073/pnas.1405397111
Könneke, M., Bernhard, A. E., de la Torre, J. R., Walker, C. B., Waterbury, J. B., and Stahl, D. A. (2005). Isolation of an Autotrophic Ammonia-Oxidizing marine Archaeon. Nature 437 (7058), 543–546. doi:10.1038/nature03911
Mayewski, P. A., Meeker, L. D., Whitlow, S., Twickler, M. S., Morrison, M. C., Bloomfield, P., et al. (1994). Changes in Atmospheric Circulation and Ocean Ice Cover over the North Atlantic during the Last 41,000 Years. Science 263 (5154), 1747–1751. doi:10.1126/science.263.5154.1747
Nicholes, M. J., Williamson, C. J., Tranter, M., Holland, A., Poniecka, E., Yallop, M. L., et al. (2019). Bacterial Dynamics in Supraglacial Habitats of the Greenland Ice Sheet. Front. Microbiol. 10, 1366. doi:10.3389/fmicb.2019.01366
Remias, D., Schwaiger, S., Aigner, S., Leya, T., Stuppner, H., and Lütz, C. (2012). Characterization of an UV- and VIS-Absorbing, Purpurogallin-Derived Secondary Pigment New to Algae and Highly Abundant in Mesotaenium Berggrenii (Zygnematophyceae, Chlorophyta), an Extremophyte Living on Glaciers. FEMS Microbiol. Ecol. 79 (3), 638–648. doi:10.1111/j.1574-6941.2011.01245.x
Rignot, E., and Kanagaratnam, P. (2006). Changes in the Velocity Structure of the Greenland Ice Sheet. Science 3115763, 986–990. doi:10.1126/science.1121381
Rignot, E., Velicogna, I., van den Broeke, M. R., Monaghan, A., and Lenaerts, J. T. M. (2011). Acceleration of the Contribution of the Greenland and Antarctic Ice Sheets to Sea Level Rise. Geophys. Res. Lett. 38, L05503. doi:10.1029/2011GL046583
Ryan, J. C., Hubbard, A., Stibal, M., Irvine-Fynn, T. D., Cook, J., Smith, L. C., et al. (2018). Dark Zone of the Greenland Ice Sheet Controlled by Distributed Biologically-Active Impurities. Nat. Commun. 9 (1), 1065. doi:10.1038/s41467-018-03353-2
Shepherd, A., Ivins, E. R., A, G., Barletta, V. R., Bentley, M. J., Bettadpur, S., et al. (2012). A Reconciled Estimate of Ice-Sheet Mass Balance. Science 338 (6111), 1183–1189. doi:10.1126/science.1228102
Silvente, E., and Legrand, M. (1993). Ammonium to Sulphate Ratio in Aerosol and Snow of Greenland and Antarctic Regions. Geophys. Res. Lett. 20 (8), 687–690. doi:10.1029/93gl00982
Stibal, M., Box, J. E., Cameron, K. A., Langen, P. L., Yallop, M. L., Mottram, R. H., et al. (2017a). Algae Drive Enhanced Darkening of Bare Ice on the Greenland Ice Sheet. Geophys. Res. Lett. 44, 1–11. doi:10.1002/2017GL075958
Stibal, M., Gãzdereliler, E., Cameron, K. A., Box, J. E., Stevens, I. T., Gokul, J. K., et al. (2015). Microbial Abundance in Surface Ice on the Greenland Ice Sheet. Front. Microbiol. 6, 225. doi:10.3389/fmicb.2015.00225
Stibal, M., Telling, J., Cook, J., Mak, K. M., Hodson, A., and Anesio, A. M. (2012a). Environmental Controls on Microbial Abundance and Activity on the greenland Ice Sheet: a Multivariate Analysis Approach. Microb. Ecol. 63 (1), 74–84. doi:10.1007/s00248-011-9935-3
Stroeve, J., Box, J. E., Wang, Z., Schaaf, C., and Barrett, A. (2013). Re-evaluation of MODIS MCD43 Greenland Albedo Accuracy and Trends. Remote sensing Environ. 138, 199–214. doi:10.1016/j.rse.2013.07.023
Tedstone, A. J., Bamber, J. L., Cook, J. M., Williamson, C. J., Fettweis, X., Hodson, A. J., et al. (2017). Dark Ice Dynamics of the South-West Greenland Ice Sheet. The Cryosphere 11 (6), 2491–2506. doi:10.5194/tc-11-2491-2017
Telling, J., Anesio, A. M., Tranter, M., Fountain, A. G., Nylen, T., Hawkings, J., et al. (2014). Spring Thaw Ionic Pulses Boost Nutrient Availability and Microbial Growth in Entombed Antarctic Dry Valley Cryoconite Holes. Front. Microbiol. 5, 694. doi:10.3389/fmicb.2014.00694
Telling, J., Anesio, A. M., Tranter, M., Irvine-Fynn, T., Hodson, A., Butler, C., et al. (2011). Nitrogen Fixation on Arctic Glaciers, Svalbard. J. Geophys. Res. 116, G3. doi:10.1029/2010jg001632
Telling, J., Stibal, M., Anesio, A. M., Tranter, M., Nias, I., Cook, J., et al. (2012). Microbial Nitrogen Cycling on the Greenland Ice Sheet. Biogeosciences 9 (7), 2431–2442. doi:10.5194/bg-9-2431-2012
Tranter, M., Brimblecombe, P., Davies, T. D., Vincent, C. E., Abrahams, P. W., and Blackwood, I. (1986). The Composition of Snowfall, Snowpack and Meltwater in the Scottish highlands-evidence for Preferential Elution. Atmos. Environ. (1967) 20 (3), 517–525. doi:10.1016/0004-6981(86)90092-2
Tsiouris, S., Vincent, C. E., Davies, T. D., and Brimblecombe, P. (1985). The Elution of Ions through Field and Laboratory Snowpacks. A. Glaciology. 7, 196–201. doi:10.3189/s0260305500006169
Venter, J. C., Remington, K., Heidelberg, J. F., Halpern, A. L., Rusch, D., Eisen, J. A., et al. (2004). Environmental Genome Shotgun Sequencing of the Sargasso Sea. science 304 (5667), 66–74. doi:10.1126/science.1093857
Vionnet, V., Brun, E., Morin, S., Boone, A., Faroux, S., Le Moigne, P., et al. (2012). The Detailed Snowpack Scheme Crocus and its Implementation in SURFEX v7.2. Geosci. Model. Dev. 5 (3), 773–791. doi:10.5194/gmd-5-773-2012
Wadham, J. L., Hawkings, J., Telling, J., Chandler, D., Alcock, J., O'Donnell, E., et al. (2016). Sources, Cycling and export of Nitrogen on the Greenland Ice Sheet. Biogeosciences 13 (22), 6339–6352. doi:10.5194/bg-13-6339-2016
Wadham, J. L., and Nuttall, A.-M. (2002). Multiphase Formation of Superimposed Ice during a Mass-Balance Year at a Maritime High-Arctic Glacier. J. Glaciol. 48 (163), 545–551. doi:10.3189/172756502781831025
Wientjes, I. G. M., and Oerlemans, J. (2010). An Explanation for the Dark Region in the Western Melt Zone of the Greenland Ice Sheet. The Cryosphere 4 (3), 261–268. doi:10.5194/tc-4-261-2010
Wientjes, I. G. M., Van de Wal, R. S. W., Reichart, G. J., Sluijs, A., and Oerlemans, J. (2011). Dust from the Dark Region in the Western Ablation Zone of the Greenland Ice Sheet. The Cryosphere 5 (3), 589–601. doi:10.5194/tc-5-589-2011
Wientjes, I. G. M., Van De Wal, R. S. W., Schwikowski, M., Zapf, A., Fahrni, S., and Wacker, L. (2012). Carbonaceous Particles Reveal that Late Holocene Dust Causes the Dark Region in the Western Ablation Zone of the Greenland Ice Sheet. J. Glaciol. 58 (210), 787–794. doi:10.3189/2012JoG11J165
Williams, M., Brown, A., and Melack, J. (1991). Biochemical Modifications of Snowpack Runoff in an alpine basin. IAHS Publ. 204, 257–465.
Williamson, C. J., Anesio, A. M., Cook, J., Tedstone, A., Poniecka, E., Holland, A., et al. (2018). Ice Algal Bloom Development on the Surface of the Greenland Ice Sheet. FEMS Microbiol. Ecol. 94 (3), fiy025. doi:10.1093/femsec/fiy025
Williamson, C. J., Cameron, K. A., Cook, J. M., Zarsky, J. D., Stibal, M., and Edwards, A. (2019). Glacier Algae: a Dark Past and a Darker Future. Front. Microbiol. 10, 524. doi:10.3389/fmicb.2019.00524
Williamson, C. J., Cook, J., Tedstone, A., Yallop, M., McCutcheon, J., Poniecka, E., et al. (2020). Algal Photophysiology Drives Darkening and Melt of the Greenland Ice Sheet. Proc. Natl. Acad. Sci. 117, 5694–5705. doi:10.1073/pnas.1918412117
Wolff, E. W. (2013). Ice Sheets and Nitrogen. Philos. Trans. R. Soc. Lond. B Biol. Sci. 368 (1621), 20130127. doi:10.1098/rstb.2013.0127
Keywords: dissolved nitrogen, dissolved nutrients, spring thaw, snow pack, Greenland ice sheet, nutrient release
Citation: Holland AT, Williamson CJ, Tedstone AJ, Anesio AM and Tranter M (2022) Dissolved Nitrogen Speciation and Concentration During Spring Thaw in the Greenland Ice Sheet Dark Zone: Evidence for Microbial Activity. Front. Earth Sci. 10:711560. doi: 10.3389/feart.2022.711560
Received: 18 May 2021; Accepted: 07 February 2022;
Published: 02 March 2022.
Edited by:
Alun Hubbard, Aberystwyth University, United KingdomReviewed by:
Andrew C. Mitchell, Aberystwyth University, United KingdomTrista J. Vick-Majors, Michigan Technological University, United States
Copyright © 2022 Holland, Williamson, Tedstone, Anesio and Tranter. This is an open-access article distributed under the terms of the Creative Commons Attribution License (CC BY). The use, distribution or reproduction in other forums is permitted, provided the original author(s) and the copyright owner(s) are credited and that the original publication in this journal is cited, in accordance with accepted academic practice. No use, distribution or reproduction is permitted which does not comply with these terms.
*Correspondence: Martyn Tranter, martyn.tranter@envs.au.dk