Phenological Changes in Alpine Grasslands and Their Influencing Factors in Seasonally Frozen Ground Regions Across the Three Parallel Rivers Region, Qinghai-Tibet Plateau
 Chun-Ya Wang1,2,3
  Jin-Niu Wang1,4*
  Xu-Feng Wang3
  Dong-Liang Luo5
  Yan-Qiang Wei6
  Xia Cui7
  Ning Wu1
  Priyamvada Bagaria1
- 1Chengdu Institute of Biology, Chinese Academy of Sciences, Chengdu, China
- 2Earth Sciences College, Chengdu University of Technology, Chengdu, China
- 3Key Laboratory of Remote Sensing of Gansu Province, Heihe Remote Sensing Experimental Research Station, Northwest Institute of Eco-Environment and Resources, Chinese Academy of Sciences, Lanzhou, China
- 4Mangkang Ecological Monitoring Station, Tibet Ecological Security Barrier Ecological Monitoring Network, Qamdo, China
- 5State Key Laboratory of Frozen Soil Engineering, Northwest Institute of Eco-Environment and Resources, Chinese Academy of Sciences, Lanzhou, China
- 6Northwest Institute of Eco-Environment and Resources, Chinese Academy Sciences, Lanzhou, China
- 7School of Resources and Environmental Sciences, Lanzhou University, Lanzhou, China
Alpine ecosystems are sensitive and vulnerable to climate change. In this study, we extracted three phonological parameters, viz. the start of the growing season (SOS), the end of the growing season (EOS), and the length of the growing season (LOS) from the moderate resolution imaging spectroradiometer (MODIS) normalized difference vegetation index (NDVI) dataset during 2000–2019 for alpine grasslands across the three parallel rivers region (TPRR), and also examined the spatiotemporal heterogeneity of the three phenological parameters in seasonally frozen ground regions (hereafter referred to as SFGR) in response to climate change. The results showed that the multiyear mean SOS gradually delayed from 100 to 160 days along higher elevation, EOS advanced as a whole (from 320 to 280 days), and LOS shortened (from 210 to 130 days). The multiyear mean spatial distribution of all the three parameters showed significant north-to-south differences in the TPRR. In general, the variation trends in all the phenological parameters were not significant (p > 0.05) in the past 20 years, where SOS was advanced by 0.16 days year−l, EOS delayed by 0.08 days year−l, and consequently LOS extended at a rate of 0.07 days year−l, likely due to the warming and drying climate during the study period. In addition, annual mean temperature (AMT) was negatively correlated with SOS (50.26%) and positively correlated with EOS and LOS (72.25 and 60%, respectively). As for the annual mean total precipitation (AMP), it was positively correlated with SOS and EOS (50.77 and 52.97%, respectively) and negatively correlated with LOS (52.07%). Furthermore, a higher freezing index led to a delayed SOS and an advanced EOS and a shortened LOS at the regional scale. Similar to AMT, a higher thawing index advanced the SOS, delayed the EOS, and extended the LOS. Our results confirmed the importance of climate and permafrost status on vegetation phenological processes and also contributed toward understanding the response of cold region ecosystems to global climate change.
Introduction
Plant phenology has attracted strong scientific attention in recent years for its relationship with different driving factors of climate change (Rauste et al., 2007; Shen et al., 2015b; Zhao et al., 2016; Ganjurjav et al., 2020). Vegetation phenology plays an essential role in the terrestrial ecosystem, as it is indicative of seasonal activities and physiological processes. Traditionally, vegetation phenology is monitored mainly through ground-based visual observation of the seasonal and inter-annual changes in plant phenology (e.g., plant germination, leaf expansion, flowering, fruiting, withering, falling leaves, etc.) (Richardson et al., 2013; Zhai et al., 2015). However, traditional visual observation is time-consuming and is limited by personal bias. It is being gradually replaced by advanced technological methods of remote sensing phenological data acquisition. For example, a near-ground phenological camera has been widely used in recent studies (Klosterman et al., 2014; Weil et al., 2017). Meanwhile, the emergence of remote sensing technology has greatly broadened the scope of vegetation phenological observations due to its virtues of multi-temporal, long time series, and large-scale regional as well as global datasets (Hmimina et al., 2013; Zhao et al., 2015; Piao et al., 2019). Vegetation indices, such as the NDVI, the enhanced vegetation index (EVI), and the leaf area index (LAI), have been used to infer the timing of vegetation phenology (Delbart et al., 2005; Shen et al., 2014a; Wen et al., 2021).
In the past few decades, the phenomena of advanced spring phenology, delayed autumn phenology, and longer growing seasons have been observed in varying degrees due to assessing the impact of climate change. Studies have reported significant regional-specific differences in the phenological timeline of the observed vegetation (Wang et al., 2013a; Zhang et al., 2013; Zhao et al., 2015; Piao et al., 2019). The available vegetation phenological data, which are mainly from the 1980s and 1990s at middle and high latitudes of the northern hemisphere, show weaker trends of changing phenological cycle, in comparison with the studies in the early 2000s (Zeng et al., 2011; Zhao et al., 2015; Cong and Shen, 2016). Most studies present an obvious trend toward early spring and delayed autumn (Richardson et al., 2013; Zhao et al., 2015). A more detailed description also referred that the changes in phenological trends in Eurasia are more significant than in North America, and the greatest change has occurred in Europe (Zhou et al., 2001).
In China, studies of vegetation phenology are mainly focused on the north temperate zone and high-altitude areas (Jiao et al., 2020; Fu et al., 2021), where the “amplifier” of global warming signals demonstrates a greater rate and amplitude of rising temperature (Wang et al., 2014; Ganjurjav et al., 2020). The Qinghai-Tibet Plateau (QTP), as the “third pole” of the world, has been considered as one of the most sensitive regions to global climate change. In recent years, different views have been declared on vegetation phenological trends in the QTP. Spring phenology of vegetation has advanced in most areas of the QTP, whereas delayed in a few other areas (e.g., the southwest part of the Plateau) (Chen et al., 2015; Shen et al., 2015b; Shen et al., 2016). However, the trend of vegetation phenology in the QTP has been debated in recent studies, likely due to their differences in data sources, methodologies, and study periods (Piao et al., 2011; Shen et al., 2013). The alpine grassland in the QTP shows regional heterogeneity and plays a crucial role in ecosystem functioning and services and is highly sensitive to climatic changes (Ganjurjav et al., 2020; Fu et al., 2021). It has been concluded that temperature and precipitation play important roles in phenological changes in the QTP (Zhou et al., 2001; Yu et al., 2010; Wang et al., 2015). Temperature is the main climatic factor regulating vegetation phenology across the QTP, whereas in a few areas, precipitation and sunshine duration (alternatively, radiation) become more important than temperature (Shen et al., 2011; Che et al., 2014; Shen et al., 2014b). Vegetation phenology in humid areas is more sensitive to the preseason temperature than to the preseason precipitation, and the relatively arid western regions of QTP are divergent or on the contrary. In conclusion, vegetation spring phenology in all these areas has been implicated interactively to covariance control of altitude gradient (Shen et al., 2015a; Liu et al., 2020b).
In the alpine grassland ecosystem, variation in frozen soil can drive vegetation phenology, including abiotic physical factors such as climate and photoperiod (Gao et al., 2020a; Wen et al., 2021). After the Arctic and the Antarctic, the QTP has the largest permafrost and seasonally frozen ground region in the world (Cheng and Jin, 2013; Zou et al., 2017; Jiang et al., 2018). Global warming has already induced significant changes in permafrost and seasonally frozen ground regions throughout most of the Arctic and alpine regions (e.g., increasing active layer thickness, decreasing freezing depth, degradation of permafrost, etc.) (Sazonova and Romanovsky, 2003; Zhao et al., 2004; Jones et al., 2016). Frozen soil, as the sentinel, integrator, and regulator of climate change, may affect ecological and hydrological processes via variations in water and heat exchange between the ground and atmosphere in alpine regions (Jiang et al., 2018). These variations can regulate the growth and phenology of vegetation significantly (Hayashi, 2014; Liu et al., 2021) and also indicate that the periodic physiological activities of plants in response to climate change influence the surface-energy flux and carbon budget over a large area (Morisette et al., 2009; Qiao et al., 2021). Therefore, it is essential to monitor the spatiotemporal patterns of vegetation phenology in the SFGR and explore its responses to climatic factors, frozen soil changes, and other such parameters to elucidate the role of vegetation phenology in alpine ecosystems.
The three parallel rivers region (TPRR) is in the transitional zone from the QTP to the Yunnan-Guizhou Plateau, where the typical longitudinal valleys of the Hengduan Mountains are located. The TPRR has attracted much attention as a famous scenic spot and world natural heritage site, global biodiversity, and cultural hotspot at home and abroad (Wang et al., 2013a; Lin et al., 2018). The TPRR is experiencing unprecedented eco-environmental challenges with urbanization and road construction as well as a series of tourism developments (Li et al., 2012). Only a few current studies have been reported on vegetation growth conditions and phenological changes, but without integration of the physical and spatial dynamics of the alpine grasslands in the SFGR (Cheng et al., 2018; Gao et al., 2020b; Yao et al., 2020). The underlying mechanism linkages between seasonally frozen ground and vegetation phenology largely remain understudied in this region.
Thus, we used MODIS NDVI data from 2000 to 2019 for the SFGR, extracted three key phenological parameters (SOS, EOS, and LOS), and established the datasets. We further analyzed the spatiotemporal pattern of regional vegetation phenology with the relevant driving factors and explored the following objectives: 1) investigate the pixel-scale spatiotemporal pattern of the alpine grassland phenology in the SFGR; 2) detect if there are significant trends of vegetation phenological parameters in the alpine grasslands using the time series data; 3) assess the characteristics and linkages of climatic factors and permafrost with vegetation phenology. Our results are expected to provide a scientific reference in the TPRR for the restoration and conservation of regional vegetation ecosystems.
Materials and Methods
Study Area
The TPRR (24◦00′∼36◦00′N, 90◦20′∼102◦20′E) is located in the southern part of the QTP in the longitudinal mountains and valleys of the Hengduan Mountains, spanning Qinghai, Tibet, Sichuan, and Yunnan provinces of China, with a total area of approximately 500,670 km2 (Gao et al., 2020a; Yao et al., 2020) (Figure 1). Its upper sections consist of three major rivers of Asia: Nujiang River (the upper reach of the Salween River down in Burma), Lancang River (the upper reach of the Mekong River extending to Vietnam), and Jinsha River (the major upper reach of the Yangtze River) (Wang et al., 2013b; Liang et al., 2014; Cheng et al., 2018). They flow almost parallelly from the Qamdo Prefecture, southeastern Tibet, to northwestern Yunnan and then gradually take separate routes. Hence, the region is named the “Three Parallel Rivers Region” (Kingdon Ward, 1923; Xiao and Xiang, 2017).
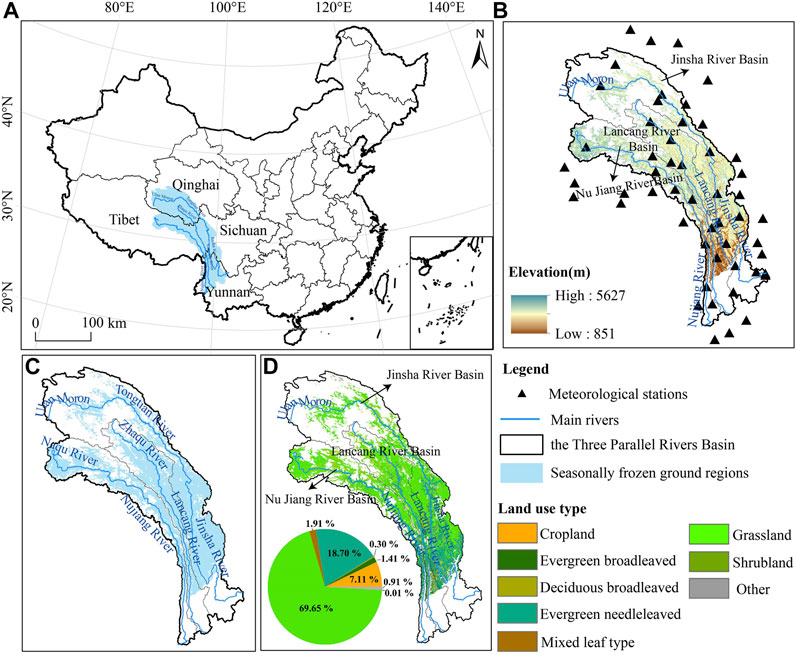
FIGURE 1. Location and vegetation type of the study area. (A) The location of TPRR in China; (B) elevation gradients and meteorological sites across the TPRR; (C) seasonally frozen ground regions in the TPRR; and (D) land-use types of TPRR.
The TPRR is characterized by high mountains and longitudinal valleys, with an elevation ranging from 562 to 6,717 m a.s.l., with generally higher elevations in the northwestern parts and lower elevations in the southeastern parts. Due to its unique geographical location and long-term historical evolution, it is well recognized as global biodiversity and cultural hotspot (Lin et al., 2018). The region is influenced by the southwest monsoon and southeast monsoon and is characterized by warm and humid summers and cold and dry winters. Our study area boundaries were extracted from DEM data, combined with watershed data from the Resource and Environment Science and Data Center of the Chinese Academy of Sciences (https://www.resdc.cn) and relevant references (Li and Hao, 2003; Wu et al., 2011).
Data Sources and Preprocessing
Remote Sensing Data
The MOD13Q1 dataset was used to obtain the NDVI during 2000–2019 and conduct a phenological analysis of the TPRR, which was provided by the National Aeronautics and Space Administration (NASA, available from https://ladsweb.modaps.eosdis.nasa.gov/search/order/) with a spatial resolution of 250 m, corresponding to a maximum synthetic reflectance for 16 days. The dataset has been corrected through a variety of methods, including calibration and removal of atmospheric disturbances and other effects (Khare et al., 2019; Wen et al., 2021). Firstly, we used NASA’s MODIS Reprojection Tool (MRT) for data format conversion, image mosaicking, reprojection, mask extraction, and other operations to extract regional NDVI data. To facilitate spatial analysis, we resampled the NDVI data and obtained a 300-m NDVI time-series dataset. Then, the Savitzky–Golay (S-G) filtering method was used to smoothen and reduce noise in the original NDVI data.
Meteorological Data
Daily air temperature, ground surface temperature, and precipitation during 2000–2019 in this study were derived from the China Meteorological Data Service Centre (http://data.cma.cn/) for 52 meteorological stations in the TPRR and nearby. The meteorological data interpolated by ANUSPLINE can better reflect the spatial heterogeneity of each variable (Tan et al., 2016; Liu et al., 2020b), so we used ANUSPLINE for spatial interpolation and obtained meteorological gridded data with a spatial resolution of 300 m, matching the resolution of NDVI data. Finally, we obtained two major datasets: 1) the annual long time-series dataset of annual mean temperature and precipitation; 2) the regional interannual freezing/thawing index dataset, from which we calculated air freezing index (AFI), air thawing index (ATI), ground surface freezing index (GFI), and ground surface thawing index(GTI). The specific calculation process is mentioned later in Methods.
Additional Data
ESA CCI-LC land cover types during 2000–2015 were provided by the European Space Agency (http://maps.elie.ucl.ac.be/CCI/viewer/) with a spatial resolution of 300 m, which has been widely used in land use/land cover dynamic monitoring around the world because of its high overall accuracy (Yang et al., 2017; Gang et al., 2018). Figure 1 shows that the vegetation type in this area was mainly alpine grassland, accounting for nearly 70% of the total area. To minimize the impact of land-use changes on the distribution of vegetation types, we referred to the research methods by Liu et al. (2020a). In this study, areas with no change in vegetation types during 2000–2015 were extracted to represent each vegetation type cover status of this region in recent years. Besides, DEM data at a spatial resolution of 90 × 90 m here were collected from the Earth Science Data Cloud (http://www.gscloud.cn).
In this paper, we resampled all remote sensing data at a 300-m resolution using the nearest neighbor method to facilitate correlation analysis based on pixel scale.
Methods
Extraction of Phenological Parameters
The common methods for phenological parameters extraction include threshold, moving average, maximum slope method, etc. We referred to the research method by Wen et al. (2021) and used the dynamic threshold method to extract three key phenological parameters of alpine grassland in the TIMESAT 3.2 (Jonsson and Eklundh, 2004).
Firstly, we used the S-G filter function to smoothen the NDVI series, which has been considered to be the most effective and widely used method (Zhao et al., 2015; Stanimirova et al., 2019; Liu et al., 2020b). Here, we adopted the adaptation strength of 2.0, the seasonal parameter of 0.5, and the window size of 4 for the S-G filter. Next, we defined NDVI thresholds for identifying the dates of major phenological events by referring to the relevant literature on the phenological characteristics of alpine grassland in the QTP (Ding et al., 2013; Guan et al., 2019; Huang et al., 2019). Given the low vegetation cover in this region, our study sets the relative thresholds of the growing season, which starts and ends at approximately 20 and 50% of the annual amplitude of NDVI, respectively (Chen et al., 2012; Zhang et al., 2013; Ma et al., 2016). Finally, we used EOS minus SOS to obtain LOS and extracted vegetation phenological parameters for alpine grassland in the SFGR for each year and pixel over the last 20 years. In addition, this study also used Julian days to convert the phenological period, i.e., the phenological period was expressed as the actual number of days from January 1 [also expressed as the day of the year (DOY)].
Calculating the Freezing/Thawing Variables
The annual freezing/thawing index was calculated with the daily observed temperature data, including AFI, ATI, GFI, and GTI. The freezing/thawing index is the cumulative value of temperature less than (greater than) 0°C in the specified period, respectively. To ensure the temperature data of the same freezing (thawing) period used in the calculation of the freezing/thawing index, the freezing index was specified to be calculated from July 1 of each year to June 30 of the following year, and the thawing index was calculated from January 1 to December 31 of each year. The specific principles and calculation methods are mentioned in the references (Luo et al., 2014; Shi et al., 2019).
Trend and Correlation Analysis
Sen slope is a nonparametric estimation method, which can be used to calculate the variability of data, and the results of the Mann–Kendall (M-K) test are largely uninterrupted by outliers (Wen et al., 2021). A combination of them has been widely used in vegetation trend analysis and long-term series data analysis in recent years (Gocic and Trajkovic, 2013). In this paper, we classified regional sen slope value into the following main categories: if sen > 0, it indicates delayed or extended; conversely, sen < 0 indicates advanced or shortened. Meanwhile, M-K test with a 95% confidence level was conducted by Che et al. (2014) and Zhu et al. (2019). The trends could be estimated by combining Sen’s slope and the M-K test in light of the phenological parameters. Given confidence level α = 0.05, whether the trend changed significantly depended on the |Z| score, which the following categories are available: 1) significantly advanced or shortened (sen < 0, |Z| > 1.96); 2) insignificantly advanced or shortened (sen < 0, |Z| ≤ 1.96); 3) insignificantly delayed or extended (sen > 0, |Z| ≤ 1.96); 4) significantly delayed or extended (sen > 0, |Z| > 1.96).
We calculated the pixel-by-pixel correlation coefficients (r) and p-values (P) of phenology with climate factors and freezing/thawing indices using Matlab 2015b and analyzed the relationships between them. The calculation formula is as follows (Che et al., 2014):
where x is the independent variable (climate factor, freezing/thawing index), and y is the phenological parameter (SOS, EOS, and LOS). We tested the significance of the correlation coefficients with P-values. The correlation coefficients in this study were mainly divided into three levels (Che et al., 2014): strong correlation (0.8 < r ⩽ 1), medium correlation (0.3 < r ⩽ 0.8), and weak correlation (0 < r ⩽ 0.3). Here α = 0.05.
Results
Spatial and Temporal Patterns of Vegetation Phenology
The temporal trends results of the vegetation phenology in this region showed that there was an advanced SOS trend at a rate of 1.64 days per decade (p > 0.05) and a delayed EOS trend at a rate of 0.81 days per decade. No significant changes were found for LOS, which extended by an average of 0.74 days per decade (Figure 2). Our results also showed a significant spatial difference in phenological trends (Figure 3).
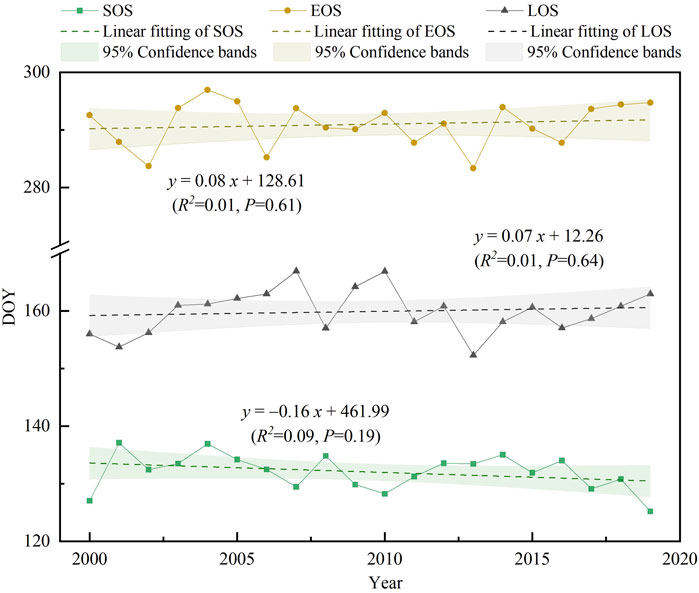
FIGURE 2. Inter-annual changes of vegetation phenology from 2000 to 2019.
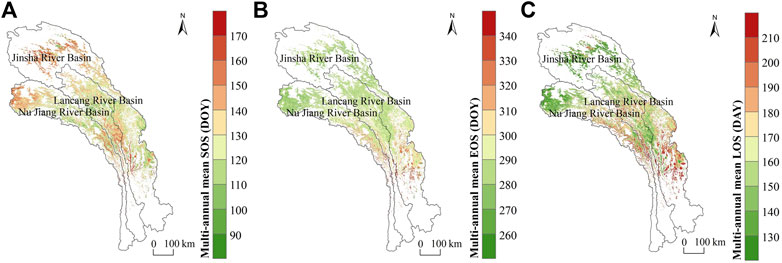
FIGURE 3. Spatial distribution of multi-annual mean vegetation phenology. (A) SOS; (B) EOS; and (C) LOS.
The multiyear mean SOS of alpine grasslands in this region ranged from 90 to 170 days (approximately 80% of the overall pixels), i.e., from the end of March to the end of May (Figure 3A). However, the variation in SOS is not obvious across space. From northwest to southeast, the overall trend of the multiyear mean SOS showed advancement. However, there was delayed SOS in the TPRR at the junction of Yunnan and Tibet, where the multiyear mean SOS was around 130–150 days.
Compared with SOS, EOS showed an opposite trend in spatial distribution, i.e., EOS was gradually delayed from the northwest to the southeast (Figure 3B), and the spatial variation of EOS was much more pronounced than that of SOS. Specifically, the multiyear average EOS mainly appeared in 260–340 days per year, among which the EOS in most of the northern regions was generally concentrated in the range of 270–300 days (82.05%), i.e., from September to October. On the other hand, the overall EOS in the south was later, basically after 300 days, i.e., later than October, over less than 20% of the area.
Most of the LOS varied from 130 to 210 days, and the multiyear mean LOS gradually extended from the northwest to the southeast, showing a vertical divergence pattern more consistent with SOS (Figure 3C). The LOS in most areas is between 130 and 170 days (more than 50% of the area), which is mainly distributed in the northwestern high mountains and deep valleys of the TPRR, such as the river source areas of each basin and the middle reaches of the basins.
Trends of Vegetation Phenology
We calculated the linear trends of SOS, EOS, and LOS at a 95% confidence level (Figure 4). The results showed an advanced trend in the SOS of alpine grasslands in most areas. There was an advancing trend in the northwestern part of the study area, but the degree of advancement was modest (33.92%), of which less than 2% was significantly advanced, mainly in the upper reaches of the Lancang River basin. A few areas in the southern part of the region showed a trend of insignificantly delayed SOS, especially in the TPRR, whereas significantly delayed areas only accounted for 2.89% (Figures 4A,B; Table 1).
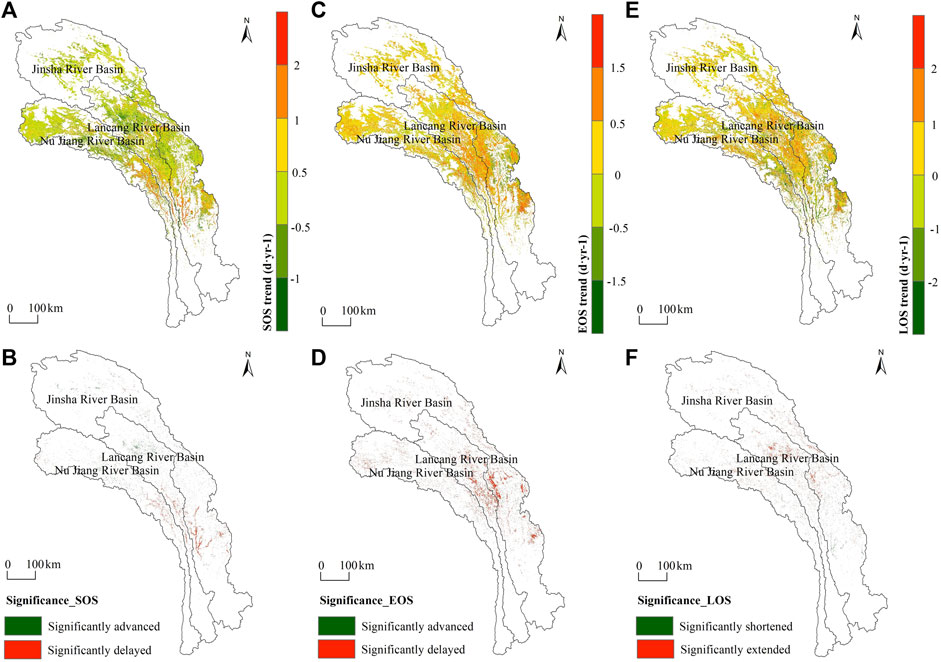
FIGURE 4. Inter-annual variation [SOS (A), EOS (B), and LOS (C)] and significant changes (D–F) of vegetation phenology during 2000–2019 in study area. Significant trend corresponds to a p < 0.05.
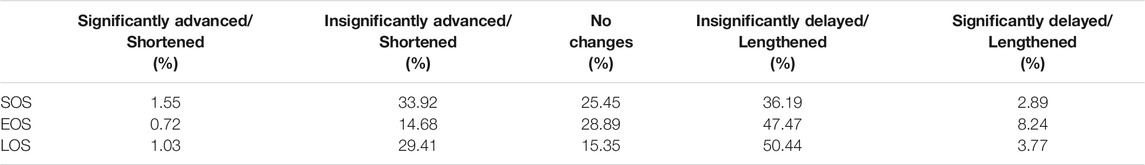
TABLE 1. Overall trend and proportion of different phenological trends from 2000 to 2019 in SFGR.
EOS, on the other hand, mainly showed a trend of extension. The area of significantly delayed EOS accounted for 8.24% and was mainly distributed in the central part of the basin, such as in the middle reaches of the two major areas, the Lancang River basin and Jinsha River basin. The areas with insignificantly delayed EOS accounted for most parts of the study area (47.47%) and were almost distributed in the source area and the central part of the basin. In addition, the areas with EOS advancement were scattered in the midstream of the basin, whereas the regions with significant advancement accounted for less than 1% (Figures 4C,D; Table 1).
In the past 20 years, the LOS showed a trend of lengthening, with 50.44 and 29.41% of the areas showing insignificantly extended and shortened LOS, respectively (Figures 4E,F; Table 1). A relatively similar distribution concentrated in the source area of the basin and the central part of the study area was observed. For the pixel points with significant changes, the extended areas were mainly concentrated in a few areas in the upper reaches of the Lancang River basin and the middle reaches of the Jinsha River basin.
Relationships Between Vegetation Phenology and Climate Factors
From the spatial distribution of the multiyear mean values of the climate factors, the annual precipitation in the region gradually decreased from the south to the north during 2000–2019. The distribution of temperature had typical mountainous characteristics due to the special geographical location, i.e., the temperature was higher in the river valley. In addition, as the AMT and AMP gradually decreased with the increasing altitude, the trend was more significant (p < 0.05), reflecting strong dependence of climate factors on altitude (Supplementary Figures S1, S2).
The correlation coefficient between SOS and temperature ranged from approximately −0.78 to 0.83 (Figure 5), where SOS was negatively correlated with AMT in approximately 50.26% of areas. Out of these areas, 6.05% of the areas showed a significant correlation (p < 0.05), mainly at the junction of the Jinsha river basins and Lancang River basins, as well as the TPRR at the junction of Yunnan and Tibet. Also, the correlation coefficient between EOS and temperature ranged from −0.78 to 0.80, and EOS was mainly positively correlated with AMT (72.25%), and only 3.05% passed the significance test at 95% level, which was mainly sporadically distributed in the three major basins and more concentrated in the middle reaches of the basin. However, the correlation coefficients between LOS and temperature varied from −0.81 to 0.76, and there was a positive correlation between LOS with AMT for more than 60% of areas, and 3.63% of the areas were significantly correlated in the upper and middle reaches of Nujiang River and the source areas of the Lancang and Jinsha Rivers (Figure 5, Table 2).
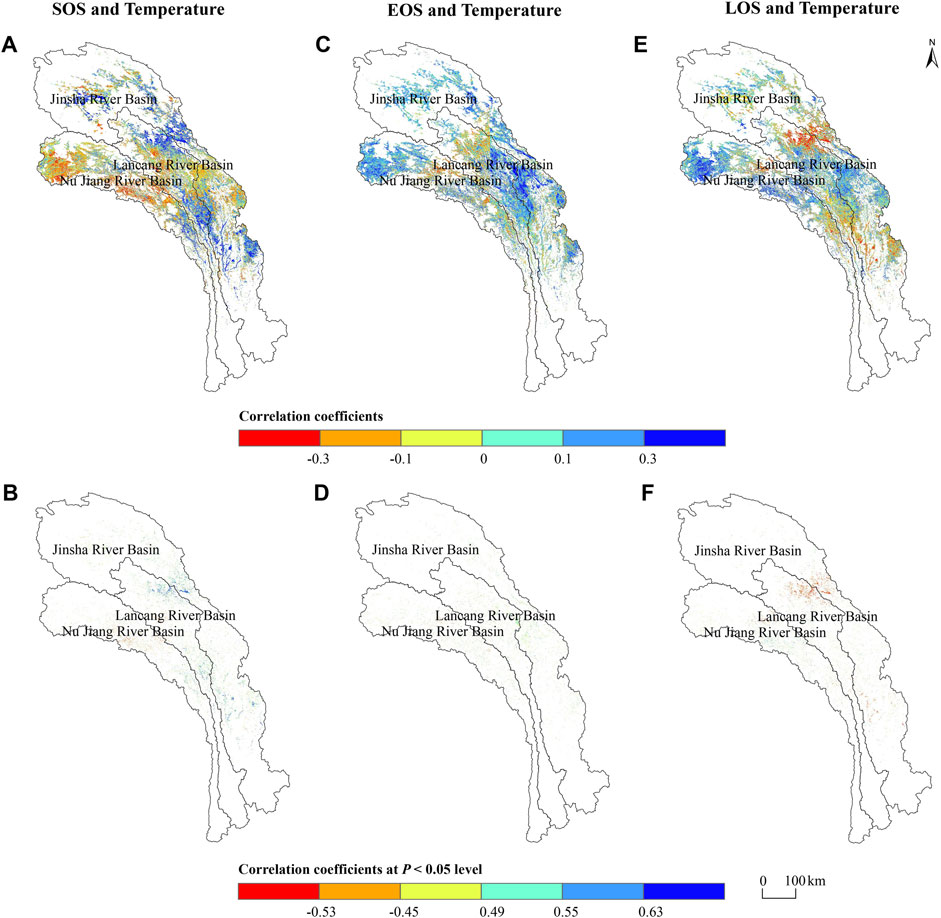
FIGURE 5. Spatial distribution of correlation coefficients between phenology [(A) SOS; (B) EOS; and (C) LOS] and temperature in TPRR.
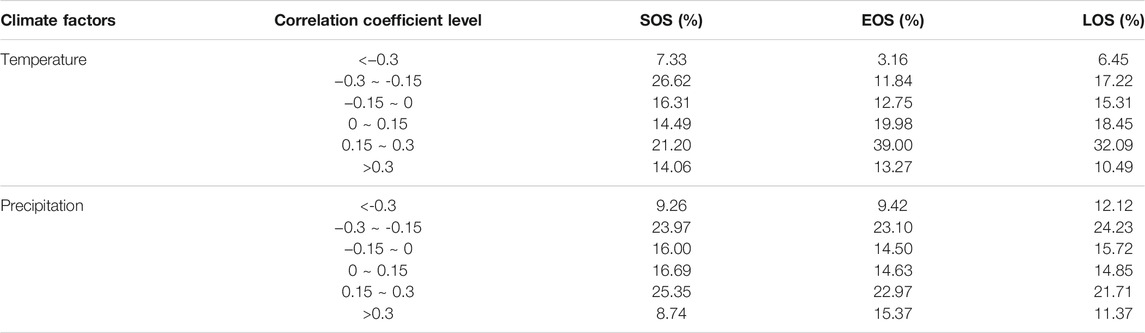
TABLE 2. Area statistics of correlation analysis between phenology and climate factors from 2000 to 2019.
The positive correlation between SOS and precipitation was more common, which ranged from −0.86 to 0.82. Only 3.86% of the areas were significantly correlated (mostly negative), mainly in the source areas of the Nujiang River basin and Jinsha River basin, and also in the midstream areas of the basins but were more scattered. EOS, with correlation coefficients between −0.82 and 0.86, was positively correlated with precipitation (52.97% of the area), and 7.47% of the areas were significantly correlated (mainly positive). These areas were mainly located in the source areas of the Nujiang River basin and the junction of the upper reaches of the Lancang River and Jinsha River basins. Furthermore, there was a negative correlation between LOS and precipitation, with 5.89% of the regions significantly correlated. It was scattered at the source of the Nujiang River basin, the upper reaches of the Lancang River basin and the Jinsha River basin, and the narrowest part of the TPRR (Figure 6).
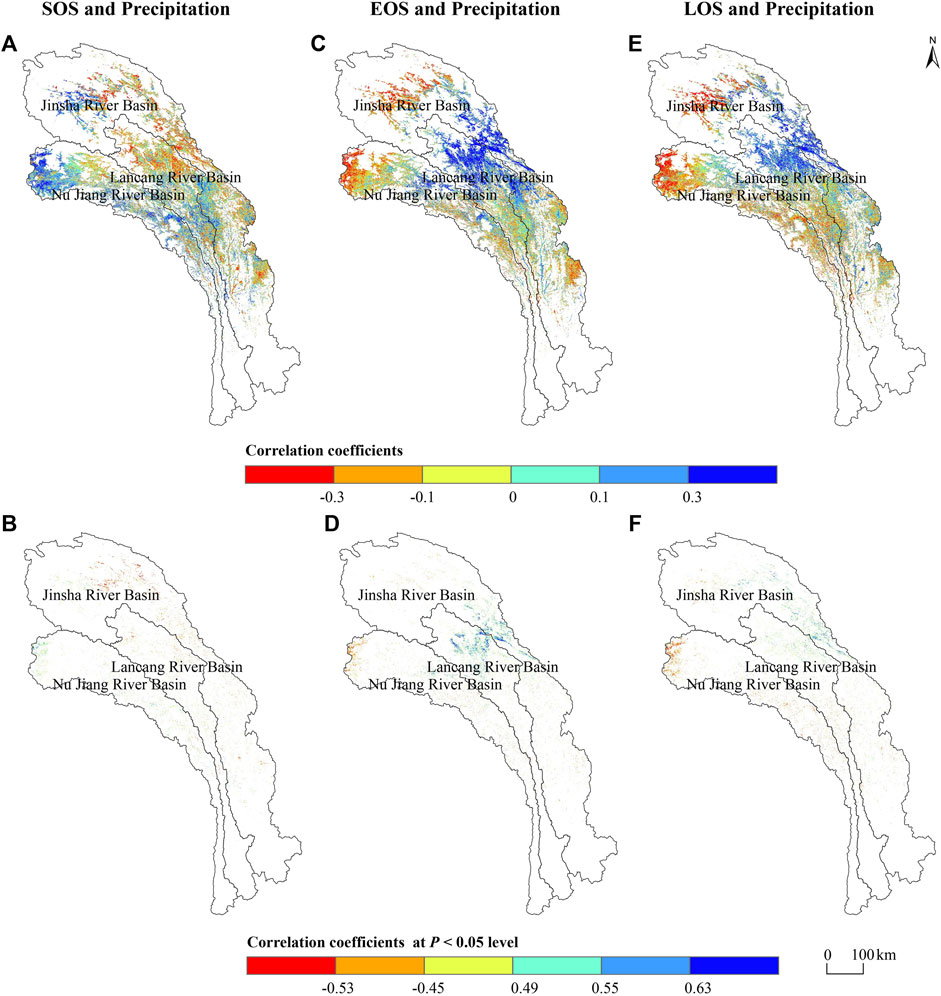
FIGURE 6. Spatial distribution of correlation coefficients between phenology [(A) SOS; (B) EOS; and (C) LOS] and precipitation in TPRR.
Effects of Freezing/Thawing Index on Vegetation Phenology
The spatial distribution of the multiyear mean freezing/thawing index showed that FI increased from the southeast to the northwest with increasing elevation. The range of AFI was higher than that of the GFI, whereas the thawing index showed a diametrically opposite trend, and the FI/TI varied greatly with elevation (Supplementary Figure S3). Besides, freezing/thawing indices variation trends indicated that FI showed a decreasing trend with significant north–south differences, whereas both GTI and ATI showed an increasing trend year by year, where ATI had a greater dependence on elevation (Supplementary Figure S4).
SOS showed a negative correlation with the freezing/thawing index (Figure 7; Table 3). Specifically, AFI was negatively correlated in more than 80% of the areas, which were mainly distributed in the two basin areas of the Lancang River and Jinsha River, whereas there is a positive correlation in the source area of the Nujiang River. However, SOS and GFI were somewhat negatively correlated (51.07% of the area) in the river source areas of the Jinsha River basin, the junction of the upper reaches of the Lancang River and Jinsha River basins, and a few areas in the valley zones of the three rivers. The positive correlation was more pronounced in the river source areas of the Nujiang and Lancang Rivers. In addition, the negative correlations between SOS and the two major thawing indices, ATI and GTI (51.21 and 59.09% of the area, respectively), were mainly found in the upstream areas of the three major basins, whereas positive correlations existed in the TPRR and the source area of the Lancang River.
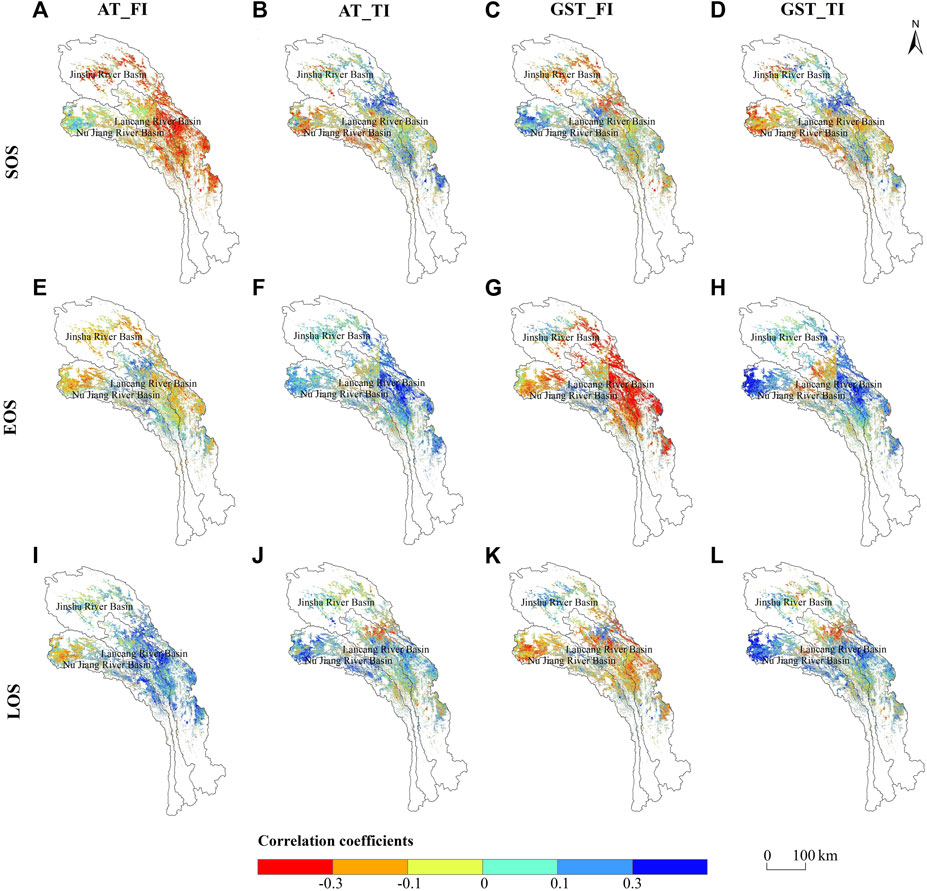
FIGURE 7. Spatial distribution of correlation coefficients between phenology [(A) SOS; (B) EOS; and (C) LOS] and freezing/thawing Index in TPRR.
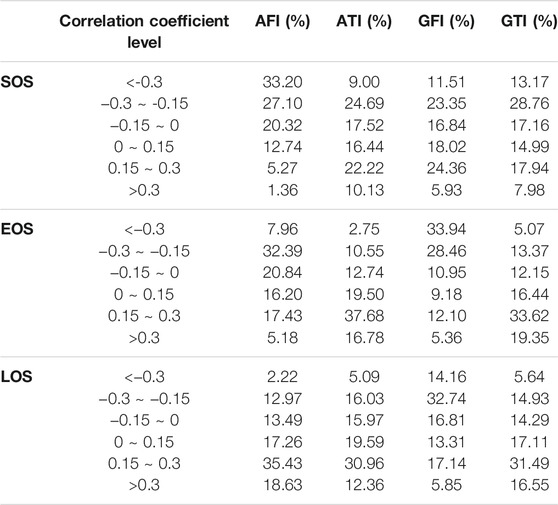
TABLE 3. Area statistics of correlation analysis between phenology and freezing/thawing indexes from 2000 to 2019.
Furthermore, more than 60% of the areas also demonstrated a negative correlation between EOS and the freezing index, in which the negative correlation between EOS and AFI (61.02%) was well reflected in the source areas of the Nujiang and Jinsha rivers and the middle reaches of the Lancang and Jinsha rivers. In 73.35% of the areas, such as the source areas of the basins and the typical regions of the TPRR, i.e., the middle reaches of the three major basins, a negative correlation between EOS and GFI was observed. Relative to the thawing index, EOS had a good positive correlation with ATI and GTI (the area proportion was 73.96 and 69.41%, respectively), which was well reflected in the source area of the Nujiang River basin and the middle reaches of Lancang River and Jinsha River basin.
Finally, there were certain differences in the correlation between LOS and the freezing index, i.e., LOS was positively correlated with AFI, accounting for approximately 71.32% of the area, which was mainly concentrated in the middle reaches of the three major river basins. However, the positive correlation was more obvious in the source area of the Nujiang River basin, whereas it was negatively correlated with GFI, with a wider distribution in the basin, and the proportion was approximately 63.70%. The area of positive correlation between LOS and thawing index accounted for approximately 65%, and the spatial distribution of correlation coefficients among LOS, ATI, and GTI was relatively consistent, mainly in the core area of the TPRR and the source area of the Nujiang River basin.
Discussion
Spatial and Temporal Patterns of Vegetation Phenology
The results indicated that vegetation phenology of alpine grasslands in the SFGR during 2000–2019 showed a trend of advancement in spring phenology, postponement of autumn phenology, and longer growing season length. In the past 20 years, SOS was advanced by approximately 0.16 days year−l, whereas EOS was delayed at a rate of 0.08 days year−l, leading to an extension of LOS (slope = 0.07 days year−l). The multiyear mean values of the phenological parameters showed significant spatial differences from the southeast to the northwest as the elevation increased. The greening period in the south was earlier than that in the north, and the withering period was relatively late due to higher temperatures. This resulted in a longer growing season length in the south as compared with the north. Although there were differences in the change ranges of phenology, the general trend and spatial distribution pattern were consistent with the findings by Guan et al. (2019), which may be related to the selection of data sources, time scale, and different methods of phenology extraction (Che et al., 2014; Ganjurjav et al., 2020).
Relationship Between Vegetation Phenology and Climatic Factors
Our results showed that with the regional climate warming and drying, vegetation phenology showed a trend of advanced SOS and delayed EOS. This shift in phenological trend led to a certain extension of the vegetation growing season length. Temperature and precipitation are the main factors influencing vegetation phenology, but their effects are different from each other. Specifically, the higher the average annual temperature, the earlier the vegetation returns to green. On the other hand, the later it enters the wilting period, the longer is the growing season. There is a good positive correlation between the total annual precipitation and SOS as well as EOS. The increase of precipitation will affect the beginning and the end of the vegetation growing season to a certain extent, leading to the shortening of the growing season length (Table 1). Some studies have shown that the interaction between climate warming and increased precipitation will affect the SOS of alpine grasslands in the QTP (Ganjurjav et al., 2020; Qiao et al., 2021). An increase in preseason temperature will lead to an earlier SOS and a delay in EOS, thus, indicating that the increase of temperature can accelerate the thawing of soil and the awakening of vegetation, leading to the advance of SOS, which is exactly consistent with our results (Ganjurjav et al., 2020; Qiao et al., 2021). However, most studies have demonstrated that vegetation phenology changes may be more strongly correlated with the preseason accumulated temperature or the temperature of the growing season, and the effect of preseason precipitation on vegetation phenology is much greater than that of seasonal or annual precipitation (Shen et al., 2011). In our study, we only analyzed the effects of annual mean temperature and total annual precipitation on phenology. These variables did not reflect a strong response of the phenological parameters to climate and need further analysis.
Impacts of Frozen Soil Changes on Vegetation Phenology
In the past 20 years, the FI/TI of the study area has shown significant geospatial differences due to altitude. There is a certain correlation between the FI and the TI, which showed an obvious decreasing trend from north to south. Specifically, a higher FI caused SOS and EOS delays and a shortened corresponding LOS, whereas the TI was the opposite. Generally speaking, the increase of FI was not conducive to vegetation growth, whereas the TI was different. In the alpine grassland ecosystem, the freezing–thawing state of soil in the frozen area will affect soil moisture and temperature, and the increase of freezing–thawing index can further provide the required hydrothermal conditions for vegetation growth and phenological change (Gao et al., 2020b). Studies on the QTP phenology suggested that degradation of frozen soil caused by warming can negatively affect vegetation spring phenology due to evaporation of soil water, which validates the findings of our study (Jiang et al., 2018). However, Jiang et al. (2018) also noted a positive correlation between SOS and thawing index, which is not quite consistent with our findings, probably because some interaction between changes in soil freezing/thawing state and soil moisture in the permafrost region would have different effects on the spring phenology of vegetation. The results of Wen et al. (2021) also further suggested that frozen soil degradation due to global warming will further affect the length of the vegetation growing season, which is consistent with our findings. A decreasing annual FI and an increasing TI in the frozen soil region indirectly indicate that the region is on a warming trend. This will directly cause the vegetation to enter the growing stage earlier and delay the wilting and yellowing period, resulting in a longer growing season length.
Conclusion
In this study, we used the NDVI dataset estimated by remote sensing to retrieve the vegetation phenological parameters of alpine grasslands and their divergent correlations with different climatic factors in the SFGR of the TPRR during 2000–2019. Due to regional warming and drying, the growing season length had been extended due to the advance in spring phenology and delay in autumn phenology. The effects of annual mean temperature and annual total precipitation had spatiotemporal heterogeneous effects on the three phenological parameters. Obvious positive correlations existed between the total annual precipitation with SOS and EOS, and the increasing precipitation shortened the length of the growing season to a certain extent. Furthermore, increased AFI/GFI led to delayed SOS and advanced EOS. In contrast, shorter the growing season length, the opposite was true for the ATI/FTI. Because vegetation phenology of alpine grasslands plays a critical role in the functioning processes of alpine ecosystems and relevant ecosystem services, there is an urgent need to figure out the dynamic balance of carbon source and sink, coupled water and thermal transfer, the interaction between vegetation and soil, and the biogeochemical cycles at local, regional, and global scales. More efforts should be focused on mechanism studies that include not just surficial phenomena, in particular, interfaces of gas, liquid, and solid multiphase flow in the frozen soil region under global climate change and human disturbances (Xiao, 2019).
Data Availability Statement
The raw data supporting the conclusions of the study are included in the article/Supplementary Material; further inquiries can be directed to the corresponding author.
Author Contributions
C-YW: Conceptualization, methodology, software, validation, formal analysis, investigation, resources, data curation, writing—original draft preparation, writing—review and editing, and visualization; J-NW: Conceptualization, validation, writing—review and editing, supervision, project administration, and funding acquisition; X-FW and D-LL: Conceptualization, methodology, and writing—review and editing; Y-QW, XC, NW, and PB: writing—review and editing.
Funding
This research was funded by the National Science Foundation of China (nos. 31971436 and 41661144045), State Key Laboratory of Cryospheric Science, Northwest Institute of Eco-Environment and Resources, Chinese Academy Sciences (SKLCSOP-2018-07), and China Biodiversity Observation Networks (Sino BON)”.
Conflict of Interest
The authors declare that the research was conducted in the absence of any commercial or financial relationships that could be construed as a potential conflict of interest.
Publisher’s Note
All claims expressed in this article are solely those of the authors and do not necessarily represent those of their affiliated organizations or those of the publisher, the editors, and the reviewers. Any product that may be evaluated in this article, or claim that may be made by its manufacturer, is not guaranteed or endorsed by the publisher.
Acknowledgments
Kind suggestions provided by the Chief Editor are greatly acknowledged. Critical comments from the reviewers greatly improved the initial manuscript.
Supplementary Material
The Supplementary Material for this article can be found online at: https://www.frontiersin.org/articles/10.3389/feart.2021.797928/full#supplementary-material
References
Che, M., Chen, B., Innes, J. L., Wang, G., Dou, X., Zhou, T., et al. (2014). Spatial and Temporal Variations in the End Date of the Vegetation Growing Season throughout the Qinghai-Tibetan Plateau from 1982 to 2011. Agric. For. Meteorology 189-190, 81–90. doi:10.1016/j.agrformet.2014.01.004
Chen, S., Liu, W., Sun, Z., Zhao, L., and Liu, Y. (2012). A Quantitative Study on the Plant Population Phenology of Alpine Meadow in the Permafrost Regions of Qinghai-Tibetan Plateau. J. Glaciology Geocryology 34 (5), 1142–1148. (in Chinese with English abstract).
Chen, X., An, S., Inouye, D. W., and Schwartz, M. D. (2015). Temperature and Snowfall Trigger alpine Vegetation green-up on the World's Roof. Glob. Change Biol. 21 (10), 3635–3646. doi:10.1111/gcb.12954
Cheng, G., and Jin, H. (2013). Permafrost and Groundwater on the Qinghai-Tibet Plateau and in Northeast China. Hydrogeol J. 21, 5–23. doi:10.1007/s10040-012-0927-2
Cheng, Z., Weng, C., Guo, J., Dai, L., and Zhou, Z. (2018). Vegetation Responses to Late Quaternary Climate Change in a Biodiversity Hotspot, the Three Parallel Rivers Region in Southwestern China. Palaeogeogr. Palaeoclimatol. Palaeoecol. 491, 10–20. doi:10.1016/j.palaeo.2017.11.032
Cong, N., and Shen, M. G. (2016). Variation of Satellite-Based spring Vegetation Phenology and the Relationship with Climate in the Northern Hemisphere over 1982 to 2009. Ying Yong Sheng Tai Xue Bao 27 (9), 2737–2746. doi:10.13287/j.1001-9332.201609.028(in Chinese with English abstract)
Delbart, N., Le Toan, T., Kergoat, L., and Fedotova, V. (2006). Remote Sensing of spring Phenology in Boreal Regions: A Free of Snow-Effect Method Using NOAA-AVHRR and SPOT-VGT Data (1982-2004). Remote Sensing Environ. 101 (1), 52–62. doi:10.1016/j.rse.2005.11.012
Ding, M., Zhang, Y., Sun, X., Liu, L., Wang, Z., and Bai, W. (2013). Spatiotemporal Variation in alpine Grassland Phenology in the Qinghai-Tibetan Plateau from 1999 to 2009. Chin. Sci. Bull. 58 (3), 396–405. doi:10.1007/s11434-012-5407-5(in Chinese with English abstract)
Fu, Y. H., Zhou, X., Li, X., Zhang, Y., Geng, X., Hao, F., et al. (2021). Decreasing Control of Precipitation on Grassland spring Phenology in Temperate China. Glob. Ecol. Biogeogr. 30, 490–499. doi:10.1111/geb.13234
Gang, C., Zhao, W., Zhao, T., Zhang, Y., Gao, X., and Wen, Z. (2018). The Impacts of Land Conversion and Management Measures on the Grassland Net Primary Productivity over the Loess Plateau, Northern China. Sci. Total Environ. 645, 827–836. doi:10.1016/j.scitotenv.2018.07.161
Ganjurjav, H., Gornish, E. S., Gao, Q. Z., Hu, G. Z., Li, Y., Schwartz, M. W., et al. (2020). Warming and Precipitation Addition Interact to Affect Plant spring Phenology in alpine Meadows on the central Qinghai-Tibetan Plateau. Agric. For. Meteorology 287, 107943. doi:10.1016/j.agrformet.2020.107943
Gao, B., Li, J., and Wang, X. (2020a). Impact of Frozen Soil Changes on Vegetation Phenology in the Source Region of the Yellow River from 2003 to 2015. Theor. Appl. Climatol 141, 1219–1234. doi:10.1007/s00704-020-03266-5
Gao, Y., Zhao, S., and Deng, J. (2020b). Developing Law of Damming Landslide and Challenges for Disaster Prevention and Mitigation in the Three-River-Parallel Territory in the Tibetan Plateau. Adv. Eng. Sci. 52 (5), 50–61. (in Chinese with English abstract). doi:10.15961/j.jsuese.202000283
Gocic, M., and Trajkovic, S. (2013). Analysis of Changes in Meteorological Variables Using Mann-Kendall and Sen's Slope Estimator Statistical Tests in Serbia. Glob. Planet. Change 100, 172–182. doi:10.1016/j.gloplacha.2012.10.014
Guan, Q., Ding, M., and Zhang, H. (2019). Spatiotemporal Variation of Spring Phenology in Alpine Grassland and Response to Climate Changes on the Qinghai-Tibet, China. Mountain Res. 37 (5), 639–648. (in Chinese with English abstract). doi:10.16089/j.cnki.1008-2786.000455
Hayashi, M. (2014). The Cold Vadose Zone: Hydrological and Ecological Significance of Frozen‐Soil Processes. Vadose Zone J. 13, vzj2013 03 0064er. doi:10.2136/vzj2013.03.0064er
Hmimina, G., Dufrêne, E., Pontailler, J.-Y., Delpierre, N., Aubinet, M., Caquet, B., et al. (2013). Evaluation of the Potential of MODIS Satellite Data to Predict Vegetation Phenology in Different Biomes: An Investigation Using Ground-Based NDVI Measurements. Remote Sensing Environ. 132, 145–158. doi:10.1016/j.rse.2013.01.010
Huang, W., Zeng, T., and Huang, X. (2019). Spatiotemporal Dynamics of alpine Grassland Phenology on the Tibetan Plateau. Pratacultural Sci. 36 (4), 1032–1043. (in Chinese with English abstract). doi:10.11829/j.issn.1001-0629.2019-0048
Jiang, H., Zhang, W., Yi, Y., Yang, K., Li, G., and Wang, G. (2018). The Impacts of Soil Freeze/thaw Dynamics on Soil Water Transfer and spring Phenology in the Tibetan Plateau. Arctic, Antarctic, Alpine Res. 50, e1439155. doi:10.1080/15230430.2018.1439155
Jiao, F., Liu, H., Xu, X., Gong, H., and Lin, Z. (2020). Trend Evolution of Vegetation Phenology in China during the Period of 1981-2016. Remote Sensing 12, 572. doi:10.3390/rs12030572
Jones, B. M., Baughman, C. A., Romanovsky, V. E., Parsekian, A. D., Babcock, E. L., Stephani, E., et al. (2016). Presence of Rapidly Degrading Permafrost Plateaus in South-central Alaska. The Cryosphere 10, 2673–2692. doi:10.5194/tc-10-2673-2016
Jönsson, P., and Eklundh, L. (2004). TIMESAT-a Program for Analyzing Time-Series of Satellite Sensor Data. Comput. Geosciences 30, 833–845. doi:10.1016/j.cageo.2004.05.006
Khare, S., Drolet, G., Sylvain, J.-D., Paré, M. C., and Rossi, S. (2019). Assessment of Spatio-Temporal Patterns of Black Spruce Bud Phenology across Quebec Based on MODIS-NDVI Time Series and Field Observations. Remote Sensing 11, 2745. doi:10.3390/rs11232745
Klosterman, S. T., Hufkens, K., Gray, J. M., Melaas, E., Sonnentag, O., Lavine, I., et al. (2014). Evaluating Remote Sensing of Deciduous forest Phenology at Multiple Spatial Scales Using PhenoCam Imagery. Biogeosciences 11, 4305–4320. doi:10.5194/bg-11-4305-2014
Li, H., Yao, W. J., Wang, S. Q., Su, P. F., Duan, Q. C., Wang, W. X., et al. (2012). Three Parallel Rivers World Natural Heritage Site Ecological Safety Protection Research. Adv. Mater. Res. 599, 278–281. doi:10.4028/www.scientific.net/amr.599.278
Li, L., and Hao, Z. (2003). The Automated Extraction of Catchment Properties from Digital Elevation Models. Adv. Earth Sci. 18 (2), 251–256. (in Chinese with English abstract).
Liang, J., Liu, Y., Ying, L., Li, P., Xu, Y., and Shen, Z. (2014). Road Impacts on Spatial Patterns of Land Use and Landscape Fragmentation in Three Parallel Rivers Region, Yunnan Province, China. Chin. Geographical Sci. 24, 15–27. doi:10.1007/s11769-014-0652-y
Lin, S., Wu, R., Yang, F., Wang, J., and Wu, W. (2018). Spatial Trade-Offs and Synergies Among Ecosystem Services within a Global Biodiversity Hotspot. J. Ecol. Indicators 84, 371–381. doi:10.1016/j.ecolind.2017.09.007
Liu, J., Wen, Z., and Gang, C. (2020a). Normalized Difference Vegetation index of Different Vegetation Cover Types and its Responses to Climate Change in the Loess Plateau. Acta Ecologica Sinica 40 (2), 678–691. (in Chinese with English abstract). doi:10.5846/stxb201901090082
Liu, Y., Wang, J., Dong, J., Wang, S., and Ye, H. (2020b). Variations of Vegetation Phenology Extracted from Remote Sensing Data over the Tibetan Plateau Hinterland during 2000-2014. J. Meteorol. Res. 34, 786–797. doi:10.1007/s13351-020-9211-x
Liu, Z., Wang, S., and Chen, B. (2021). Spatial and Temporal Variations of Frozen Ground and its Vegetation Response in the Eastern Segment of China-Mongolia-Russia Economic Corridor from 2000 to 2015. Acta Geographica Sinica 76 (5), 1231–1244. (in Chinese with English abstract). doi:10.11821/dlxb202105014
Luo, D., Jin, H., Jin, R., Yang, X., and Lü, L. (2014). Spatiotemporal Variations of Climate Warming in Northern Northeast China as Indicated by Freezing and Thawing Indices. Quat. Int. 349, 187–195. doi:10.1016/j.quaint.2014.06.064
Ma, X., Chen, S., Deng, J., Feng, Q., and Huang, X. (2016). Vegetation Phenology Dynamics and its Response to Climate Change on the Tibetan Plateau. Acta Prataculturae Sinica 25 (1), 13–21. (in Chinese with English abstract). doi:10.11686/cyxb2015089
Morisette, J. T., Richardson, A. D., Knapp, A. K., Fisher, J. I., Graham, E. A., Abatzoglou, J., et al. (2009). Tracking the Rhythm of the Seasons in the Face of Global Change: Phenological Research in the 21st century. Front. Ecol. Environ. 7, 253–260. doi:10.1890/070217
Piao, S., Liu, Q., Chen, A., Janssens, I. A., Fu, Y., Dai, J., et al. (2019). Plant Phenology and Global Climate Change: Current Progresses and Challenges. Glob. Chang Biol. 25, 1922–1940. doi:10.1111/gcb.14619
Piao, S., Cui, M., Chen, A., Wang, X., Ciais, P., Liu, J., et al. (2011). Altitude and Temperature Dependence of Change in the spring Vegetation green-up Date from 1982 to 2006 in the Qinghai-Xizang Plateau. Agric. For. Meteorology 151, 1599–1608. doi:10.1016/j.agrformet.2011.06.016
Qiao, C., Shen, S., Cheng, C., Wu, J., Jia, D., and Song, C. (2021). Vegetation Phenology in the Qilian Mountains and its Response to Temperature from 1982 to 2014. Remote Sensing 13, 286. doi:10.3390/rs13020286
Rauste, Y., Astola, H., Hame, T., Berglund, R., Sirro, L., Veijonen, T., et al. (2007). Automatic Monitoring of Autumn Colours Using MODIS Data. IGARSS: 2007 IEEE Int. Geosci. Remote Sensing Symp. 1–12, 1295–1298. doi:10.1109/IGARSS.2007.4423043
Richardson, A. D., Keenan, T. F., Migliavacca, M., Ryu, Y., Sonnentag, O., and Toomey, M. (2013). Climate Change, Phenology, and Phenological Control of Vegetation Feedbacks to the Climate System. Agric. For. Meteorology 169, 156–173. doi:10.1016/j.agrformet.2012.09.012
Sazonova, T. S., and Romanovsky, V. E. (2003). A Model for Regional-Scale Estimation of Temporal and Spatial Variability of Active Layer Thickness and Mean Annual Ground Temperatures. Permafrost Periglac. Process. 14, 125–139. doi:10.1002/ppp.449
Shen, M., Piao, S., Chen, X., An, S., Fu, Y. H., Wang, S., et al. (2016). Strong Impacts of Daily Minimum Temperature on the green-up Date and Summer Greenness of the Tibetan Plateau. Glob. Change Biol. 22 (9), 3057–3066. doi:10.1111/gcb.13301
Shen, M., Piao, S., Cong, N., Zhang, G., and Jassens, I. A. (2015a). Precipitation Impacts on Vegetation spring Phenology on the Tibetan Plateau. Glob. Change Biol. 21, 3647–3656. doi:10.1111/gcb.12961
Shen, M., Piao, S., Dorji, T., Liu, Q., Cong, N., Chen, X., et al. (2015b). Plant Phenological Responses to Climate Change on the Tibetan Plateau: Research Status and Challenges. Natl. Sci. Rev. 2 (4), 454–467. doi:10.1093/nsr/nwv058
Shen, M., Sun, Z., Wang, S., Zhang, G., Kong, W., Chen, A., et al. (2013). No Evidence of Continuously Advanced green-up Dates in the Tibetan Plateau over the Last Decade. Proc. Natl. Acad. Sci. 110, E2329. doi:10.1073/pnas.1304625110
Shen, M., Tang, Y., Chen, J., Zhu, X., and Zheng, Y. (2011). Influences of Temperature and Precipitation before the Growing Season on spring Phenology in Grasslands of the central and Eastern Qinghai-Tibetan Plateau. Agric. For. Meteorology 151, 1711–1722. doi:10.1080/01431161.2013.87563610.1016/j.agrformet.2011.07.003
Shen, M., Tang, Y., Desai, A. R., Gough, C., and Chen, J. (2014a). Can EVI-Derived Land-Surface Phenology Be Used as a Surrogate for Phenology of Canopy Photosynthesis? Int. J. Remote Sensing 35, 1162–1174. doi:10.1080/01431161.2013.875636
Shen, M., Zhang, G., Cong, N., Wang, S., Kong, W., and Piao, S. (2014b). Increasing Altitudinal Gradient of spring Vegetation Phenology during the Last Decade on the Qinghai-Tibetan Plateau. Agric. For. Meteorology 189-190, 71–80. doi:10.1016/j.agrformet.2014.01.003
Shi, Y., Niu, F., Lin, Z., and Luo, J. (2019). Freezing/thawing index Variations over the Circum-Arctic from 1901 to 2015 and the Permafrost Extent. Sci. Total Environ. 660, 1294–1305. doi:10.1016/j.scitotenv.2019.01.121
Stanimirova, R., Cai, Z. Z., Melaas, E. K., Gray, J. M., Eklundh, L., Jönsson, P., et al. (2019). An Empirical Assessment of the MODIS Land Cover Dynamics and TIMESAT Land Surface Phenology Algorithms. Remote Sensing 11, 2201. doi:10.3390/rs11192201
Tan, J., Li, A., and Lei, G. (2016). Contrast on Anusplin and Cokriging Meteorological Spatial Interpolation in Southeastern Margin of Qinghai-Xizang Plateau. Plateau Meteorology 35 (4), 875–886. (in Chinese with English abstract). doi:10.7522/j.issn.1000-0534.2015.00037
Wang, C., Guo, H., Zhang, L., Liu, S., Qiu, Y., and Sun, Z. (2015). Assessing Phenological Change and Climatic Control of alpine Grasslands in the Tibetan Plateau with MODIS Time Series. Int. J. Biometeorol. 59, 11–23. doi:10.1007/s00484-014-0817-5
Wang, Q., Fan, X., and Wang, M. (2014). Recent Warming Amplification over High Elevation Regions across the globe. Clim. Dyn. 43, 87–101. doi:10.1007/s00382-013-1889-3
Wang, T., Peng, S., Lin, X., and Chang, J. (2013a). Declining Snow Cover May Affect spring Phenological Trend on the Tibetan Plateau. Proc. Natl. Acad. Sci. 110 (31), E2854–E2855. doi:10.1073/pnas.1306157110
Wang, W., Körner, C., Zhang, Z., Wu, R., Geng, Y., Shi, W., et al. (2013b). No Slope Exposure Effect on alpine Treeline Position in the Three Parallel Rivers Region, SW China. Alpine Bot. 123, 87–95. doi:10.1007/s00035-013-0118-3
Weil, G., Lensky, I. M., and Levin, N. (2017). Using Ground Observations of a Digital Camera in the VIS-NIR Range for Quantifying the Phenology of Mediterranean Woody Species. Int. J. Appl. Earth Observations Geoinformation 62, 88–101. doi:10.1016/j.jag.2017.05.016
Wen, L., Guo, M., Yin, S., Huang, S., Li, X., and Yu, F. (2021). Vegetation Phenology in Permafrost Regions of Northeastern China Based on MODIS and Solar-Induced Chlorophyll Fluorescence %J Chinese Geographical Science. Chin. Geographical Sci. 31, 459–473. doi:10.1007/s11769-021-1204-x
Wu, J., Guo, K., Wang, M., and Xu, B. (2011). “Research and Extraction of the Hydrological Characteristics Based on GIS and DEM,” in Proceeding of the 2011 IEEE 2nd International Conference on Computing, Control and Industrial Engineering, Wuhan, China, Aug. 2011 (IEEE), 4.
Xiao, C. (2019). Available From: http://www.dili360.com/cng/article/p5350c3d7a012056.htm (Accessed, , 10).
Xiao, P., and Xiang, Y. (2017). Francis Kingdon-Ward’ S Investigation in Khams-Tibetan and His Achievements and Influence. J. Yunnan Minzu Univ. (Social Science) 34 (1), 147–153. doi:10.13727/j.cnki.53-1191/c.2017.01.019(in Chinese with English abstract)
Yang, Y., Xiao, P., Feng, X., and Li, H. (2017). Accuracy Assessment of Seven Global Land Cover Datasets over China. Isprs J. Photogrammetry Remote Sensing 125, 156–173. doi:10.1016/j.isprsjprs.2017.01.016
Yao, X., Deng, J., Liu, X., Zhou, Z., Yao, J., Dai, F., et al. (2020). Primary Recognition of Active Landslides and Development Rule Analysis for Pan Three-River-Parallel Territory of Tibet Plateau. Adv. Eng. Sci. 52 (5), 16–37. (in Chinese with English abstract). doi:10.15961/j.jsuese.202000529
Yu, H., Luedeling, E., and Xu, J. (2010). Winter and spring Warming Result in Delayed spring Phenology on the Tibetan Plateau. Proc. Natl. Acad. Sci. 107 (51), 22151–22156. doi:10.1073/pnas.1012490107
Zeng, H., Jia, G., and Epstein, H. (2011). Recent Changes in Phenology over the Northern High Latitudes Detected from Multi-Satellite Data. Environ. Res. Lett. 6, 045508. doi:10.1088/1748-9326/6/4/045508
Zhai, J., Yuan, F., and Wu, J. (2015). Research Progress on Vegetation Phenological Changes. Chin. J. Ecol. 34 (11), 3237–3243. (in Chinese with English abstract). doi:10.13292/j.1000-4890.20151023.030
Zhang, G., Zhang, Y., Dong, J., and Xiao, X. (2013). Green-up Dates in the Tibetan Plateau Have Continuously Advanced from 1982 to 2011. Proc. Natl. Acad. Sci. United States America 110, 4309–4314. doi:10.1073/pnas.1210423110
Zhao, J., Wang, Y., Zhang, Z., Zhang, H., Guo, X., Yu, S., et al. (2016). The Variations of Land Surface Phenology in Northeast China and its Responses to Climate Change from 1982 to 2013. Remote Sensing 8, 400. doi:10.3390/rs8050400
Zhao, J., Zhang, H., Zhang, Z., Guo, X., Li, X., and Chen, C. (2015). Spatial and Temporal Changes in Vegetation Phenology at Middle and High Latitudes of the Northern Hemisphere over the Past Three Decades. Remote Sensing 7, 10973–10995. doi:10.3390/rs70810973
Zhao, L., Ping, C.-L., Yang, D., Cheng, G., Ding, Y., and Liu, S. (2004). Changes of Climate and Seasonally Frozen Ground over the Past 30 Years in Qinghai-Xizang (Tibetan) Plateau, China. Glob. Planet. Change 43, 19–31. doi:10.1016/j.gloplacha.2004.02.003
Zhou, L., Tucker, C. J., Kaufmann, R. K., Slayback, D., Shabanov, N. V., and Myneni, R. B. (2001). Variations in Northern Vegetation Activity Inferred from Satellite Data of Vegetation index during 1981 to 1999. J. Geophys. Res. 106 (D17), 20069–20083. doi:10.1029/2000JD000115
Zhu, W., Zhang, X., Zhang, J., and Zhu, L. (2019). A Comprehensive Analysis of Phenological Changes in forest Vegetation of the Funiu Mountains, China. J. Geogr. Sci. 29 (1), 131–145. doi:10.1007/s11442-019-1588-z(in Chinese with English abstract)
Keywords: vegetation phenology, river basin, spatio-temporal changes, climate factors, freezing/thawing index, TIMESAT
Citation: Wang C-Y, Wang J-N, Wang X-F, Luo D-L, Wei Y-Q, Cui X, Wu N and Bagaria P (2022) Phenological Changes in Alpine Grasslands and Their Influencing Factors in Seasonally Frozen Ground Regions Across the Three Parallel Rivers Region, Qinghai-Tibet Plateau. Front. Earth Sci. 9:797928. doi: 10.3389/feart.2021.797928
Received: 19 October 2021; Accepted: 24 December 2021;
Published: 28 February 2022.
Edited by:
Zhenhua Zhang, Northwest Institute of Plateau Biology (CAS), ChinaReviewed by:
Jianshuang Wu, Institute of Environment and Sustainable Development in Agriculture (CAAS), ChinaNan Jiang, Institute of Tibetan Plateau Research (CAS), China
Copyright © 2022 Wang, Wang, Wang, Luo, Wei, Cui, Wu and Bagaria. This is an open-access article distributed under the terms of the Creative Commons Attribution License (CC BY). The use, distribution or reproduction in other forums is permitted, provided the original author(s) and the copyright owner(s) are credited and that the original publication in this journal is cited, in accordance with accepted academic practice. No use, distribution or reproduction is permitted which does not comply with these terms.
*Correspondence: Jin-Niu Wang, wangjn@cib.ac.cn