Yedoma Cryostratigraphy of Recently Excavated Sections of the CRREL Permafrost Tunnel Near Fairbanks, Alaska
 Mikhail Kanevskiy1*
  Yuri Shur1
  Nancy H. Bigelow2
  Kevin L. Bjella3 Thomas A. Douglas3
  Daniel Fortier4
  Benjamin M. Jones1
  M. Torre Jorgenson5
- 1Institute of Northern Engineering, University of Alaska Fairbanks, Fairbanks, AK, United States
- 2Alaska Quaternary Center, University of Alaska Fairbanks, Fairbanks, AK, United States
- 3Cold Regions Research and Engineering Laboratory (CRREL), Fairbanks, AK, United States
- 4Geography Department, University of Montreal, Montreal, Canada
- 5Alaska Ecoscience, Fairbanks, AK, United States
Recent excavation in the new CRREL Permafrost Tunnel in Fox, Alaska provides a unique opportunity to study properties of Yedoma — late Pleistocene ice- and organic-rich syngenetic permafrost. Yedoma has been described at numerous sites across Interior Alaska, mainly within the Yukon-Tanana upland. The most comprehensive data on the structure and properties of Yedoma in this area have been obtained in the CRREL Permafrost Tunnel near Fairbanks — one of the most accessible large-scale exposures of Yedoma permafrost on Earth, which became available to researchers in the mid-1960s. Expansion of the new ∼4-m-high and ∼4-m-wide linear excavations, started in 2011 and ongoing, exposes an additional 300 m of well-preserved Yedoma and provides access to sediments deposited over the past 40,000 years, which will allow us to quantify rates and patterns of formation of syngenetic permafrost, depositional history and biogeochemical characteristics of Yedoma, and its response to a warmer climate. In this paper, we present results of detailed cryostratigraphic studies in the Tunnel and adjacent area. Data from our study include ground-ice content, the stable water isotope composition of the variety of ground-ice bodies, and radiocarbon age dates. Based on cryostratigraphic mapping of the Tunnel and results of drilling above and inside the Tunnel, six main cryostratigraphic units have been distinguished: 1) active layer; 2) modern intermediate layer (ice-rich silt); 3) relatively ice-poor Yedoma silt reworked by thermal erosion and thermokarst during the Holocene; 4) ice-rich late Pleistocene Yedoma silt with large ice wedges; 5) relatively ice-poor fluvial gravel; and 6) ice-poor bedrock. Our studies reveal significant differences in cryostratigraphy of the new and old CRREL Permafrost Tunnel facilities. Original syngenetic permafrost in the new Tunnel has been better preserved and less affected by erosional events during the period of Yedoma formation, although numerous features (e.g., bodies of thermokarst-cave ice, thaw unconformities, buried gullies) indicate the original Yedoma silt in the recently excavated sections was also reworked to some extent by thermokarst and thermal erosion during the late Pleistocene and Holocene.
1 Introduction
Yedoma is the ice- and organic-rich syngenetic permafrost, which accumulated in unglaciated regions during the late Pleistocene in various regions of Eurasia and North America (Schirrmeister et al., 2013). Yedoma deposits contain large ice wedges that can reach up to 10 m in width and more than 40 m in vertical extent (Tomirdiaro 1980; Zhestkova et al., 1982; Sher, 1997; Romanovskii et al., 2004; Kanevskiy et al., 2011; Murton, 2013; Schirrmeister et al., 2013; Schirrmeister et al., 2020). Yedoma remnants are abundant in various parts of Siberia, Canada, and Alaska (Kanevskiy et al., 2011; Schirrmeister et al., 2013; Strauss et al., 2017; Strauss et al., 2021; and citations therein).
Yedoma in Siberia and North America occurs in an area of ∼450,000 km2, including ∼90,000 km2 in Alaska (Strauss et al., 2021), and contains up to 130 gigatons of organic carbon (Strauss et al., 2017). Yedoma is vulnerable to climate change and disturbance because of its high ice content and silty composition. Thermokarst and thermal erosion of these ice-rich sediments create serious hazards for the environment and socioeconomic systems, which in some cases may require a costly relocation of a variety of infrastructure. Growing interest in Yedoma studies during recent decades has been related to the high content of frozen organic matter whose release upon thaw leads to changes in biogeochemical processes and greenhouse gas emission (Grosse et al., 2011; Schuur et al., 2015; Strauss et al., 2017).
Yedoma deposits contain large amounts of ground ice. The volumetric moisture content of Yedoma silt due to pore and segregated ice usually varies from 60% to more than 80%. Lenses of segregated ice in silt form a specific set of cryostructures named “micro-cryostructures” (Kanevskiy et al., 2011). Large syngenetic ice wedges penetrate the entire section of Yedoma, and their volume may exceed 50%. At some locations, the thickness of syngenetic permafrost with large ice wedges can reach 30–40 m. The most impressive section of Yedoma in Alaska was previously studied in the 35-m-high exposure along the Itkillik River (Kanevskiy et al., 2011; Kanevskiy et al., 2016; Shur et al., 2021a).
Formation of Yedoma took place in the extremely cold, dry, grassy environment called “tundra-steppe” or “mammoth steppe” (Kaplina, 1981; Yurtsev, 1981; Guthrie, 1990; Sher, 1997). Such terrain occupied vast areas of Eurasia and North America in the late Pleistocene. Yedoma does not have direct analogs to permafrost formed during the Holocene. The most similar to Yedoma deposits is syngenetic permafrost of modern floodplains of Arctic rivers in Siberia and Alaska that is not more than several meters thick (Popov, 1953; Katasonov, 1954; Zaikanov, 1991; Shur and Jorgenson, 1998), as well as the Holocene eolian silt with large ice wedges in the Canadian Arctic (Fortier and Allard, 2004).
Since the 1800s, numerous hypotheses for Yedoma origin have been developed, and for a long time massive ice in Yedoma was considered to be buried snow, lake, or glacier ice (Shur et al., 2021b). Popov (1953) proposed a hypothesis of alluvial sedimentation accompanied by formation of large syngenetic ice wedges, and most Russian investigators have agreed. Other hypotheses for Yedoma genesis include eolian (Péwé, 1954, 1955, 1975a; Williams, 1962; Hopkins, 1963; Tomirdiaro, 1980; Hopkins, 1982; Carter, 1988), colluvial (Gravis, 1969), and nival (Kunitskiy, 1989; Schirrmeister et al., 2008; Schirrmeister et al., 2010) modes of sedimentation. Zhestkova et al., (1982, 1986) proposed a polygenetic origin of Yedoma that considers Yedoma as a climatic phenomenon and applied the idea of “equifinality,” which suggests that similar results may be achieved by various processes and under different initial conditions. They concluded that the leading factors of Yedoma formation are a cold climate and continuous long-term sedimentation. They also emphasized that Yedoma is a gigantic polypedon and that soil forming processes (from a pedological point of view) played an important role in Yedoma formation Sher (1997) and Sher et al. (2005) supported this explanation of the Yedoma genesis.
Our preliminary maps of Yedoma occurrence in Alaska (Kanevskiy et al., 2011; Kanevskiy et al., 2016; Shur et al., 2021a) show that Yedoma is widespread across both arctic and boreal regions (Supplementary Figure S1). Yedoma is abundant along the lower portion of the Arctic Foothills, in the northern part of the Seward Peninsula, and in numerous areas in Interior Alaska. In Canada, Yedoma sites were identified in south-western Yukon by Fraser and Burn (1997), Kotler and Burn (2000), Froese et al. (2009), and Fortier et al. (2018).
In Interior Alaska, ice-rich silt, which can be identified as Yedoma, has been observed at numerous sites mainly within the Yukon-Tanana uplands (Péwé, 1975a; Péwé, 1975b; Black, 1978; Kreig and Reger, 1982; Brown and Kreig, 1983; Meyer et al., 2008; Kanevskiy et al., 2012; Jorgenson et al., 2013; Nossov et al., 2013; Schirrmeister et al., 2016). Yedoma studies were also performed at the Palisades riverbank exposure in the central Yukon River valley (Matheus et al., 2003; Reyes et al., 2010a; Reyes et al., 2010b; Reyes et al., 2011; Jensen et al., 2013). Most of these studies consider Yedoma deposits to be of eolian and reworked eolian origin.
The most comprehensive data on the structure and properties of Yedoma in Interior Alaska have been obtained from the CRREL Permafrost Tunnel near Fairbanks, which became available to researchers in the mid-1960s. Many papers have been published on the geology and geomorphology of the Tunnel (e.g., Sellmann, 1967; Sellmann, 1972; Hamilton et al., 1988; Shur et al., 2004; Douglas et al., 2011) and engineering properties of sediments (Chester and Frank, 1969; Thompson and Sayles, 1972; Pettibone, 1973; Johansen, et al., 1980; Johansen and Ryer, 1982; Weerdenburg and Morgenstern, 1983; Arcone and Delaney, 1984; Delaney and Arcone, 1984; Huang et al., 1986; Delaney, 1987; Bray, 2008; Douglas and Mellon, 2019). The methods of Tunnel construction have also been described (Chester and Frank, 1969; Dick, 1970; Swinzow, 1970; Linell and Lobacz, 1978; Cysewski et al., 2012; Bjella and Sturm, 2012).
Excavation of the new sections of the CRREL Permafrost Tunnel, which started in 2011 (Bjella and Sturm, 2012), has significantly increased the Tunnel footprint, and now the total length of the Tunnel network is approximately 600 m. The newly exposed surfaces provide unique opportunities for scientists interested in paleoecology and studies of the structure, biogeochemical characteristics, and depositional history of the ice-rich syngenetic permafrost. Studies in the new Tunnel allow us to make more detailed descriptions and cryostratigraphic maps because the freshly cut walls and ceiling have even surfaces that are not covered with thick layers of dry sublimated soil, unlike the old Tunnel.
In this study, we describe cryostratigraphy of the recently excavated sections of the CRREL Permafrost Tunnel based on mapping of the walls and ceiling of a 110-m-long section of the main Tunnel and a 50-m-long crosscut connecting the new and old Tunnels. We also present the data obtained from several boreholes drilled around the Tunnel from the soil surface and inside the Tunnel from its floor. The major goals of this paper are to: 1) describe cryostratigraphy of the new Tunnel and present the data on radiocarbon dating of sediments and stable isotope composition of various types of ground ice, 2) compare subsurface conditions in the old and new sections of the Permafrost Tunnel, and 3) provide a basic cryostratigraphic map of the new Tunnel facilities, which can be used for the future research.
2 Excavation of the Cold Regions Research and Engineering Laboratory Tunnel
The CRREL Permafrost Tunnel was initially constructed in the early 1960s in Fox, Alaska (Figure 1) by the U.S. Army Cold Regions Research and Engineering Laboratory (CRREL) to test mining, tunneling, and construction techniques in permafrost (Sellmann, 1967; Cysewski et al., 2010; Cysewski et al., 2012; Bjella and Sturm, 2012). The Tunnel portal is located on the eastern margin of the Goldstream Creek valley at the base of a steep 10-m-high escarpment created by placer gold mining activities in the early to mid-1900s. The surface of the valley that lies immediately above the long axis of the Tunnel rises gently from the top of the escarpment in which the entrance is located toward the east side of the Goldstream Creek valley. The active layer of the terrain that overlies the Tunnel varies from 0.5 to 1 m thick; this range is typical of the Fairbanks area, but it has been expanding downward over the past decade (Douglas et al., 2021).
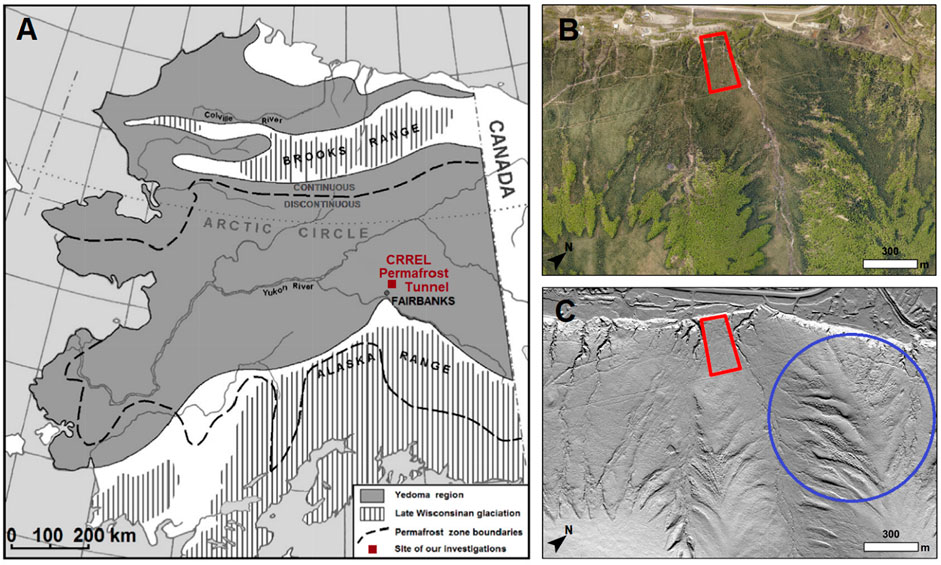
FIGURE 1. (A) Location of the CRREL Permafrost Tunnel. Boundaries of Yedoma region in Alaska (defined as area of potential Yedoma occurrence) are shown after Kanevskiy et al. (2011); limits of late Wisconsinan glaciation are shown after Péwé (1975a) and Hamilton (1994); and boundaries of permafrost zones are shown after Jorgenson et al. (2008). (B) Aerial photo of the Tunnel area, 2020 (the Tunnel is located within the red rectangular). (C) LiDAR image of the Tunnel area, 2017. Note the occurrence of numerous thermo-erosional gullies and baydzherakhs (conical thermokarst mounds) that indicate areas of thawing Yedoma permafrost (blue circle).
The old Tunnel, which was constructed in the 1960s, comprises two portions (Figure 2). The adit (a nearly horizontal Tunnel from the base of the slope into the hillside, T1 in Figure 2) was excavated by the U.S. Army Corps of Engineers using continuous mining methods in the winters of 1963–64, 1964–65, and 1965–66 (Sellmann, 1967). The winze (an inclined Tunnel, W in Figure 2) was driven by the U.S. Bureau of Mines (USBM) from 1968 to 1969 using drill and blast, thermal relaxation, and hydraulic relaxation methods (Chester and Frank, 1969). The adit was excavated mainly in frozen silt and extended approximately 110 m in length. The winze begins approximately 30 m into the adit and drops at an incline of 14 percent for 45 m, passing into the frozen gravel unit and ultimately into weathered bedrock, where the Gravel Room (G in Figure 2) was excavated (Pettibone, 1973). The Tunnel is chilled by natural ventilation in winter and by artificial refrigeration in summer, supporting permafrost stability.
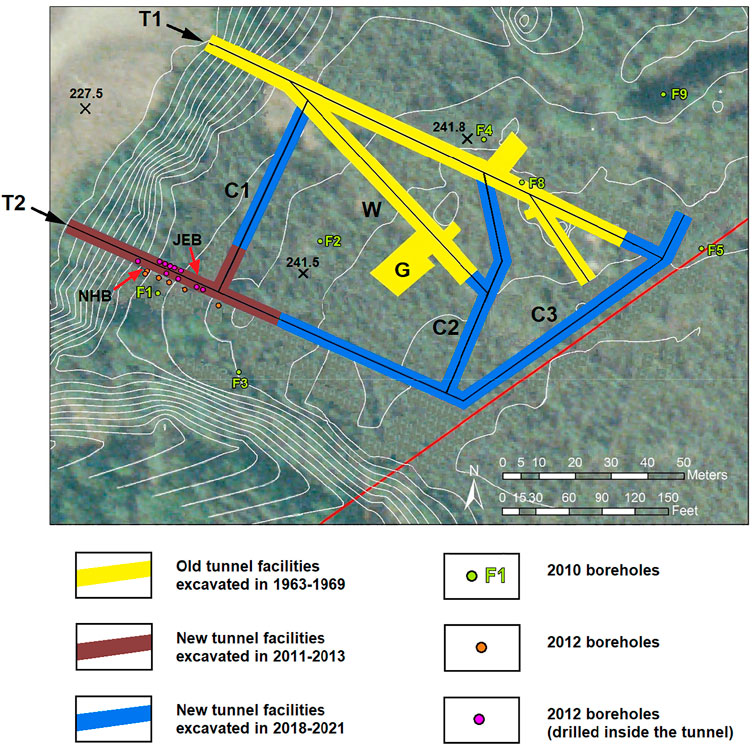
FIGURE 2. Plan view of the CRREL Permafrost Tunnel facilities, including old (northern adit, T1) and new (southern adit, T2) Tunnels, inclined winze (W), gravel room (G), crosscuts that connect old and new Tunnels (C1, C2, and C3), and boreholes. Locations of NHB and JEB sections are marked with red arrows. Contour lines have 1 m intervals. Modified from Bjella and Sturm (2012).
Recent excavation of the Permafrost Tunnel was performed by CRREL in five phases: 2011 (Bjella and Sturm, 2012; Cysewski et al., 2012), 2013, 2018, 2020, and 2021. For this expansion, an excavator equipped with a 62-cm-wide drum-style rotary cutter (Eco-Cutter EC-25) was used. The cutter was outfitted with the two types of picks: chisel type for frozen silt and massive ice, and conical type for frozen gravel. For removal of excavated material, a John Deere 333D rubber-tired skid loader was used (Bjella and Sturm, 2012).
The current length of the main adit of the new Tunnel (T2 in Figure 2) is approximately 110 m from the portal, and its average width and height are approximately 4.25 m. Crosscuts (C1, C2, and C3 in Figure 2) connect old (T1) and new (T2) Tunnels. In this paper, we present the results of cryostratigraphic studies performed in T2 and C1.
3 Previous Cryostratigraphic Studies in the Cold Regions Research and Engineering Laboratory Permafrost Tunnel
Geology, paleoecology, and cryostratigraphy of the sediments exposed in the old CRREL permafrost Tunnel have been described in numerous papers (Sellmann, 1967; Sellmann, 1972; Watanabe, 1969; Hamilton et al., 1988; Long and Péwé 1996; Shur et al., 2004; Bray et al., 2006; Wooller et al., 2007; Wooller et al., 2011; Fortier et al., 2008; Kanevskiy et al., 2008a; Kanevskiy et al., 2008b; Douglas et al., 2011; Lachniet et al., 2012). Sediments exposed in the Tunnel consist mainly of ice- and organic-rich frozen silt (loess) of eolian origin that was partly reworked and retransported by hillslope and fluvial processes (Péwé, 1975a; Péwé, 1975b; Hamilton et al., 1988). The silt, which is 14–18 m thick, formed between 30,000 and 43,000 years BP (Hamilton et al., 1988). The silt overlies the Fox Gravel of early to middle Pleistocene age, which was derived from the surrounding hills of the Yukon–Tanana Uplands; the thickness of the Fox Gravel near the village of Fox was up to 15 m (Péwé, 1975a). Hamilton et al. (1988) estimated the thickness of gravel in the Tunnel to be 3–4 m and suggested that the gravel deposit beneath the silt could form shortly before 43,000 years BP. The Fox Gravel overlies Pre-Cambrian Fairbanks Schist bedrock (Newberry et al., 1996). Near the Tunnel portal, fanlike deposits of poorly sorted debris unconformably overlie the silt; these deposits accumulated between 12,500 and 11,000 years BP during deep erosion of the Goldstream Creek valley slopes (Hamilton et al., 1988).
Sellmann (1967, 1972) was the first to provide information on geology and permafrost of the Tunnel. He described segregation ice, foliated wedge ice, and large clear masses of ice (identified as buried “aufeis”). Hamilton et al. (1988) identified four major types of ground ice: pore ice, segregated ice, foliated wedge ice, and buried surface ice (frozen thaw ponds formed in ice-wedge troughs). They described two independent systems of ice wedges with a thaw unconformity between them. Further studies interpreted the clear ice bodies in the CRREL Tunnel to be thermokarst-cave ice (Shur et al., 2004; Bray et al., 2006; Kanevskiy et al., 2008a; Fortier et al., 2008; Douglas et al., 2011). Cryostratigraphic mapping of the main adit of the old Tunnel was performed by Bray et al. (2006) (Supplementary Figures S2, S3). Cryostratigraphic mapping of the 38-m-long winze section was performed by Kanevskiy et al. (2008b) at various scales (Supplementary Figures S4–S7).
Recent cryostratigraphic studies in the old CRREL Tunnel (Shur et al., 2004; Bray et al., 2006; Fortier et al., 2008; Kanevskiy et al., 2008a) described typical ground-ice features related to syngenetic permafrost formation. The dominant cryostructure that was observed in the CRREL Tunnel is micro-lenticular (Shur et al., 2004), which is typical of syngenetic permafrost. The term “micro-lenticular” refers to the presence of very small, sub-horizontal (sometimes wavy), relatively short ice lenses. Usually, the thickness of uniformly distributed ice lenses (and the spacing between them) does not exceed 0.5 mm. In the Tunnel, gravimetric moisture contents of the sediments with micro-lenticular cryostructure varied from 80 to 240% (Bray et al., 2006; Fortier et al., 2008; Kanevskiy et al., 2008a; Kanevskiy et al., 2008b). The great variability in gravimetric moisture contents of silt is associated with existence of several varieties of micro-lenticular cryostructure (e.g., latent micro-lenticular, micro-braided, micro-ataxitic); we suggested a term “micro-cryostructures” as a general term that covers all these varieties (Kanevskiy et al., 2011).
Ice-rich silt contains numerous peat layers and inclusions of poorly decomposed organic matter, including abundant rootlets, which is very common in syngenetic permafrost. For example, seven thin organic horizons were observed in the upper part of the winze at a depth of approximately 12–14 m below the ground surface (Supplementary Figure S5). The radiocarbon dates for bulk samples obtained from these organic layers varied from 31,000 to 35,000 14C yr BP (Kanevskiy et al., 2008a). Below each peat horizon, at a depth of approximately 0.4–0.6 m, were distinct icy layers (called “belts” in the Russian literature). These layers were interpreted to be temporary positions of the former permafrost table (base of the active layer) during the time of peat accumulation. The approximate positions of the active layer during these periods are indicated by arrows in Supplementary Figure S5. Numerous small cracks partially filled with ice (ice veins) extend downward from the peat horizons to depths of up to 0.5 m. These cracks form polygons up to 0.5 m across.
Numerous bodies of massive ice are exposed in the walls and ceiling of the CRREL Tunnel. Wedge ice is the main type of massive ice in the Tunnel; it can be recognized by distinctive vertical foliation. The size of the ice wedges is difficult to quantify: although the wedges appear to range in width from 1 to 7 m, their true width varies mainly between 0.5 and 3.0 m. The apexes of ice wedges terminate at the stratigraphic contact between the overlying silt and the underlying alluvial gravel.
Ice-rich syngenetic permafrost with large ice wedges is highly susceptible to thermal erosion that promotes the formation of gullies and subterranean channels (Fortier et al., 2007). When such channels are finally filled with sediment, water that is ponded behind the blockage begins to freeze. This process results in the formation of lenticular-shaped bodies of thermokarst-cave (“pool”) ice. The term “thermokarst-cave ice” was suggested by Shumskii (1959) for massive ice formed by the freezing of water trapped in underground cavities that were cut through permafrost by running water. In Canada, this type of ice was described as “pool ice” by (Mackay, 1997; Mackay, 2000). The largest apparent horizontal extent of thermokarst-cave ice that can be viewed in the Tunnel was approximately 7 m (Shur et al., 2004; Bray et al., 2006).
Numerous sites of former gullies and underground channels were observed in the silty sediments at various depths. In the winze, a gully filled with sediments was observed at interval 29–35 m (Supplementary Figures S4, S5). Beneath the gully was a truncated ice wedge affected by thermal erosion. The sediment filling the gully was mostly ice-poor stratified silt with lenses of sand and numerous inclusions of reworked organic matter (Kanevskiy et al., 2008a).
Underground channels were cut by running water and later filled with thermokarst-cave ice and sediments whose structure and properties differ from the original syngenetic permafrost (Shur et al., 2004; Bray et al., 2006; Fortier et al., 2008; Kanevskiy et al., 2008a; Kanevskiy et al., 2008b; Douglas et al., 2011). Examination of the main adit of the old Tunnel revealed that, of 20 ice wedges identified, 19 had been subject to thermal erosion, either surficial or underground. Approximately 60% of the channels cutting through the ice wedges and the enclosing syngenetic permafrost were partially or entirely filled by thermokarst-cave ice (Fortier et al., 2008).
Lenses of thermokarst-cave ice were usually underlain by layers of silt with a reticulate-chaotic cryostructure (Shur et al., 2004; Fortier et al., 2008), which can be easily recognized by relatively thick multi-directional ice veins (Supplementary Figure S8). These ice veins were formed by inward freezing of saturated sediments trapped in underground channels incised in the permafrost by thermal erosion. Formation of the reticulate-chaotic cryostructure was reproduced in laboratory experiments (Fortier et al., 2008).
4 Methods
4.1 Cryostratigraphy and Ground-Ice Content
We characterized permafrost in the new CRREL Tunnel by mapping massive-ice bodies and other permafrost features exposed in the Tunnel and studying frozen sediment cores from 24 boreholes drilled around and above the Tunnel and from its floor (Figures 2, 3). For mapping purposes, the datum for locations started from the toe of the escarpment at the new Tunnel entrance (Figure 3), with left and right directions given as if walking into the Tunnel.
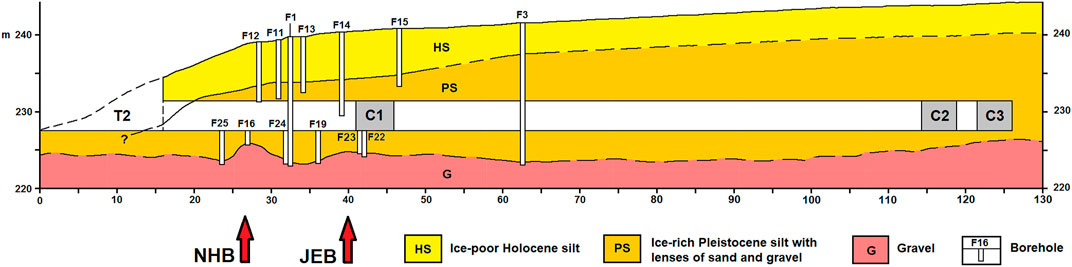
FIGURE 3. General geological profile along the main adit of the new CRREL Permafrost Tunnel (T2), positions of the boreholes drilled from the surface and from the Tunnel floor in 2010 and 2012, and locations of crosscuts C1, C2, and C3 that connect the new Tunnel (T2) with the old Tunnel (T1). Locations of NHB and JEB sections are marked with red arrows. For location of boreholes and Tunnel facilities on the map, see Figure 2.
In April 2010, prior to excavation of the new Tunnel, eight boreholes were drilled in the adjacent area by GeoTek Alaska. The drill rig was a Geoprobe model 8040DT with DT45 tooling for direct push sampling. In March 2012, CRREL drilled six boreholes from the surface and 10 boreholes inside the Tunnel to the gravel. The drill rig was a Geoprobe 7822DT with DT45 (3-inch diameter) and MC5 (2.25-inch diameter) tooling for direct push sampling. Frozen cores were described and sub-sampled in 2010–2013 in the Institute of Northern Engineering (INE) UAF Frozen Ground Laboratory in Fairbanks, Alaska; remaining frozen cores are stored inside the CRREL Permafrost Tunnel. Cryostratigraphic studies in the new Tunnel facilities were performed in 2011–2014 and 2020 (before excavation of Crosscut #3).
Cryostratigraphic descriptions were based on classifications of massive ground ice and cryostructures (patterns formed by ice inclusions in the frozen soil) adapted from Russian and North American literature (French and Shur, 2010; Kanevskiy et al., 2011; Kanevskiy et al., 2013 and references therein). To estimate ground-ice content, frozen samples were weighed, oven-dried (90 C, 72 h) and reweighed. Gravimetric moisture content of frozen sediments was calculated as the ratio of the mass of the ice in a sample to the mass of the dried sample. To estimate volumes of massive ground ice, we transformed cryostratigraphic maps into binary (black and white) images showing distribution of massive-ice bodies; the areas occupied by wedge ice and thermokarst-cave ice on the walls and ceiling of the Tunnel were measured using ImageJ software (Ferreira and Rasband, 2012).
4.2 Water Stable Isotope Composition
The stable oxygen and hydrogen isotopic composition of ground ice is useful for assessing the conditions during the formation of different types of ground ice and helps to differentiate ground-ice bodies of various origins (Lacelle and Vasil’chuk, 2013; Vasil’chuk and Murton, 2016; Porter and Opel, 2020). For oxygen and hydrogen isotopic composition (δ18O and δ2H), samples of different types of ground ice were collected from the new CRREL Permafrost Tunnel and adjacent boreholes and analyzed at the Alaska Stable Isotope Facility at the University of Alaska Fairbanks (UAF) and the CRREL Alaska geochemistry laboratory using standard mass spectrometry (UAF) and cavity ringdown (CRREL) methods.
Samples for stable isotope analyses at the Alaska Stable Isotope Facility at the University of Alaska Fairbanks were processed using continuous-flow isotope ratio mass spectrometry (CFIRMS). δ2H and δ18O values are measured using pyrolysis-EA-IRMS. This method utilizes a ThermoScientific high temperature elemental analyzer (TC/EA) and Conflo IV interface with a DeltaVPlus Mass Spectrometer. The pyrolysis reactor consists of a reaction tube packed with glassy carbon/graphite. Water samples are injected into the TC/EA with a CTC Analytics A200SE liquid autosampler. The sample is pyrolyzed into H2 and CO gases then separated chromatigraphically. These gases are then transferred to the IRMS, where the isotopes are measured. Typical Quality Control scheme involves analyzing laboratory working standards every twenty-five replicate samples. Stable isotope ratios are reported in δ notation as parts per thousand (%) deviation from the international standards, V-SMOW (Standard Mean Ocean Water). Typically, instrument precision is < 3.0% for hydrogen and <0.5% for oxygen.
Samples for stable isotope analyses at the CRREL Alaska geochemistry laboratory were filtered through acid-washed 0.45-µm polypropylene filters. Stable isotopes of oxygen and hydrogen were measured using Wavelength-Scanned Cavity Ringdown Spectroscopy on a Picarro L2120i (Sunnyvale, California) on Fort Wainwright, Alaska. Samples were injected into the analyzer for seven separate analyses. Results from the first four injections were not used to calculate the stable isotope values to reduce potential internal system memory. The mean value from the final three sample injections was used to calculate the mean and standard deviation value for each sample. Values are reported in standard per mil notation. Repeated analyses of five internal laboratory standards representing a range of values spanning the samples analyzed and analyses of SMOW, GISP, and SLAP standards (International Atomic Energy Agency) were used to calibrate the analytical results. Based on thousands of these standards analyses and of sample duplicate analyses we estimate the precision is ± 0.2% for δ18O and ± 0.5% for δ2H. Stable hydrogen and oxygen isotopic compositions from both analytical methods are expressed as delta values in per mil (%) relative to Vienna Standard Mean Ocean Water (VSMOW).
4.3 Radiocarbon Dating
Radiocarbon samples were collected from three localities in the new CRREL Permafrost Tunnel. The NHB section was located on the right wall at ∼27 m from the base of the slope at the Tunnel entrance, while JEB section was located on the left wall at ∼40 m (Figures 2, 3). Lastly, the thermokarst-cave ice site was located on the right wall at 39–42 m. Radiocarbon samples were also collected from the cores of three boreholes (F3, F12, and F16); F3 and F12 was drilled from the surface and F16 was drilled from the Tunnel floor; both F12 and F16 are located very close to the NHB section.
Radiocarbon samples for AMS analysis were washed in distilled reverse osmosis water, photographed, and oven-dried prior to shipment to the radiocarbon lab (Beta analytic [Beta−*], University of Georgia [UGAMS−*] or Woods Hole [OS−*]). Only terrestrial plant remains, such as wood or herbaceous items (generally graminoid stems, leaves, root crowns, or roots) were dated. The resulting dates were calibrated with Calib ver 8.0.1, which uses the IntCal20 calibration dataset (Reimer et al., 2020).
5 Results
5.1 Structure and Properties of the Upper Permafrost in the Tunnel Area Based on the Drilling Data
In 2010, prior to excavation of the new Tunnel sections, eight boreholes penetrating the Yedoma were drilled in the adjacent area. In 2012, six boreholes were drilled from the surface, and 10 boreholes were drilled inside the Tunnel to the gravel horizon. Borehole locations are shown in Figures 2, 3. Two 2012 boreholes–F12 and F16 (Figure 4)–were especially important for our study because F12 was drilled in a close proximity to the new Tunnel and F16 was drilled approximately at the same location from the Tunnel floor; numerous samples for radiocarbon dating were collected from these cores to complement the dates obtained from the samples collected inside the Tunnel. Cryostratigraphy and ice contents of frozen sediments of 2010 boreholes F1, F2, F3, and F4 are shown in Supplementary Figures S9–S12.
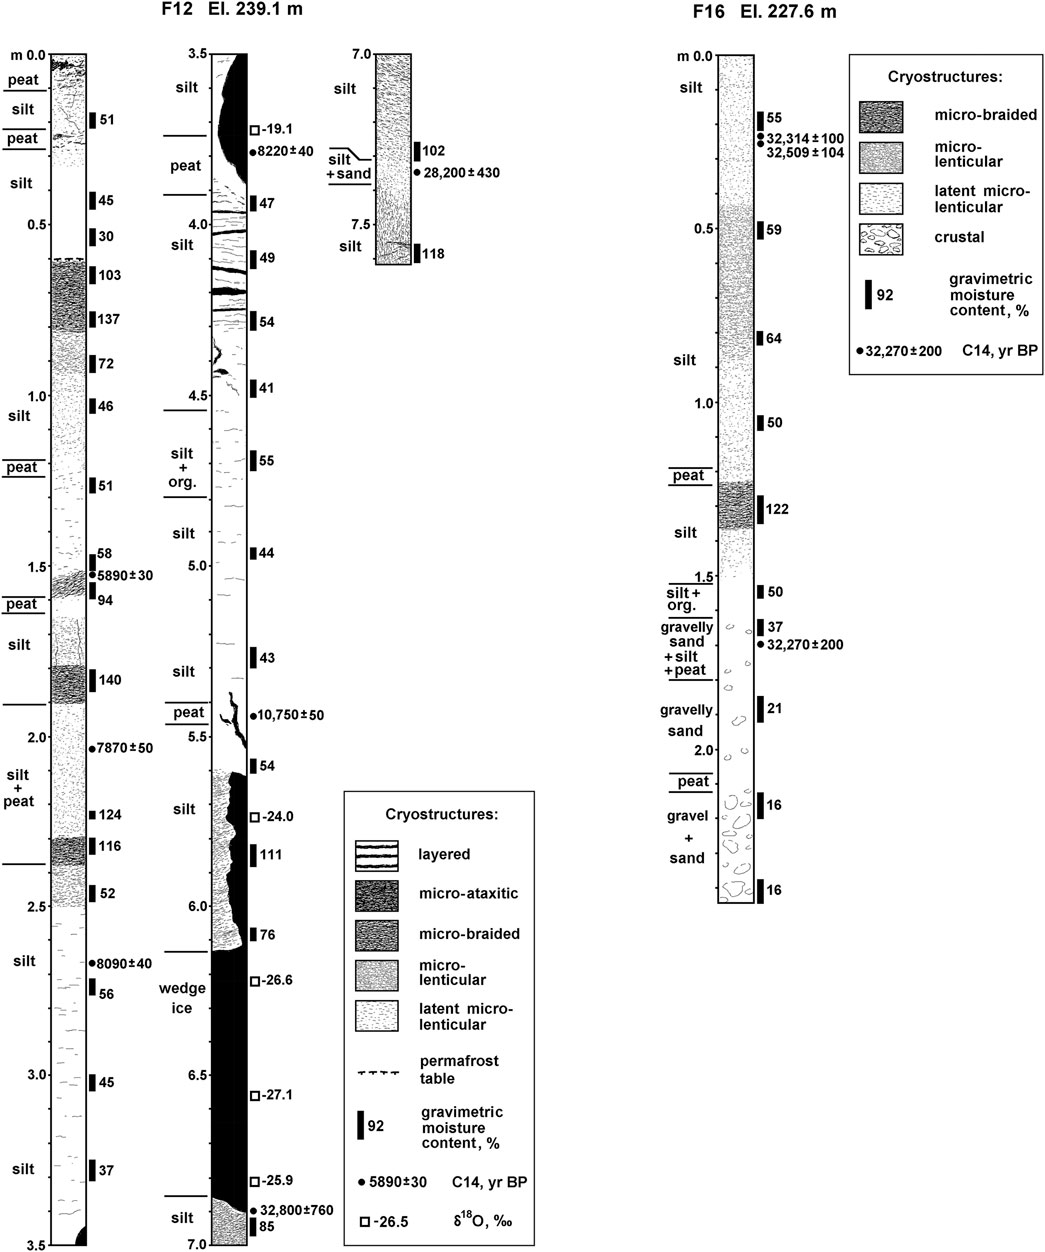
FIGURE 4. Cryostratigraphy (ice is black) and ice contents of frozen sediments, boreholes F12 (Left) and F16 (Right).
Study of cryostructures of frozen cores showed the thickness of the frozen active layer varied from 0.55 to 0.8 m (0.65 m average). The active layer comprised 10–15 cm of peat underlain by organic-rich silt. Below the active layer we could detect the modern ice-rich intermediate layer [quasi-syngenetically frozen layer typical of the upper permafrost, see Shur (1988), French and Shur (2010), Shur et al. (2011)] composed of silt with mainly micro-braided and micro-ataxitic cryostructures; the thickness of this layer varied from 0.15 to 0.6 m (0.4 m average). The intermediate layer was underlain by a 3- to 6-m-thick layer of relatively ice-poor silt with peat layers and organic matter inclusions. This layer contained thin ice wedges and random 0.1- to 1.0-m-thick layers with micro-cryostructures (presumably syngenetically frozen soils or buried intermediate layers). According to radiocarbon dates obtained from Borehole F12, this layer formed during the Holocene (Figure 4); it comprised mainly Yedoma deposits reworked by thermal erosion and slope processes. The Holocene silt was underlain by ice-rich late Pleistocene Yedoma silt, 10–14 m thick, with prevailing micro-cryostructures and large ice wedges. In Borehole F2, vertical extent of the ice wedge exceeded 9 m (Supplementary Figure S10), which confirms the syngenetic nature of the ice wedges at the study site. Ice-bonded fluvial gravel and gravelly sand with predominantly crustal cryostructure were encountered at depths from 13 to 18 m below the surface.
Ground-ice content of frozen sediments due to pore and segregated ice (gravimetric and volumetric moisture contents) was determined from the samples obtained from six boreholes: F1, F2, F3, F4, F12, and F16 (Figures 4, Supplementary Figures S9–S12). Gravimetric moisture contents for different cryostratigraphic units are shown in Supplementary Table S1 and Figure 5.
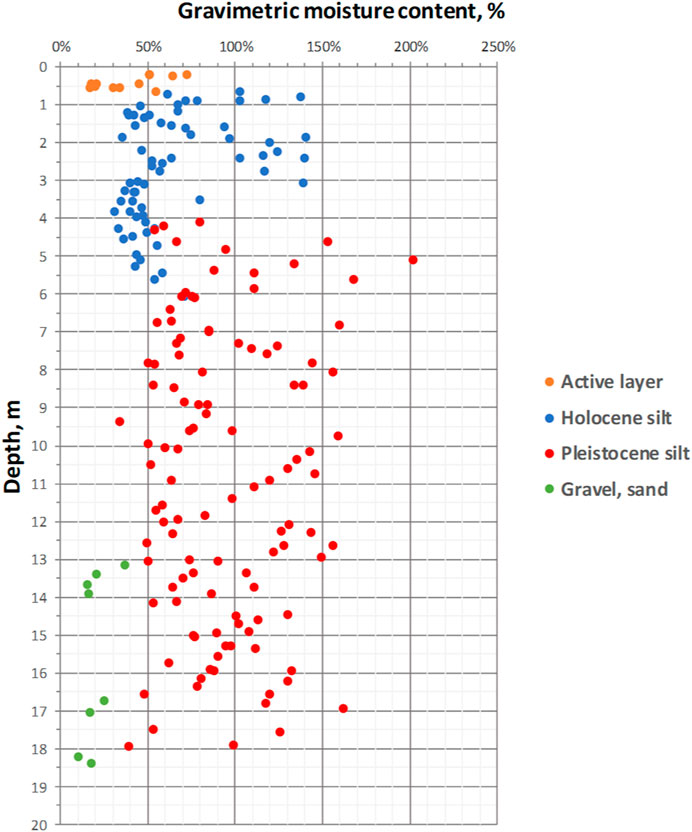
FIGURE 5. Gravimetric moisture contents of sediments with depth, based on the drilling data (Boreholes F1, F2, F3, F4, F12, and F16). Average values: Active layer–39.7 ± 19.3% (n = 12); Holocene silt (including the intermediate layer)–65.4 ± 31.0% (n = 64); Pleistocene silt–94.0 ± 34.4% (n = 111); Gravel and gravelly sand–19.9 ± 8.0% (n = 8).
The highest ice content was detected for the intermediate layer and Yedoma silt. An average gravimetric moisture content of the modern intermediate layer was 91.8 ± 27.6%. The underlying Holocene silt was relatively ice-poor (in comparison with Yedoma deposits) and contained relatively small amount of visible ground ice. Gravimetric moisture contents for most of the samples obtained from this unit ranged between 30 and 50% (Figure 5), but the average value (61.6 ± 29.7%) is significantly higher, which can be explained by the occurrence of several ice-rich layers (probably buried intermediate layers) within generally ice-poor deposits (Figures 4, Supplementary Figures S9–S12). In general, ice contents of the Holocene silt decreased with depth (Figure 5). Gravimetric moisture contents in Yedoma varied from <50 to >150% with the average value of 94.0 ± 34.4%, which was similar to that of the modern intermediate layer. Unlike the Holocene silt, there was no significant change in ground-ice distribution with depth (Figure 5); such a wide range in ice content is typical of syngenetic permafrost. Gravel and gravelly sand were relatively ice poor with an average gravimetric moisture content of 19.9 ± 8.0%.
5.2 Cryostratigraphy of the Main Adit of the New Tunnel (T2)
Cryostratigraphic mapping of the main adit of the new Tunnel (T2) resulted in compiling a general map of the two walls and ceiling (Figure 6). Additionally, some parts of the adit were mapped at a larger scale (e.g., Figure 7). Photographs of massive ground-ice bodies and other permafrost features exposed in the walls of the adit are shown in Supplementary Figures S13–S30; more photographs are available through the Arctic Data Center dataset (Shur and Kanevskiy, 2015).
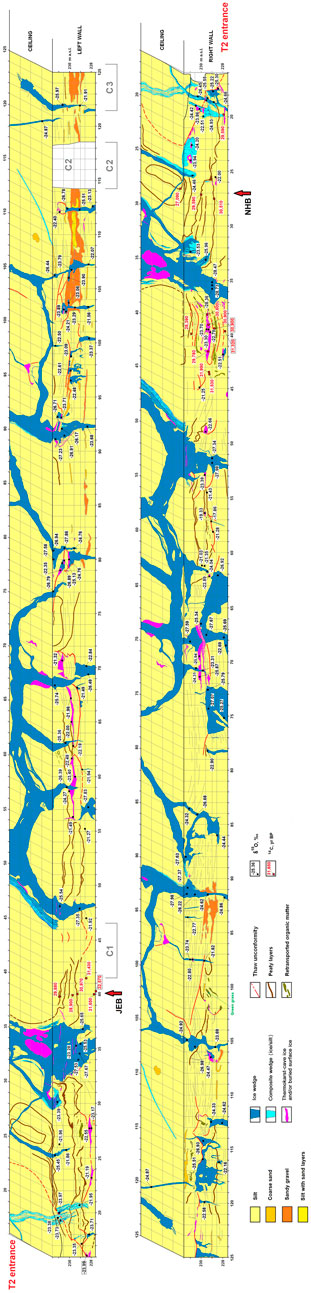
FIGURE 6. General cryostratigraphic maps of the walls and the ceiling of the main adit of the new Tunnel (T2). Locations of NHB and JEB sections are marked with red arrows.
FIGURE 7. Cryostratigraphic map of the right wall of the main adit of the new Tunnel (T2), distance 31–43 m.
The Tunnel presents features typical of ice-rich syngenetic permafrost (Yedoma): large foliated syngenetic ice wedges (Figure 8A), prevalence of micro-cryostructures (Figure 9A), distinctive ice belts (Figure 9B), and occurrence of large amounts of almost undecomposed organic matter, including small rootlets, through the entire thickness of Yedoma silt. Occurrence of numerous bodies of thermokarst-cave ice (Figures 8C,D), thaw unconformities, buried gullies, and other erosional features suggests that the original Yedoma silt at many places was reworked by thermokarst and thermal erosion during Yedoma formation.
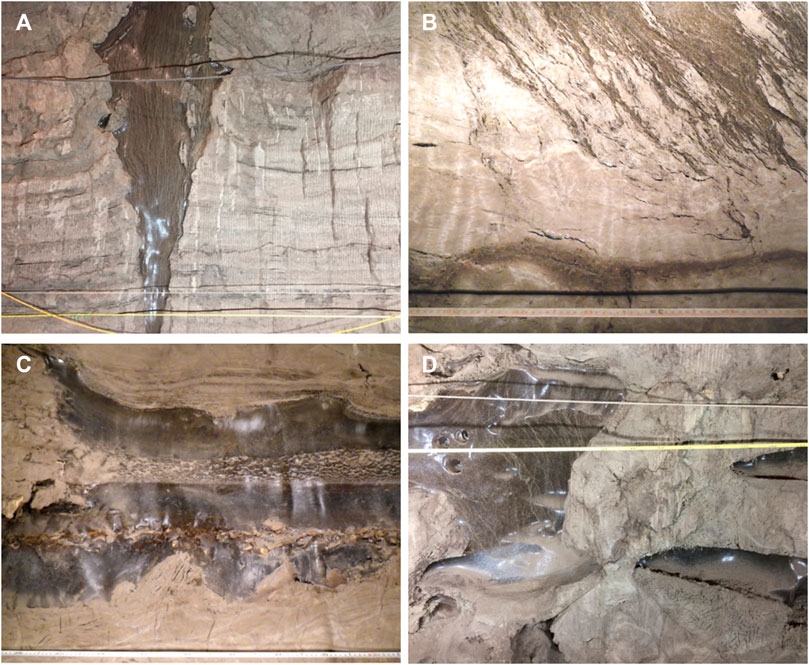
FIGURE 8. Massive-ice bodies exposed in the new Permafrost Tunnel. For locations, see Figures 6, 7, 10. (A) Syngenetic ice wedge. Left wall of Crosscut #1 of the new Tunnel (C1), distance 9.4–13.9 m, elevation 228.8–231.6 m. (B) Ice wedge surrounded by individual ice veins forming composite (ice/silt) wedge; note a dark-brown layer of buried peat. Right wall of the main adit of the new Tunnel (T2), distance 32.8–33.4 m, elevation 229.0–229.5 m. (C) Thermokarst-cave ice. Horizontal stratification and suspended wood fragments indicate several stages of water accumulation and thermokarst-cave ice aggradation in the underground cavity. Right wall of the main adit of the new Tunnel (T2), distance 38.9–39.9 m, elevation 229.0–229.9 m. (D) Underground erosional channels filled with thermokarst-cave ice underlain by silt with reticulate-chaotic cryostructure. The channels started developing along ice wedges but eventually expanded and affected enclosing sediments. Left wall of Crosscut #1 of the new Tunnel (C1), distance 27.0–28.6 m, elevation 228.2–229.4 m.
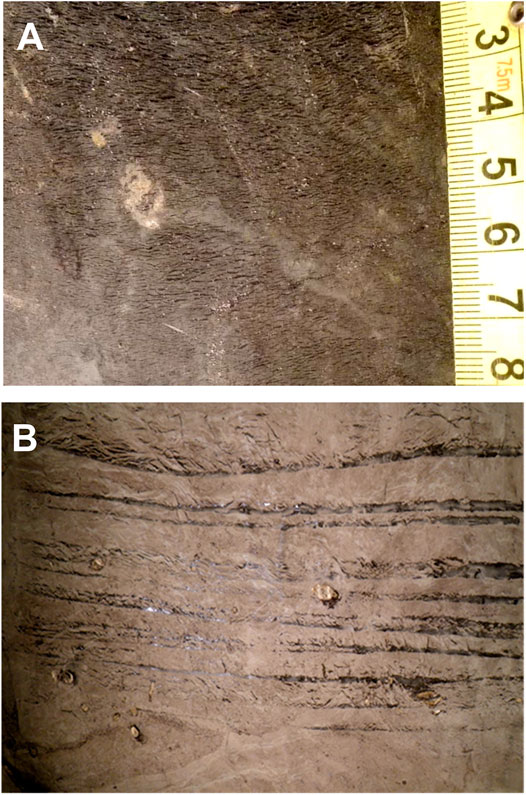
FIGURE 9. Typical cryostructures of syngenetically frozen silt (ice is dark colored). (A) micro-braided cryostructure; left wall of the main adit of the new Tunnel (T2), distance 24.1 m, elevation 229.5 m. (B) ice belts (thick layers of segregated ice); right wall of the main adit of the new Tunnel (T2), distance 38.2–39.1 m, elevation 230.2–230.8 m. For locations, see Figures 6, 7.
A major inclined thaw unconformity was observed in the Tunnel at distances from 16 to 22 m. We presume this unconformity, which truncated original soil layers and massive-ice bodies (Figure 6), was created by a thermokarst or thermo-erosional event that occurred during the Pleistocene/Holocene transition, based on radiocarbon dates from the adjacent Borehole F12 (Figures 3, 4).
Ice wedges exposed in the Tunnel had distinctive vertical foliation due to particles of mineral soils and organic matter and contained numerous air bubbles. Some ice wedges were surrounded by individual ice veins forming composite (ice/silt) wedges (Figure 8B). Large ice wedges were mainly syngenetic, based on their shape and dimensions; smaller buried epigenetic ice wedges and veins were also observed in various parts of the Tunnel. Small ice and composite wedges of presumably Holocene age were visible on the walls and ceiling near the entrance at distances from 16 to 22 m; apexes of the Holocene ice wedges were also visible on the ceiling and upper walls at distances from 25 to 50 m (Figure 6). More likely, the upper parts of the larger Pleistocene ice wedges exposed in the Tunnel also contained ice veins of the Holocene age that could penetrate in deeper layers. Such veins were sediment rich and often had a different color (Supplementary Figure S14). The true width of the Pleistocene ice wedges usually did not exceed 1.5–2 m, and distance between them varied from 5 to 12 m (measured across polygons visible on the ceiling of the Tunnel, see Figure 6).
Thermokarst-cave ice bodies were encountered at various elevations in many places along the Tunnel. Some of these bodies could form in underground channels cut by running water, mainly along ice wedges but also partly in the enclosing sediments, others may have a different origin. For example, one such body was observed on the right wall of the Tunnel at distances from 37 to 43 m (Figures 6, 7). It consisted of several horizontal layers of clean and sediment-rich ice, including a layer with wood fragments suspended in the ice, and was underlain by a silt layer with reticulate-chaotic cryostructure and numerous randomly oriented inclusions of reworked peat (Supplementary Figures S16–S18). Such a complex ice body could form at the bottom of a shallow thermo-erosional gully whose bank was undercut by water and subsequently collapsed. This process could result in the formation of an irregularly shaped cavity, which probably stayed partially open for several years and experienced several cycles of flooding and freezing, until it became completely filled with ice and buried by fresh deposits.
Active thermal erosion at the time of Yedoma formation resulted in the fast burial of gullies. Such events can be illustrated by the presence of overturned sod with green grass visible at 100.5 m along the right wall of the Tunnel (Figure 6 and Supplementary Figure S28). Numerous disrupted peat layers, visible mainly from 16 to 77 m along the Tunnel walls (Figure 6), formed during periods of temporary surface stabilization that existed between periods of fast silt accumulation or erosion events. Some of the most distinctive peat layers contained roots and twigs, which belonged to shrubs buried in the growing position (e.g., at 31–33 m along the right wall of the Tunnel, see Figure 7, and at 23–25 m along the left wall, see Supplementary Figure S13).
Layers of gravel and gravelly sand were observed on the left (80–125 m) and right (90–110 m) walls of the main adit of the Tunnel. These layers were penetrated by 0.2- to 0.5-m-wide ice wedges; some of them (e.g., at 102–108 m along the left wall of the Tunnel, see Figure 6) had well-developed horizontal parts parallel to the gravel layers (Supplementary Figures S25, S26). Wedge-ice content was significantly lower from approximately 100 m; this is probably related to occurrence of layers of gravelly layers.
We estimated areas occupied by wedge ice and thermokarst-cave ice on the walls and ceiling of the main adit of the new Tunnel (T2) at distances from 24 to 100 m (Table 1), the areas with the Holocene ice wedges (16–24 m) and with low wedge-ice content (100–125 m) were excluded. Average values for wedge ice and thermokarst-cave ice were 17.4 and 1.8%, respectively.
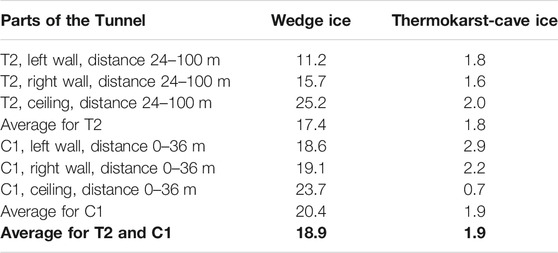
TABLE 1. Areas occupied by massive ground ice of the new CRREL Permafrost Tunnel, % (relative to the total areas of the walls and ceiling of the Tunnel), measured based on cryostratigraphic maps (Figures 6, 10) using ImageJ software.
5.3 Cryostratigraphy of Crosscut #1
Cryostratigraphic mapping of Crosscut #1 (Figure 10), which connects the old and new Tunnels, revealed sediment and ground-ice patterns very similar to those of the main adit of the new Tunnel. Photographs of massive ground-ice bodies and other permafrost features exposed in the walls of the crosscut are shown in Supplementary Figures S31–S44. Sediment in Crosscut #1 was mainly ice- and organic-rich silt that contained in-situ peat layers and numerous inclusions of organic matter reworked by erosion. Micro-cryostructures and distinctive ice belts were typical of undisturbed Yedoma exposed in the crosscut (Supplementary Figures S33, S36, S37).
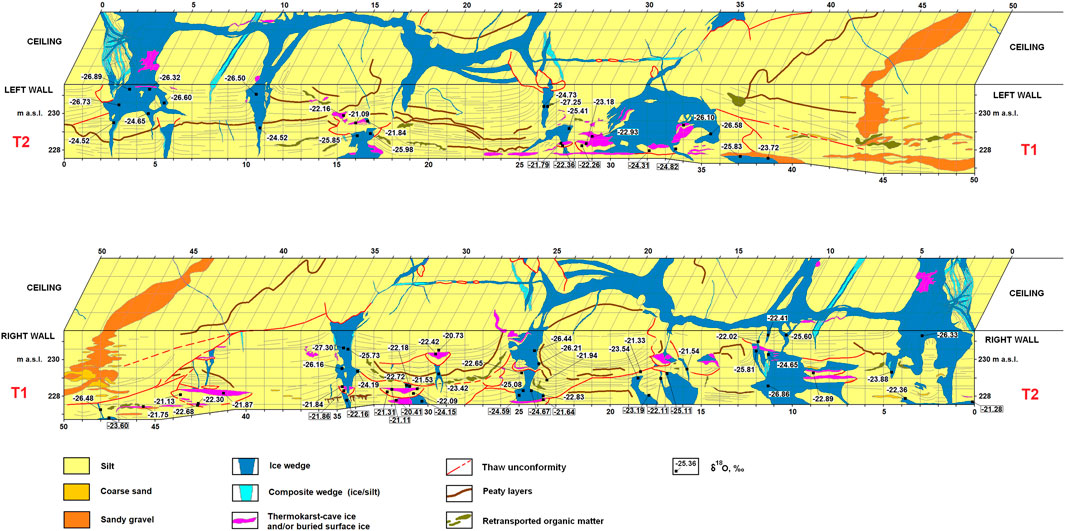
FIGURE 10. General cryostratigraphic maps of the walls and the ceiling of Crosscut C1.
Pleistocene ice wedges were 0.2–1.5 m wide, and distance between them varied from 3 to 10 m (Figure 10). Some of the syngenetic ice wedges were truncated by thermokarst and/or thermal erosion, while others extended from the ceiling to the floor (Supplementary Figure S31). Composite wedges up to 0.5 m wide were also observed at some places. Multiple erosional features, including thermokarst-cave ice bodies, which formed mainly in the underground channels, were observed in various parts of Crosscut #1 (Supplementary Figures S34, S38, S40, S41, S42, S44).
A distinctive thaw unconformity, which separated the ice-rich Late Pleistocene Yedoma unit from the ice-poor Holocene deposits (silt with layers and lenses of gravel and gravelly sand) was observed from ∼35 to 50 m, in the part of the crosscut adjacent to the old Tunnel (Supplementary Figure S43). The main feature of this part of the crosscut is a large ice-wedge pseudomorph filled with poorly sorted gravelly soil, which was clearly visible on the walls and ceiling (Supplementary Figure S39).
We estimated areas occupied by wedge ice and thermokarst-cave ice on the walls and ceiling of Crosscut #1 at distances from 0 to 36 m (Table 1), the area of thaw unconformity adjacent to the old Tunnel (36–50 m), which did not contain ice wedges, was excluded. Average values for wedge ice and thermokarst-cave ice were 20.4 and 1.9%, respectively.
5.4 Water Stable Isotope Composition
A total of 267 samples were collected and analyzed for the stable isotope composition of ground ice, 17 of them from boreholes F2, F4, and F12 (Supplementary Table S2), 147 from the main adit of the new Tunnel (T2) (Supplementary Tables S3, S4), 78 from Crosscut #1 of the new Tunnel (C1) (Supplementary Tables S5, S6), and 25 from Crosscut #2 of the new Tunnel (C2) (Supplementary Tables S7, S8). Most of the samples were obtained from ice wedges (n = 184) and bodies of thermokarst-cave ice and underlying silt with reticulate-chaotic cryostructure (n = 68); several samples were obtained from layers of segregated ice (ice belts) (n = 12) and thin ice veins (n = 2), and for one sample the origin of ice was not identified.
Average δ18O, δ2H, and deuterium excess values of various types of ground ice in new CRREL Permafrost Tunnel and adjacent boreholes are presented in Table 2, and δ18O–δ2H diagram for different types of ground ice is presented in Figure 11. Since stable isotopes of hydrogen and oxygen in meteoric water have a consistent relationship (δ2H = 8*δ18O) the difference between expected δ2H to δ18O relationships in a given sample is calculated by deuterium excess (d); d = δ2H–8*δ18O (Dansgaard, 1964). The global meteoric water line (GMWL) has a d-excess value of 10% so departures from this value yield insights into potential enrichment or depletion in 18O over 16O (Craig, 1961). Rain and snow tend to fall on the GMWL, so d-excess values close to 10% usually identify precipitation that has not undergone significant fractionation. Negative d-excess values are considered evaporatively enriched surface waters and thus the water source (for the ice formation) experienced evaporation at some point. Greater δ18O values and increasingly negative d-excess values in a given sample type indicate a period of warming.
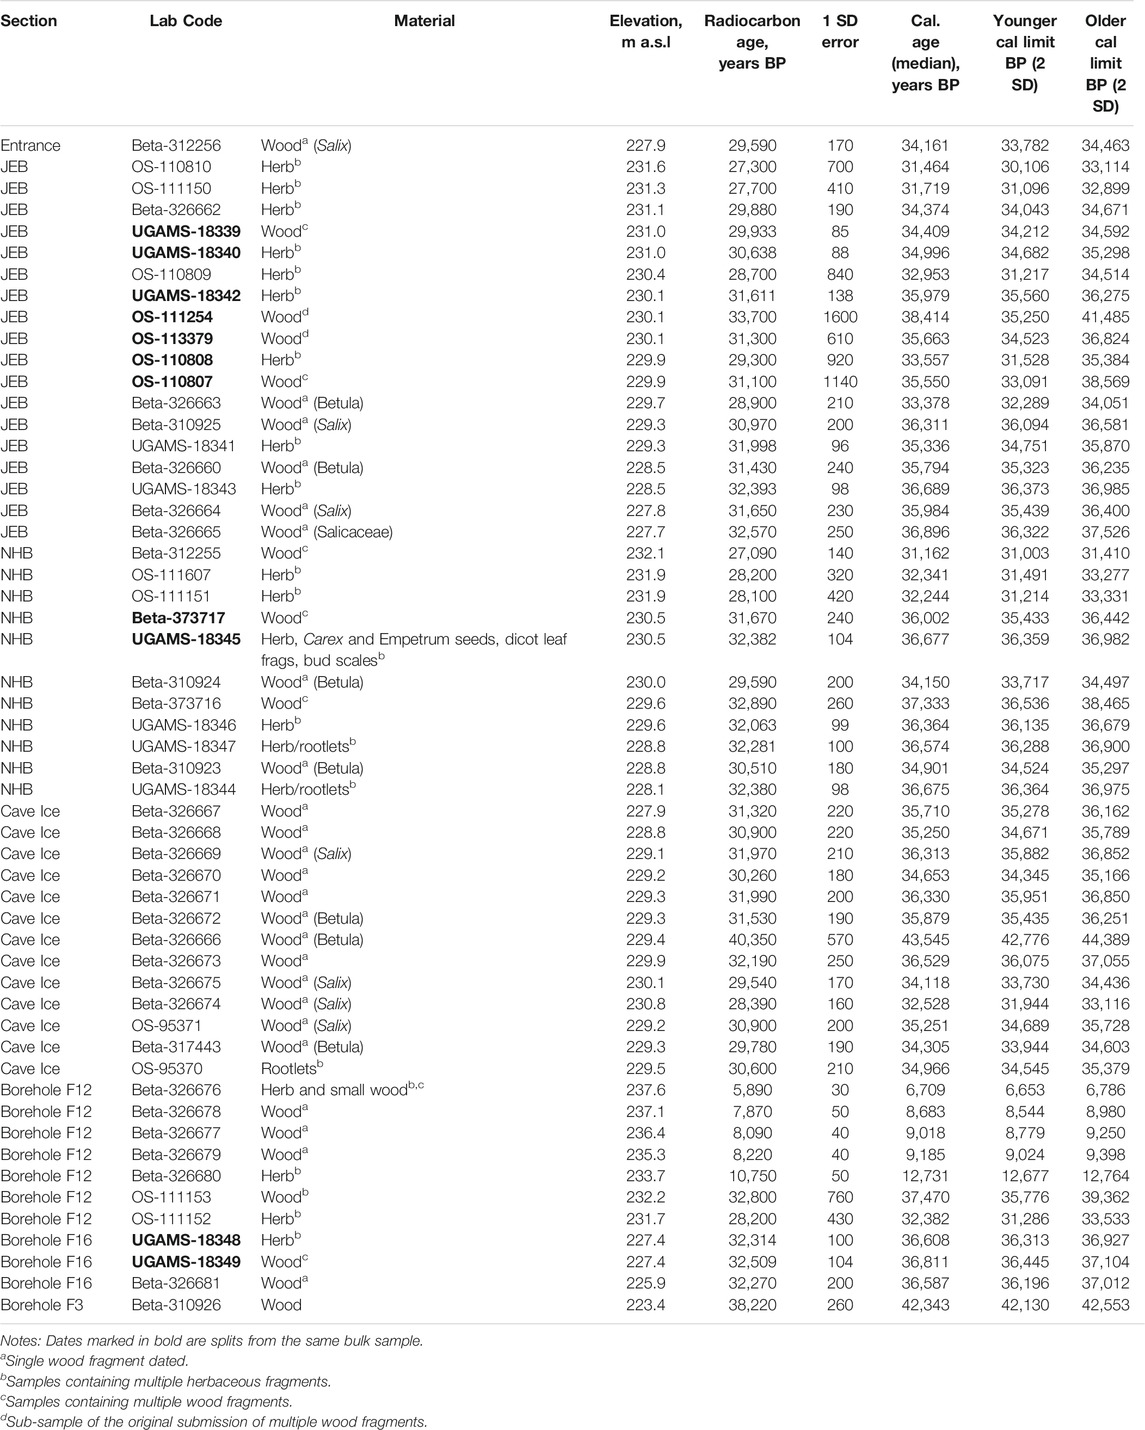
TABLE 2. Radiocarbon dates, new CRREL Permafrost Tunnel and adjacent boreholes.
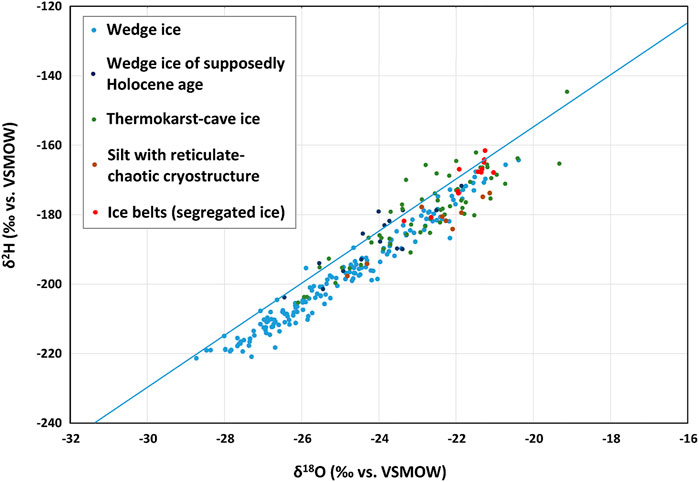
FIGURE 11. δ18O–δ2H diagram for different types of ground ice in the CRREL Permafrost Tunnel. Blue line represents the Global Meteoric Water Line (GMWL).
The isotope composition of ice wedges ranged between −28.7% and −20.4% for δ18O (average value −24.9 ± 1.9%, n = 184). We detected 16 samples, mainly from the main adit (T2), which could be identified as the Holocene ice wedges (Table 2; for raw data see Supplementary Tables S2, S3, and S4; for locations see Figure 6), and the average δ18O value for them (−24.0 ± 1.3%, n = 16) was slightly higher than the average value for all other ice wedges (−25.0 ± 1.9%, n = 168). Greater δ18O values for Holocene ice wedges signify winter temperatures warmer than the other ice wedges, and the high d-excess values signify that frost cracks during the ice-wedge formation were filled mainly with snowmelt water.
The isotope composition of thermokarst-cave ice and underlying silt with reticulate-chaotic cryostructure ranged between −26.1% and −19.1% for δ18O (average value -22.7 ± 1.5%, n = 68). Comparison of values obtained from the thermokarst-cave ice bodies and from segregated ice that formed in underlying silt with reticulate-chaotic cryostructure showed a very small difference (Table 2), which suggests that the source of water was the same. Relatively high δ18O values and the negative d-excess values, which were found for many samples obtained from these types of ground ice, indicate evaporative processes that occurred in the surface or shallow subsurface waterbodies from which the ice formed. More likely, these types of ice formed in the summer from a mixture of snowmelt water, rainwater, and water from melting ice wedges that accumulated in thermo-erosional gullies and underground cavities.
The isotope composition of layers of segregated ice (ice belts) ranged between −23.4 and −21.0% for δ18O (average value −21.7 ± 0.7%, n = 12). These relatively high values (in comparison with the ice wedges) can be explained by a different source of water: while for ice wedges it is mostly snowmelt water, ice belts form from the ground water of the active layer, which is mainly a mixture of snowmelt water and rainwater.
Distribution of δ18O values for various types of ground ice with depth and, correspondingly, age of sediments (Figure 12) does not show any significant trends, probably because only several samples were obtained from the Holocene silt unit.
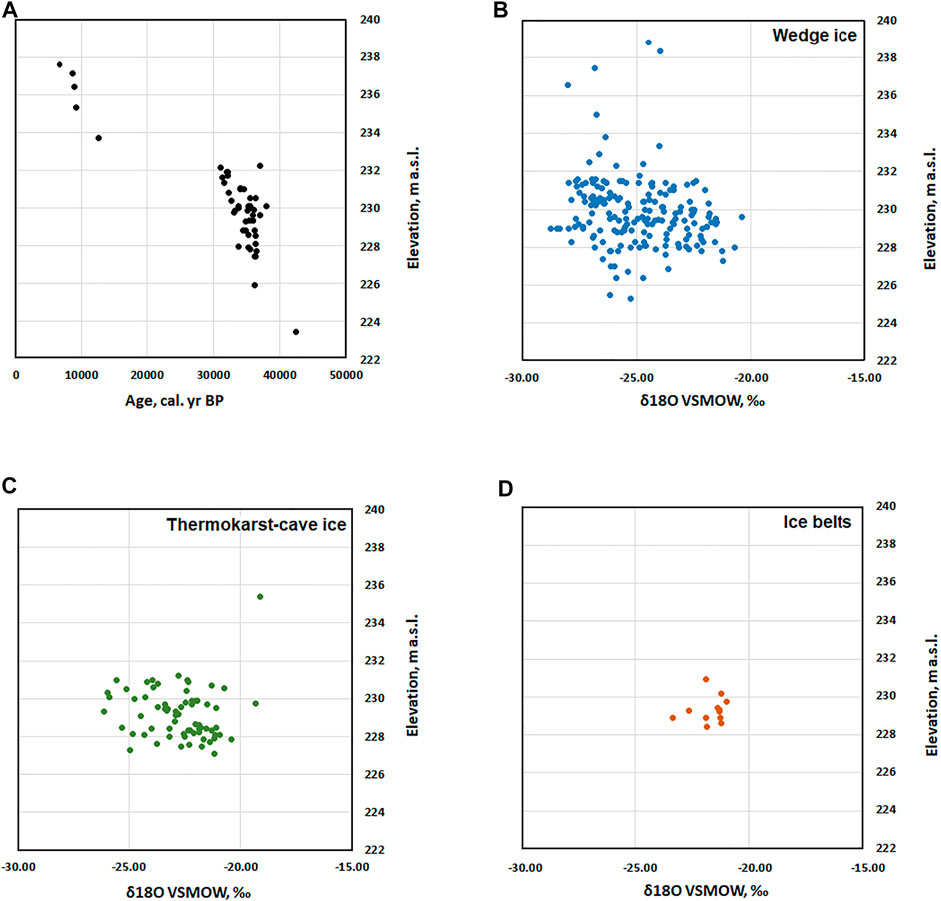
FIGURE 12. Age of sediments (A) and stable oxygen isotopic composition (δ18O) of various types of ground ice (B,C,D) obtained from the samples collected in the new CRREL Permafrost Tunnel and surrounding area at various elevations. (A) Radiocarbon dates (cal. years BP); (B) stable oxygen isotopic composition of wedge ice (average value −24.9 ± 1.9%, n = 184); (C) stable oxygen isotopic composition of thermokarst-cave ice and underlying silt with reticulate-chaotic cryostructure (average value −22.7 ± 1.5%, n = 68); (D) stable oxygen isotopic composition of layers of segregated ice (ice belts) (average value -21.7 ± 0.7%, n = 12).
5.5 Radiocarbon Dating
A total 54 14C dates provide age control in the new CRREL Permafrost Tunnel and boreholes F3 and F12 (drilled from the surface) and F16 (drilled from the floor of the Tunnel) (Table 3). According to these dates, the NHB and JEB sections date between about 31,000 and 38,500 years BP (all ages are in calibrated years). A number of dates were measured from wood suspended in the ice (presumably thermokarst-cave ice). Those dates range between about 32,500 and 35,000 years, although one sample yielded an age of nearly 43,500 years.
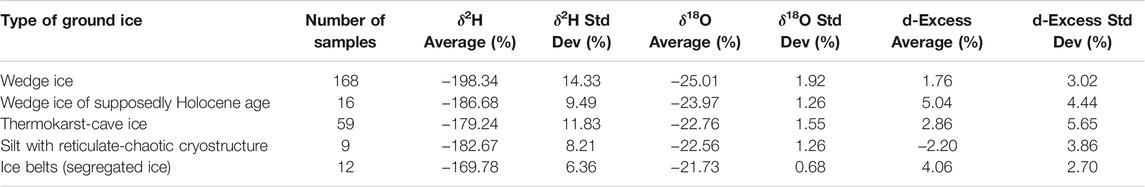
TABLE 3. Stable-isotope composition (average δ18O, δ2H, and Deuterium Excess values) of various types of ground ice, new CRREL Permafrost Tunnel and adjacent boreholes. For raw data, see Supplementary Tables S2 to S8.
Dates obtained from borehole F16, which was drilled from the floor of the Tunnel near the NHB section, showed the range between 36,300 and 36,800 years ago. The oldest date (42,300 years) was obtained from borehole F3 at 18.2 m below the surface near the boundary between silt and gravel. Radiocarbon samples obtained from borehole F12, which was drilled from the surface near the NHB section, showed the wide range of dates–from 6,700 to 37,500 years, with a significant hiatus between 37,500 years BP at 7 m and 12,600 years BP at 5.5 m below the surface; the samples collected from the upper 4 m all showed the Holocene age (6,700 to 9,200 years) (Table 3).
To assess whether there were systematic differences between dates on wood versus herbaceous plant debris, we submitted both woody and non-woody material from the same bulk sample (samples marked in bold in Table 2). The results indicated no systematic bias associated with woody versus non-woody material. In some cases, the wood was older, while in other cases the herbaceous material was older. The age difference between these materials ranged between nearly 2000 and 300 years.
A number of the radiocarbon dates also have very large standard errors (>800 years). In at least one case, this was a problem at the radiocarbon facility. We were able to re-date one of the samples (OS-111254), yielding both a younger age and a smaller standard error (OS-113379), which was more similar to the non-woody material from the same bulk sample (Table 3).
6 Discussion
6.1 Cryostratigraphy and Ground-Ice Content
6.1.1 Cryostratigraphic Units
Based on our ground-ice studies of the new CRREL Tunnel facilities and the cores, and the data from the old Tunnel and adjacent areas (Sellmann, 1967; Sellmann, 1972; Péwé, 1975a; Péwé et al., 1976; Hamilton et al., 1988; Shur et al., 2004; Bray et al., 2006; Fortier et al., 2008; Kanevskiy et al., 2008a; Kanevskiy et al., 2008b), we distinguish six main cryostratigraphic units (described from the top):
(1) Active layer, 0.55–0.8-m thick; peat underlain by organic-rich silt; average gravimetric moisture content 39.7% (this study);
(2) Modern intermediate layer of the upper permafrost; ice-rich silt, up to 0.6 m thick; average gravimetric moisture content 91.8% (this study);
(3) Holocene silt—Ready Bullion Formation (Péwé, 1975a; Péwé et al., 1976), Yedoma deposits reworked by thermokarst and thermal erosion during the Holocene, 3–6 m thick, organic-rich silt, relatively ice poor, with thin ice wedges and several buried ice-rich intermediate layers; average gravimetric moisture content 61.6% (this study);
(4) Late Pleistocene Yedoma silt—Goldstream Formation (Péwé, 1975a; Péwé et al., 1976), 10–14 m thick, ice- and organic rich, with large ice wedges; with lenses and layers of gravel and gravelly sand in the lower part of this unit; average gravimetric moisture content of silt 94.0% (this study);
(5) Pleistocene alluvial gravel and gravelly sand–Fox Gravel (Péwé, 1975a; Péwé et al., 1976), 3–4 m thick, generally ice poor; average gravimetric moisture content 19.9% (this study);
(6) Bedrock—weathered Pre-Cambrian muscovite-quartz Fairbanks Schist (Newberry et al., 1996), generally ice poor, exposed near the floor of the Gravel Room; average gravimetric moisture content 11.7% (Hamilton et al., 1988).
According to Péwé, both the Ready Bullion Formation and Goldstream Formation originated from the upland Fairbanks Loess of Illinoian through Holocene age reworked and retransported from upper slopes to lower slopes and valley bottoms. The Ready Bullion Formation, which is 1–10 m thick, unconformably overlies the Goldstream Formation (Péwé, 1975a; Péwé et al., 1976). Péwé did not find any evidence of ice-wedge occurrence in the Ready Bullion Formation, he only mentioned ice lenses <1 cm thick (Péwé, 1975a). However, small ice wedges were observed in the Holocene deposits of vertical ventilation shaft of the CRREL permafrost Tunnel (Sellmann, 1967; Hamilton et al., 1988). We also observed presumably Holocene ice wedges in Borehole F12 and near the entrance of the new CRREL Tunnel. Occurrence of small buried ice wedges and relatively thin ice-rich layers with micro-cryostructures in generally ice-poor silt indicates that the Holocene silt froze partly epigenetically and partly syngenetically and quasi-syngenetically, with possible formation of the intermediate layers during the periods of surface stabilization and subsequent growth of vegetation.
Large areas in the discontinuous permafrost zone of Alaska have been affected by deep thawing and thermal erosion during the Holocene, as indicated by a layer of ice-poor reworked sediments on top of many Yedoma sections (Péwé, 1975a; Péwé, 1975b; Kanevskiy et al., 2012; Kanevskiy et al., 2014). Péwé (1975b) mentioned that a significant lowering of the permafrost table had occurred during the Pleistocene/Holocene transition, and we also conclude that the ice-poor Holocene silt could form as a result of in situ thawing and refreezing of the ice-rich Yedoma silt in some areas of the Yukon-Tanana Upland (Kanevskiy et al., 2012) and the Koyukuk Flats (Kanevskiy et al., 2014). However, numerous Holocene dates obtained from the Ready Bullion Formation (Péwé, 1975a; Hamilton et al., 1988; and this study) suggest that in the CRREL Tunnel and adjacent area these deposits were largely retransported during the period of high erosional activity that was caused by a significant increase in precipitation and strongly affected the poorly vegetated Yedoma surface.
Occurrence of the ice-poor sediments in the upper permafrost protects ice-rich Yedoma deposits from thermokarst development. Thickness of this layer may be a key to understanding the susceptibility of Yedoma to degradation. Péwé (1954) reported that thermokarst mounds and pits started developing since the numerous agricultural fields were cleared for cultivation around Fairbanks in the areas with large masses of ground ice (i.e., ice wedges). While some fields were strongly affected by thermokarst, others could stay relatively stable for many years, until deep thawing reached undisturbed Yedoma that had been protected from above by ice-poor deposits. Occurrence of the ice-poor layer on top of Yedoma may explain the resilience of Yedoma to climatic impacts and local disturbances even in the areas of warm discontinuous permafrost.
6.1.2 Ground-Ice Content of Yedoma
Numerous studies in Siberia and North America showed that Yedoma contains large amounts of ground ice, including wedge ice and segregated ice. Based on our measurements of wedge ice areas in the new CRREL Tunnel facilities (Table 1), we estimated the volumetric content of wedge ice to be 15–20%. Probably this value is greater at higher elevations because ice wedges exposed near the ceiling are significantly wider than those exposed near the floor of the new Tunnel facilities (Figures 6, 10). This observation corresponds to our measurements of wedge-ice areas that are higher at the ceiling (24–25%) than on the walls (11–19%) of T2 and C1 (Table 1).
In general, wedge-ice in the Tunnel area is significantly less than that in other Alaskan sites underlain by Yedoma. For example, wedge-ice content has been estimated to be 61% at the Itkillik River exposure, northern Alaska (Kanevskiy et al., 2011; Kanevskiy et al., 2016), up to 61% in the Devil Mountains area, Seward Peninsula (Shur et al., 2012), and up to 47% in the Livengood area (9-Mile Hill site) in Interior Alaska (Kanevskiy et al., 2012), although sections of Yedoma with high content of segregated ice and low wedge-ice content also have been described in this area (Kanevskiy et al., 2012).
Average area occupied by thermokarst-cave ice on the walls and ceiling of the main adit (T2) and Crosscut #1 (C1) of the new Tunnel was 1.9% (Table 1). Previously we did a similar estimation at the 600-m-long and 7- to 10-m-high coastal exposure near the village of Kaktovik at Barter Island (Alaskan Beaufort Sea coast), which showed that the thermokarst-cave ice occupied practically the same area—approximately 2.0% of the face of the bluff (Kanevskiy et al., 2013).
Based on the results of drilling in the Tunnel area, gravimetric ice contents of Yedoma silt varied from <50 to >150% with an average value of 94.0%. These numbers are similar to the values measured in the old Tunnel by Hamilton et al. (1988), who reported that gravimetric moisture content of the Pleistocene silt varied from 39 to 139%.
The ice content of the Pleistocene silt strongly depends on cryostructures. For sediments with micro-cryostructures (original Yedoma), gravimetric moisture content in the main adit of the old Tunnel varied from 80 to 180%, averaging 130% (Bray et al., 2006). A similar range (100–240%) was found in the winze (Supplementary Figure S6A) (Kanevskiy et al., 2008a). For reworked sediments (modified Yedoma), which filled gullies and underground channels, gravimetric moisture content in the main adit of the old Tunnel varied from 50 to 95%, averaging 69% (Bray et al., 2006). For the same sediments in the winze, gravimetric moisture content was 70–100% (Kanevskiy et al., 2008a). Such values are very high for ice-poor sediments that do not contain any significant amount of excess ice. This unusually high moisture content may be explained by occurrence of reworked organic material in these sediments (Supplementary Figure S6B). For the cross-stratified sand filling underground channels, the average gravimetric moisture content was 44.6%, whereas it was 107.7% in the surrounding undisturbed Yedoma with micro-lenticular cryostructure (Fortier et al., 2008). For sediments with reticulate-chaotic cryostructure, gravimetric moisture content in the main adit of the old Tunnel varied from 60 to 115%, averaging 85% (Bray et al., 2006).
We found similar values of gravimetric moisture content in Yedoma silt in the 9-Mile Hill study area located ∼90 km NW of the CRREL Tunnel. Sediments between ice wedges were characterized by a wide range (from ∼40% to >200%) and high values (85.5% average) of gravimetric moisture content that did not change significantly with depth; such distribution is typical of syngenetic permafrost. Thaw strain values of Yedoma silt in this area varied from 20 to 60%. With typical wedge-ice content of 30–50%, complete thawing of 30-m-thick Yedoma in this area can result in thaw settlement of more than 20 m (Kanevskiy et al., 2012).
6.1.3 Comparison of Cryostratigraphy of the Old and New Cold Regions Research and Engineering Laboratory Tunnel Facilities
There is a significant difference in cryostratigraphy of the old and new sections of the Tunnel. Yedoma in the old Tunnel was greatly modified by erosional and thermokarst events that occurred following initial deposition. Almost all ice wedges identified in the old Tunnel were truncated by thermal erosion, and thermokarst-cave ice bodies are very common (Kanevskiy et al., 2008b; Fortier et al., 2008). In the new Tunnel (T2 and C1), we could also observe erosional features and thermokarst-cave ice bodies, but original Yedoma here was preserved much better.
Early studies of the old Tunnel (Sellmann, 1967; Sellmann, 1972; Hamilton et al., 1988) described upper and lower silt units with independent systems of ice wedges separated by a continuous thaw unconformity presumably caused by regional or widespread thermokarst. In our previous studies, we emphasized the syngenetic nature of permafrost in the old Tunnel and presented evidence that processes of Yedoma formation and thermal erosion were occurring simultaneously. Results of our studies in the old Tunnel did not confirm the existence of two silt units divided by a continuous thaw unconformity, as described previously. We attributed thaw unconformities to local thermokarst and thermo-erosional events (Shur et al., 2004; Kanevskiy et al., 2008b), and our studies in the recently excavated sections of the Tunnel gave us new evidence to confirm these ideas. First, there are numerous ice wedges extending from the ceiling to the floor (unlike the old Tunnel), although some exposed ice wedges were truncated by thermokarst and/or thermal erosion. Second, the vertical extent of the ice wedge in Borehole F2 exceeded 9 m (Supplementary Figure S10), which confirms the syngenetic nature of ice wedges in this study area. Third, all thaw unconformities in the new Tunnel were discontinuous and randomly distributed. Continuous unconformities were observed only near the portal of the new Tunnel and in the part of Crosscut #1 adjacent to the old Tunnel (Figures 6, 10, respectively). We attribute both of them to the Pleistocene/Holocene transition and consider them to be major stratigraphic boundaries separating the Pleistocene and Holocene deposits.
Another significant difference in cryostratigraphy of the new CRREL Tunnel compared to the old one was the absence of gravelly Holocene deposits, which were described near the portal of the old Tunnel. According to Hamilton et al. (1988), these fanlike deposits of poorly sorted debris, which unconformably overlie the Pleistocene silt, accumulated between 12,500 and 11,000 years BP during deep erosion of the Goldstream Creek valley slopes. We presume that accumulation of the Holocene gravel, which contains numerous logs and bones of Pleistocene mammals, occurred in a large gully that was filled relatively fast as a result of stream and mudflow activity during the Pleistocene/Holocene transition. Similar deposits filled the ice-wedge pseudomorph, which is visible on the walls and the ceiling of Crosscut #2 at 43–50 m, in the area adjacent to the old Tunnel (Supplementary Figure S39).
6.2 Water Stable Isotope Composition
In general, our data on the stable isotope composition of ground ice (Tables 1, Supplementary Tables S2–S8; Figures 11, 12) are in agreement with the available isotope data (Meyer et al., 2008; Douglas et al., 2011; Lachniet et al., 2012; Sloat, 2014; Jorgenson et al., 2015a, Jorgenson et al., 2015b; Porter et al., 2016; Schirrmeister et al., 2016) for different sites of Interior Alaska and adjacent regions of Canada (Table 4). In the old CRREL Permafrost Tunnel, the stable oxygen isotope values for the Pleistocene ice wedges ranged between −29.3 and −24.1%, and thermokarst-cave ice between −27.0 and −24.4% (Douglas et al., 2011). Sloat (2014) reported that average δ18O values for eight ice wedges ranged between −28.9 and −20.4% (average value -26.0%), while average values for seven “ice pools” (thermokarst-cave ice bodies) ranged between −26.6 and −21.8% (average value −23.4%). These values are slightly lower than the average δ18O values obtained during our study in the new CRREL Tunnel: −25.0% (n = 168) for the Pleistocene ice wedges and −22.7% (n = 68) for thermokarst-cave ice.
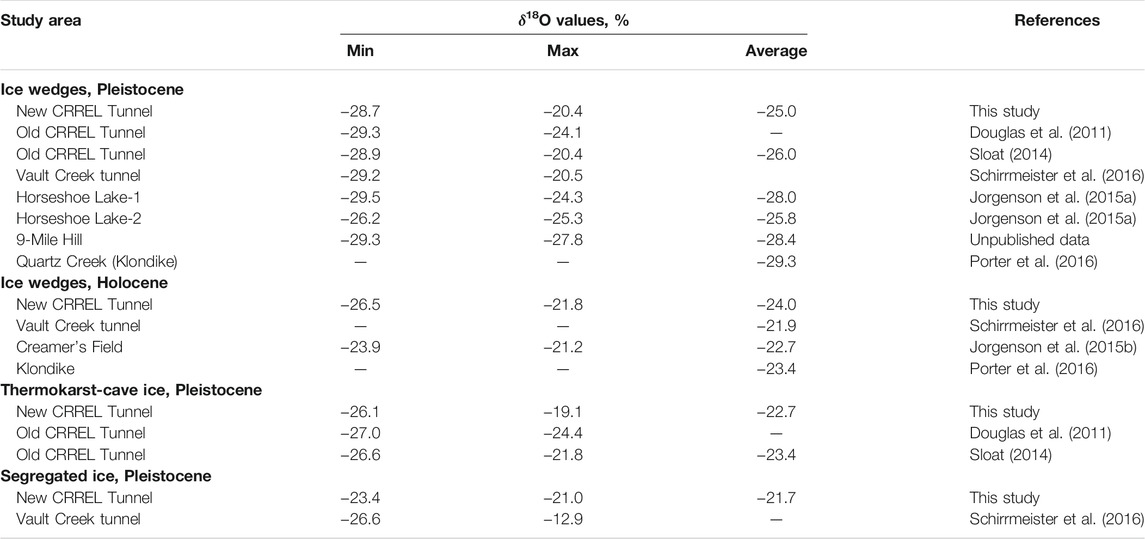
TABLE 4. δ18O values for various types of ground ice in Interior Alaska and adjacent regions of Canada.
In the Vault Creek permafrost tunnel located ∼10 km N of the CRREL Tunnel, the stable oxygen isotope values for 25 ice wedges (145 individual samples) ranged between ∼ −29.2 and −20.5%; values for segregated ice (23 samples) ranged between ∼ −26.6 and −12.9% (Meyer et al., 2008; Schirrmeister et al., 2016). In the Horseshoe Lake study area located ∼35 km SE of the CRREL Tunnel, we sampled two late Pleistocene ice wedges covered by ∼3-m-thick layer of ice-poor Holocene silt. In the first one, sampled at depths from 3.1 to 10.0 m, the stable oxygen isotope values ranged between −29.5 and −24.3% (n = 10, average value −28.0%). In the second one, sampled at depths from 3.6 to 3.8 m, the stable oxygen isotope values ranged between −26.2 and −25.3% (n = 3, average value −25.8%) (Jorgenson et al., 2015a). In the 9-Mile Hill study area located ∼90 km NW of the CRREL Tunnel (Kanevskiy et al., 2012), late Pleistocene ice wedges enclosed in Yedoma silt were sampled at depths from 2.7 to 16.0 m; the stable oxygen isotope values ranged between −29.3 and −27.8% (n = 5, average value −28.4%) (unpublished data).
For Holocene ice wedges in Interior Alaska, stable isotope data are limited. In the Vault Creek permafrost tunnel, the average stable oxygen isotope value for the presumably Holocene ice wedge was −21.9% (Meyer et al., 2008; Schirrmeister et al., 2016). In the Creamer’s Field study area located ∼10 km SW of the CRREL Tunnel, we sampled nine Holocene wedges (three of them were active) at depths from 0.7 to 3.3 m; the stable oxygen isotope values ranged between −23.9 and −21.2% (n = 22, average value −22.7%) (Jorgenson et al., 2015b). These values are slightly higher than the average δ18O value for the Holocene ice wedges obtained during our study in the new CRREL Tunnel (n = 16, average value −24.0%).
Thus, stable oxygen isotope values for Holocene ice wedges in various study areas of Interior Alaska and Canada are usually 2–5% higher than those of Pleistocene wedges (Table 4), which is related to lower winter temperatures during the late Pleistocene. Stable oxygen isotope values for the late Pleistocene thermokarst-cave ice are higher and have a wider range in comparison with the late Pleistocene ice wedges. This can be explained by different sources of water: while for ice wedges it is mostly snowmelt water, for thermokarst-cave ice it is a mixture of snowmelt water, rainwater, and water from melting ice wedges that accumulated in thermo-erosional gullies and underground cavities.
6.3 Radiocarbon Dating
The assemblage of 14C dates from the new CRREL Tunnel are generally stratigraphically consistent (Table 2; Figure 12A). The basal ages are usually older than the uppermost ages, but there are several reversals, and ages on subsamples of the same bulk sample can be as much as 2000 years different in age. In addition, there is no systematic bias in the dated material, sometimes the wood is older, other times non-woody material is older.
The stratigraphy of the Tunnel does not suggest wholesale mixing of the sediments (i.e., “the Quaternary in a blender”) as the radiocarbon dates show some stratigraphic integrity and the buried soils extend for 10 s of meters, albeit highly deformed adjacent to ice wedges and with abrupt elevation changes in other areas. The radiocarbon dates suggest either smaller-scale reworking during burial and afterwards or the deposition of material of different ages. In an active depositional environment, in a region of slow organic matter decomposition (such as the permafrost region), older material is frequently re-deposited, which complicates interpretation of depositional patterns (Lenz et al., 2016). Various problems of radiocarbon dating in the permafrost region were discussed by Kennedy et al. (2010) and (Reyes et al., 2010a; Reyes et al., 2010b; Reyes et al., 2011) and highlighted the need to date multiple material types (wood vs. non-woody), especially when reworking is a possibility.
Numerous age inversions have been reported for the old CRREL Tunnel (Hamilton et al., 1988; Lachniet et al., 2012). Shur et al. (2004) suggested that inconsistency in radiocarbon dates obtained from the old Tunnel by Hamilton et al. (1988) may be related to the dating of material from thermokarst-cave ice bodies and soil pseudomorphs. Lachniet et al. (2012) stated that multiple age inversions in stratigraphic sections of the old CRREL Tunnel occurred through the incorporation of older organic matter by various processes of sediment redistribution.
Based on above-mentioned studies and our observations, we see several possible explanations for age inversions typical of Yedoma deposits: 1) deposition of different-aged material on the ground surface, 2) reworking of sediments during burial, 3) slump and collapse of sediments after burial as a result of surficial and underground erosion, which was common at the time of Yedoma formation, and 4) deposition of same-aged material at various elevations simultaneously (e.g., not only on the main surface, but inside the gullies or underground cavities).
In general, radiocarbon dates obtained from the new Tunnel are in agreement with those previously obtained from the old Tunnel (Sellmann, 1967; Hamilton et al., 1988; Long and Péwé, 1996; Kanevskiy et al., 2008a; Kanevskiy et al., 2008b; Lachniet et al., 2012). Radiocarbon dating at other sites in Interior Alaska showed a similar age of Yedoma silt. In the Vault Creek permafrost tunnel area, silt accumulation and ice-wedge growth occurred from 40,000–50,000 years BP to at least 25,000 years BP, forming ∼15-m-thick Yedoma unit; Holocene dates were reported for the uppermost 2-m-thick silty sand unit (Schirrmeister et al., 2016). In the 9-Mile Hill study area, radiocarbon dates for ∼25–30-m-thick Yedoma silt were 22,600 to 43,100 14C years BP (8 samples, depths from 1.7 to 17.8 m), and no Holocene dates were reported for this area (Kanevskiy et al., 2012). For the Klondike area, Fraser and Burn (1997) and Zazula et al. (2007) reported dates from 24,000 to 31,000 and from 24,000 to 29,500 14C years BP, respectively.
During our study, we weren’t looking specifically for tephra deposits and didn’t see any obvious ones. This does not rule out that they are present, especially cryptotephras (Payne et al., 2008; Pyne-O'Donnell et al., 2012). A pair of tephras at Halfway House site in Interior Alaska (Dawson and possibly the Chatanika tephras) date to ∼30,000 cal yr BP (Jensen et al., 2016). Based on radiocarbon dates obtained from our study, if they are present in T2, they would be right at the ceiling. The next older identified tephra at Halfway House is ∼77,000 cal yr BP (Dominion Creek tephra), which would be below the floor of T2. However, a number of thin tephra layers have been observed between these tephras at Halfway House site, which could also be present in the walls of T2.
6.4 Age and Nature of Ice Wedges in Yedoma
The absence of dates between ∼31,000 and 12,600 years BP, which we found in the new Tunnel and adjacent boreholes (Table 2; Figures 12A is also typical of the old Tunnel, where Hamilton et al. (1988) reported a similar hiatus. However, radiocarbon dating of the carbon dioxide in air bubbles and the organic carbon dissolved within the wedge ice showed much younger age than host sediments, and some Pleistocene ice wedges in the old Tunnel formed between 28,000 and 22,000 years BP while the age of host sediments exceeded 35,000 years BP (Lachniet et al., 2012). Similar studies in other regions (Opel et al., 2019; Holland et al., 2020; Wetterich et al., 2021) also found that ice wedges may be several thousand years younger than enclosing sediments. We hope a similar approach will be used during the future studies in the new Tunnel.
These studies, which revealed a large difference in age between ice wedges and host sediments, suggest our understanding of Yedoma as a sediment with large syngenetic ice wedges is probably oversimplified. Based on classification by Mackay, ice wedges can be classified as being either epigenetic, syngenetic, or anti-syngenetic in nature (Mackay, 2000; Murton, 2013; French, 2018). However, it is almost impossible to find “pure” epigenetic or syngenetic ice wedges. For example, the uppermost portions of many epigenetic ice wedges have some features typical of syngenetic ice wedges like ragged lateral margins and so-called “shoulders” (Romanovskii, 1977). Formation of such features may be caused by fluctuations in thaw depths. Lewkowicz (1994) described growth stages of modern ice wedges in relation to short-term climatic variability, which included alternating truncation and rejuvenation processes.
Very often the vertical extent of epigenetic ice wedges exceeds the local depth of frost cracking. The best example of such ice wedges are epigenetic wedges that develop within the intermediate layer after termination of sedimentation. Their formation occurs along with a gradual decrease in the active-layer thickness, mostly because of accumulation of organic matter; such a decrease leads to formation of the intermediate layer whose thickness under certain conditions may reach 1.5–2 m and even more (Shur, 1988; French and Shur, 2010; Shur et al., 2011). As a result, vertical extent of ice wedges may significantly exceed a depth of frost cracking. Romanovskii (1977) named such ice wedges “false syngenetic” because they had features typical of syngenetic ones, despite their epigenetic nature in relation to host sediments. We suggest to name these ice wedges “quasi-syngenetic” after Shur who used this term to describe a specific type of permafrost, which aggrades upward, like syngenetic permafrost, but without accumulation of a new sediment on the soil surface, and forms the ice-rich intermediate layer (Shur, 1988; Shur et al., 2011). Such ice wedges are very common in the continuous permafrost zone, where they form in the modern intermediate layer that has developed on top of Yedoma (Kanevskiy et al., 2011; Shur et al., 2021a).
Similarly, it is difficult to find “pure” syngenetic ice wedges because some portions of these wedges are always epigenetic, at least their lowermost parts (Shumskii, 1959; Shur et al., 2004). Technically, any syngenetic ice wedge can be defined as an assemblage of epigenetic ice veins because host sediments are always older than individual ice veins. That means that we should either determine what time gap between sedimentation and ice-wedge formation is sufficient to consider a wedge epigenetic, or use a different approach based on ice-wedge morphology and, first of all, comparison of vertical extent of ice wedges with a depth of frost cracking. In the new Tunnel, we observed numerous small buried epigenetic ice wedges and veins (Figures 6, 10) but the shape and dimensions of larger ice wedges indicate that these wedges are either syngenetic or consist of several generations of epigenetic ice wedges, which probably better explains a significant difference in age between ice wedges and host sediments reported by Lachniet et al. (2012).
6.5 Cryostratigraphy of the CRREL Permafrost Tunnel and its Importance for Quaternary Studies of Eastern Beringia
In this study, we focus mainly on permafrost features and do not discuss paleoenvironmental issues. However, it is important to note that the new CRREL Permafrost Tunnel is a unique place to study the late-Pleistocene paleoenvironment in conjunction with general studies of eastern Beringia that have been performed in Alaska and Canada (Hopkins, 1982; Anderson and Lozhkin, 2001; Begét, 2001; Muhs et al., 2003; Bigelow, 2007; Elias and Brigham-Grette, 2007; Wooller et al., 2007; Froese et al., 2009; Porter et al., 2016). While many Quaternary studies around Fairbanks, including detailed studies of the Gold Hill, Birch Hill, and Halfway House sites (e.g., Muhs et al., 2003; Jensen et al., 2016), were performed in the areas where Yedoma and underlying loess deposits had already thawed, in the CRREL Permafrost Tunnel we can describe and sample frozen sediments perfectly preserved since the late Pleistocene.
Permafrost Tunnel facilities are especially important for researchers because exposed surfaces remain stable for decades (rates of sublimation are relatively small), while natural exposures of ice-rich permafrost retreat very fast and often become covered by reworked sediments in several years, which makes impossible revisiting them to continue studies of exposed bluffs. The newly exposed surfaces also provide unique opportunities to expand previous Quaternary studies performed in the old CRREL Tunnel (Sellmann, 1967; Sellmann, 1972; Hamilton et al., 1988; Long and Péwé, 1996; Wooller et al., 2007; Douglas et al., 2011; Wooller et al., 2011; Lachniet et al., 2012). We hope that the results of cryostratigraphic mapping presented in this study will serve as a foundation for the future Quaternary research in the new CRREL Permafrost Tunnel.
7 Conclusion
Excavation of the new sections of the CRREL Permafrost Tunnel, which started in 2011, provides a new and unique opportunity to study structure, properties, biogeochemical characteristics, and deposition history of Yedoma—ice-rich syngenetically frozen silt with large ice wedges.
In Interior Alaska, Yedoma has been observed at numerous sites within the Yukon-Tanana uplands. The most comprehensive data on the structure and properties of Yedoma in this area have been obtained in the CRREL Permafrost Tunnel near Fairbanks, which became available to researchers in the mid-1960s. In this paper, we introduce a new and unique research facility for yedoma studies and present the results of cryostratigraphic mapping of the walls and ceiling of a 110-m-long section of the main adit of the new Tunnel and a 50-m-long crosscut connecting the new and old Tunnels.
General cryostratigraphic maps and detailed maps of some parts of the new Tunnel show various characteristics typical of Yedoma: foliated ice wedges with a vertical extent of more than 10 m, the prevalence of micro-cryostructures, distinctive ice belts, and the occurrence of large amounts of weakly decomposed organic matter throughout the entire thickness of Yedoma.
Based on the studies in the Tunnel and results of drilling, six main cryostratigraphic units were distinguished (described from the top): 1) active layer; 2) modern intermediate layer (ice-rich silt); 3) 3- to 6-m-thick layer of the Holocene silt, mainly ice poor, with small ice wedges; 4) 10- to 14-m thick layer of the ice-rich late Pleistocene Yedoma silt with large ice wedges; 5) relatively ice-poor fluvial gravel; and 6) ice-poor bedrock.
Modern ice-rich intermediate layer and ice-poor silt layer protect ice-rich Yedoma deposits with large ice wedges from thermokarst development. Occurrence of these layers explains resilience of Yedoma to recent climatic impacts and local disturbances even in the areas of warm discontinuous permafrost.
Comparison of cryostratigraphy of the old and new parts of the CRREL Permafrost Tunnel shows significant differences. Yedoma in the old Tunnel was greatly destroyed or modified by erosional and thermokarst events, and almost all ice wedges in the main adit of the old Tunnel were truncated by thermal erosion. In the recently excavated sections of the Tunnel, erosional features and thermokarst-cave ice bodies also occur, but original Yedoma is much better preserved. Another significant difference in cryostratigraphy of the new sections of the CRREL Tunnel compared to the old ones is the absence of gravelly Holocene deposits, which were described near the portal of the old Tunnel.
Our studies in the CRREL Permafrost Tunnel do not confirm the existence of two Pleistocene silt units divided by a continuous thaw unconformity, as described previously. The processes of Yedoma formation and thermal erosion were going simultaneously, and we attribute thaw unconformities to local thermokarst and thermo-erosional events.
We are planning to continue our cryostratigraphic studies in the CRREL Permafrost Tunnel and perform mapping of two other crosscuts in the future.
Data Availability Statement
Data are available through the NSF-funded Arctic Data Center (Shur et al., 2015 https://arcticdata.io/catalog/view/doi%3A10.18739%2FA2SP6G).
Author Contributions
MK designed this study, performed cryostratigraphic mapping, and drafted a first version of the manuscript. YS developed a general concept of Yedoma cryostratigraphy in the study area. MK, NHB, KLB, and TAD collected samples in the new CRREL Permafrost Tunnel. TAD processed water stable isotope samples and analyzed the results. NHB collected radiocarbon samples and analyzed the results. All co-authors performed Yedoma studies at other Alaskan sites, including the old CRREL Permafrost Tunnel. All co-authors contributed to the manuscript writing and editing process.
Funding
This study was supported by the Department of Defense grant (AKRO-CRREL Soil and Water Sample Analyses) and National Science Foundation grants OPP-1820883, ARC-1107571, OPP-1806213, NNA-1928237, and NNA-2022590. TD acknowledges funding from the U.S. Army Corps of Engineers Engineer Research and Development Center Basic Research Program under PE 0601102/AB2 (Protection, Maneuver, Geospatial, Natural Sciences) and the Department of Defense’s Strategic Environmental Research and Development Program project RC18-1170.
Conflict of Interest
The authors declare that the research was conducted in the absence of any commercial or financial relationships that could be construed as a potential conflict of interest.
Publisher’s Note
All claims expressed in this article are solely those of the authors and do not necessarily represent those of their affiliated organizations, or those of the publisher, the editors and the reviewers. Any product that may be evaluated in this article, or claim that may be made by its manufacturer, is not guaranteed or endorsed by the publisher.
Acknowledgments
We thank James Begét, Margaret Cysewski, Matthew Sturm, and Daniel Vandevort for their participation in the study. Isotope analyses of ground ice were performed at the Alaska Stable Isotope Facility (UAF) by Tim Howe and Norma Haubenstock and the CRREL Alaska geochemistry laboratory. Drilling in the study area was performed by GeoTek Alaska (2010) and Arthur Gelvin and Stephanie Saari, CRREL (2012). We thank Associate Editor Duane Froese and reviewers Matthew Lachniet and Alberto Reyes for their valuable comments and suggestions.
Supplementary Material
The Supplementary Material for this article can be found online at: https://www.frontiersin.org/articles/10.3389/feart.2021.758800/full#supplementary-material
References
Anderson, P. M., and V. Lozhkin, A. (2001). The Stage 3 Interstadial Complex (Karginskii/middle Wisconsinan Interval) of Beringia: Variations in Paleoenvironments and Implications for Paleoclimatic Interpretations. Quat. Sci. Rev. 20, 93–125. doi:10.1016/s0277-3791(00)00129-3
Arcone, S. A., and Delaney, A. J. (1984). Field Dielectric Measurements of Frozen silt Using VHF Pulses. Cold Regions Sci. Technology 9, 29–37. doi:10.1016/0165-232X(84)90045-4
Begét, J. E. (2001). Continuous Late Quaternary Proxy Climate Records from Loess in Beringia. Quat. Sci. Rev. 20, 499–507. doi:10.1016/s0277-3791(00)00102-5
Bigelow, N. H. (2007). “POLLEN RECORDS, LATE PLEISTOCENE | Northern North America,” in Encylopedia of Quaternary Science. Editor S. A. Elias (Amsterdam: Elsevier), 2633–2648. doi:10.1016/b0-44-452747-8/00193-9
Bjella, K., and Sturm, M. (2012). “A New Permafrost Research Tunnel: Methodology, Design, and Excavation,” in Proceedings of the Tenth International Conference on Permafrost, Salekhard, Yamal-Nenets Autonomous District, Russia, June 25–29. Editor K. M. Hinkel (Salekhard: The Northern Publisher), 39–44.
Black, R. F. (1978). “Fabrics of Ice Wedges in central Alaska,” in Proceedings of the Third International Conference on Permafrost, Edmonton, July 10–13, 1978 (Ottawa: National Research Council of Canada), 248–253.
Bray, M. T. (2008). “Effects of Soil Cryostructure on the Long-Term Strength of Ice-Rich Permafrost Near Melting Temperatures,” in Proceedings of the Ninth International Conference on Permafrost, Fairbanks, Alaska, June 29 – July 3, 2008. Editors D. L. Kane, and K. M. Hinkel (Fairbanks: Institute of Northern Engineering; University of Alaska Fairbanks) Vol. 1, 183–188.
Bray, M. T., French, H. M., and Shur, Y. (2006). Further Cryostratigraphic Observations in the CRREL Permafrost Tunnel, Fox, Alaska. Permafrost Periglac. Process. 17 (3), 233–243. doi:10.1002/ppp.558
Brown, J., and Kreig, R. A. (Editors) (1983). Guidebook to permafrost and related features along the Elliott and Dalton Highways, Fox to Prudhoe Bay, Alaska. Fairbanks: University of Alaska Fairbanks.
Carter, L. D. (1988). “Loess and Deep Thermokarst Basins in Arctic Alaska,” in Proceedings of the Fifth International Conference on Permafrost, Trondheim, Norway (Trondheim: Tapir publishers), 706–711.
Chester, J. W., and Frank, J. N. (1969). Fairbanks Placers Fragmentation Research Final Report. Minneapolis: Twin Cities Mining Research Center. Minneapolis: U.S. Bureau of Mines, Heavy Metals Program. Auth. No. 9-1115-33.
Craig, H. (1961). Isotopic Variations in Meteoric Waters. Science 133 (3465), 1702–1703. doi:10.1126/science.133.3465.1702
Cysewski, M., Bjella, K., and Sturm, M. (2010). “The History and Future of the Permafrost Tunnel Near Fox, Alaska,” in Proceedings of the 6th Canadian Conference on Permafrost, Calgary, Alberta, Canada, September 12-16, 1222–1227.
Cysewski, M., Sturm, M., and Bjella, K. (2012). “The Significance of the Permafrost Tunnel (Fox, Alaska),” in Proceedings of the Tenth International Conference on Permafrost, Salekhard, Yamal-Nenets Autonomous District, Russia, June 25–29. Editor K. M. Hinkel (Salekhard: The Northern Publisher), 73–78.
Dansgaard, W. (1964). Stable Isotopes in Precipitation. Tellus 16 (4), 436–468. doi:10.3402/tellusa.v16i4.8993
Delaney, A. J. (1987). Preparation and Description of a Research Geophysical Borehole Site Containing Massive Ground Ice Near Fairbanks, Alaska. CRREL Special Report. Hanover, NH: Cold Regions Research and Engineering Laboratory, 87–7.
Delaney, A. J., and Arcone, S. A. (1984). Field Dielectric Measurements of Frozen silt Using VHF Pulses. Cold Regions Sci. Technology 9, 29–37. doi:10.1016/0165-232X(84)90045-410.1016/0165-232x(84)90046-6
Dick, R. A. (1970). Effects of Type of Cut, Delay and Explosive on Underground Blasting in Frozen Ground. U.S. Bureau of Mines Report of Investigations 7356. Washington, DC: U.S. Department of Interior, Bureau of Mines.
Douglas, T. A., and Mellon, M. T. (2019). Sublimation of Terrestrial Permafrost and the Implications for Ice-Loss Processes on Mars. Nat. Commun. 10 (1), 1716–1719. doi:10.1038/s41467-019-09410-8
Douglas, T. A., Fortier, D., Shur, Y. L., Kanevskiy, M. Z., Guo, L., Cai, Y., et al. (2011). Biogeochemical and Geocryological Characteristics of Wedge and Thermokarst-Cave Ice in the CRREL Permafrost Tunnel, Alaska. Permafrost Periglac. Process. 22, 120–128. doi:10.1002/ppp.709
Douglas, T. A., Hiemstra, C. A., Anderson, J. E., Barbato, R. A., Bjella, K. L., Deeb, E. J., et al. (2021). Recent Degradation of Interior Alaska Permafrost Mapped with Ground Surveys, Geophysics, Deep Drilling, and Repeat Airborne LiDAR. Cryosphere Discuss. doi:10.5194/tc-2021-47
Elias, S. A., and Brigham-Grette, J. (2007). GLACIATIONS | Late Pleistocene Events in Beringia. Amsterdam, Netherlands; Boston Mass: Elsevier, 1057–1066. doi:10.1016/b0-44-452747-8/00132-0
Ferreira, T., and Rasband, W. S. (2012). ImageJ User Guide — IJ 1.46. Available at: http://rsbweb.nih.gov/ij/docs/guide/user-guide.pdf. (Accessed August 12, 2021).
Fortier, D., and Allard, M. (2004). Late Holocene Syngenetic Ice-Wedge Polygons Development, Bylot Island, Canadian Arctic Archipelago. Can. J. Earth Sci. 41 (8), 997–1012. doi:10.1139/e04-031
Fortier, D., Allard, M., and Shur, Y. (2007). Observation of Rapid Drainage System Development by thermal Erosion of Ice Wedges on Bylot Island, Canadian Arctic Archipelago. Permafrost Periglac. Process. 18 (3), 229–243. doi:10.1002/ppp.595
Fortier, D., Kanevskiy, M., and Shur, Y. (2008). “Genesis of Reticulate-Chaotic Cryostructure in Permafrost,” in Proceedings of the Ninth International Conference on Permafrost, June 29 – July 3, 2008 Fairbanks, Alaska. Editors D. L. Kane, and K. M. Hinkel (Fairbanks: Institute of Northern Engineering; University of Alaska Fairbanks) Vol. 1, 451–456.
Fortier, D., Strauss, J., Sliger, M., Calmels, F., Froese, D., and Shur, Y. (2018). “Pleistocene Yedoma in South-Western Yukon (Canada): a Remnant of Eastern Beringia?” in 5th European Conference on Permafrost – Book of Abstracts, Chamonix, France, 23 June – 1 July 2018, 637–638.
Fraser, T. A., and Burn, C. R. (1997). On the Nature and Origin of “Muck” Deposits in the Klondike Area, Yukon Territory. Can. J. Earth Sci. 34, 1333–1344. doi:10.1139/e17-106
French, H., and Shur, Y. (2010). The Principles of Cryostratigraphy. Earth-Science Rev. 101, 190–206. doi:10.1016/j.earscirev.2010.04.002
Froese, D. G., Zazula, G. D., Westgate, J. A., Preece, S. J., Sanborn, P. T., Reyes, A. V., et al. (2009). The Klondike Goldfields and Pleistocene Environments of Beringia. GSA Today 19 (8), 4–10. doi:10.1130/gsatg54a.1
Grosse, G., Harden, J., Turetsky, M., McGuire, A. D., Camill, P., Tarnocai, C., et al. (2011). Vulnerability of High-Latitude Soil Organic Carbon in North America to Disturbance. J. Geophys. Res. 116, G00K06. doi:10.1029/2010JG001507
Guthrie, R. D. (1990). Frozen Fauna of the Mammoth Steppe: The story of Blue Babe. Chicago: Univ. Chicago Press.
Hamilton, T. D. (1994). “Late Cenozoic Glaciation of Alaska,” in The Geology of Alaska. The Geology of North America. Editors G. Plafker, and H. C. Berg (Boulder, Colorado: Geological Society of America), G-1, 813–844.
Hamilton, T. D., Craig, J. L., and Sellmann, P. V. (1988). The Fox Permafrost Tunnel: A Late Quaternary Geologic Record in central Alaska. Geol. Soc. America Bull. 100, 948–969. doi:10.1130/0016-7606(1988)100<0948:tfptal>2.3.co;2
Holland, K. M., Porter, T. J., Froese, D. G., Kokelj, S. V., and Buchanan, C. A. (2020). Ice-Wedge Evidence of Holocene Winter Warming in the Canadian Arctic. Geophys. Res. Lett. 47, e2020GL087942. doi:10.1029/2020GL0879424712
Hopkins, D. M. (1963). Geology of the Imuruk Lake Area, Seward Peninsula, Alaska. U.S. Geol. Surv. Bull. 1141-c, 101.
Hopkins, D. M. (1982). “Aspects of the Paleogeography of Beringia during the Late Pleistocene,” in Paleoecology of Beringia. Editors D. M. Hopkins, J. V. Mathews, C. E. Schweger, and S. B. Young (New York: Academic Press), 3–28. doi:10.1016/b978-0-12-355860-2.50008-9
Huang, S. L., Aughenbaugh, N. B., and Wu, M. C. (1986). Stability Study of CRREL Permafrost Tunnel. J. Geotechnical Eng. 112 (8), 777–790. doi:10.1061/(asce)0733-9410(1986)112:8(777)
Jensen, B. J. L., Reyes, A. V., Froese, D. G., and Stone, D. B. (2013). The Palisades Is a Key Reference Site for the Middle Pleistocene of Eastern Beringia: New Evidence from Paleomagnetics and Regional Tephrostratigraphy. Quat. Sci. Rev. 63, 91–108. doi:10.1016/j.quascirev.2012.11.035
Jensen, B. J. L., Evans, M. E., Froese, D. G., and Kravchinsky, V. A. (2016). 150,000 Years of Loess Accumulation in central Alaska. Quat. Sci. Rev. 135, 1–23. doi:10.1016/j.quascirev.2016.01.001
Johansen, N. I., Chalich, P. C., and Wellen, E. W. (1980). “Sublimation and Sublimation Control in the CRREL Tunnel,” in Proceedings of the Second International Symposium on Ground Freezing, Trondheim, Norway, June 24-26 (Rotterdam; Boston: A.A. Balkema), 952–968.
Johansen, N. I., and Ryer, J. W. (1982). “Permafrost Creep Measurements in the CRREL Tunnel,” in Proceedings of the Third International Symposium on Ground Freezing, Hanover, New Hampshire (Hanover, New Hampshire: U.S. Army CRREL), 61–63.
Jorgenson, T., Yoshikawa, K., Kanevskiy, M., Shur, Y., Romanovsky, V., Marchenko, S., et al. (2008). “Permafrost Characteristics of Alaska,” in Proceedings of the 9th International Conference on Permafrost, Extended Abstracts, Fairbanks, June 29–July 3, 2008. Editors A. K. Kane, D. L. Kane, and K M. Hinkel (Fairbanks: Institute of Northern Engineering, University of Alaska Fairbanks), 121–122.
Jorgenson, M. T., Harden, J., Kanevskiy, M., O’Donnell, J., Wickland, K., Ewing, S., et al. (2013). Reorganization of Vegetation, Hydrology and Soil Carbon after Permafrost Degradation across Heterogeneous Boreal Landscapes. Environ. Res. Lett. 8 (3), 035017. doi:10.1088/1748-9326/8/3/035017
Jorgenson, M. T., Kanevskiy, M., and Shur, Y. (Dataset 2015a). Horseshoe Lake Data. Arctic data center. doi:10.18739/A2SK86
Jorgenson, M. T., Kanevskiy, M., and Shur, Y. (Dataset 2015b). Creamer’s Field Data. Arctic data center. doi:10.18739/A22W61
Kanevskiy, M., Fortier, D., Shur, Y., Bray, M., and Jorgenson, T. (2008a). “Detailed Cryostratigraphic Studies of Syngenetic Permafrost in the Winze of the CRREL Permafrost Tunnel, Fox, Alaska,” in Proceedings of the Ninth International Conference on Permafrost, Fairbanks, Alaska, June 29 – July 3, 2008. Editors D. L. Kane, and K. M. Hinkel (Fairbanks: Institute of Northern Engineering, University of Alaska Fairbanks) Vol. 1, 889–894.
Kanevskiy, M., French, H., Shur, Y., Bjella, K. L., Bray, M. T., Collins, C. M., et al. (2008b). “Late-Pleistocene Syngenetic Permafrost in the CRREL Permafrost Tunnel, Fox, Alaska,” in A Guidebook Prepared for Ninth International Conference on Permafrost, Fairbanks, Alaska, June 29-July 3, 2008, 22 pp.
Kanevskiy, M., Shur, Y., Fortier, D., Jorgenson, M. T., and Stephani, E. (2011). Cryostratigraphy of Late Pleistocene Syngenetic Permafrost (Yedoma) in Northern Alaska, Itkillik River Exposure. Quat. Res. 75, 584–596. doi:10.1016/j.yqres.2010.12.003
Kanevskiy, M., Shur, Y., Connor, B., Dillon, M., Stephani, E., and O’Donnell, J. (2012). “Study of the Ice-Rich Syngenetic Permafrost for Road Design (Interior Alaska),” in Proceedings of the Tenth International Conference on Permafrost, Salekhard, Russia. The Northern Publisher, Salekhard, Russia, June 25-29, 2012. International Contributions. Editor K. M. Hinkel, 191–196.
Kaplina, T. N. (1981). History of Permafrost Development in Late Cenozoic. In: G. I. Dubikov, and V. V Baulin(eds) History of Development of Permafrost in Eurasia. Moscow, Nauka, 153–180. (in Russian).
Katasonov, E. M. (1954). Lithology of Frozen Quaternary Deposits (Cryolithology) of the Yana Coastal Plain. PhD Thesis: Obruchev Permafrost Institute: Moscow, PNIIIS, 176. (in Russian).
Kennedy, K. E., Froese, D. G., Zazula, G. D., and Lauriol, B. (2010). Last Glacial Maximum Age for the Northwest Laurentide Maximum from the Eagle River Spillway and delta Complex, Northern Yukon. Quat. Sci. Rev. 29 (9), 1288–1300. doi:10.1016/j.quascirev.2010.02.015
Kotler, E., and Burn, C. R. (2000). Cryostratigraphy of the Klondike “muck” Deposits, West-central Yukon Territory. Can. J. Earth Sci. 37, 849–861. doi:10.1139/e00-013
Kreig, R. A., and Reger, R. D. (1982). Air-photo Analysis and Summary of Landform Soil Properties along the Route of the Trans-Alaska Pipeline System. DGGS, College, Alaska Geologic Rep. 66. doi:10.14509/426
Kunitskiy, V. V. (1989). Cryolithology of the Low Lena River. Yakutsk: Permafrost institute, Academy of Sciences of the USSR. (in Russian).
Lacelle, D., and Vasil'chuk, Y. K. (2013). Recent Progress (2007-2012) in Permafrost Isotope Geochemistry. Permafrost Periglac. Process. 24 (2), 138–145. doi:10.1002/ppp.1768
Lachniet, M. S., Lawson, D. E., and Sloat, A. R. (2012). Revised 14C Dating of Ice Wedge Growth in interior Alaska (USA) to MIS 2 Reveals Cold Paleoclimate and Carbon Recycling in Ancient Permafrost Terrain. Quat. Res. 78, 217–225. doi:10.1016/j.yqres.2012.05.007
Lenz, J., Jones, B. M., Wetterich, S., Tjallingii, R., Fritz, M., Arp, C. D., et al. (2016). Impacts of Shore Expansion and Catchment Characteristics on Lacustrine Thermokarst Records in Permafrost Lowlands, Alaska Arctic Coastal Plain. Arktos 2, 25. doi:10.1007/s41063-016-0025-0
Lewkowicz, A. G. (1994). Ice-wedge Rejuvenation, Fosheim peninsula, Ellesmere Island, Canada. Permafrost Periglac. Process. 5, 251–268. doi:10.1002/ppp.3430050405
Linell, K. A., and Lobacz, E. F. (1978). “Some Experiences with Tunnel Entrances in Permafrost,” in Proceedings of the Third International Permafrost Conference, Edmonton, Alberta, Canada, July 10-13, 1978 (Ottawa, Canada: National Research Council of Canada), 813–819.
Long, A., and Péwé, T. L. (1996). Radiocarbon Dating by High-Sensitivity Liquid Scintillation Counting of wood from the Fox Permafrost Tunnel Near Fairbanks, Alaska. Permafrost Periglac. Process. 7 (3), 281–285. doi:10.1002/(sici)1099-1530(199609)7:3<281:aid-ppp222>3.0.co;2-y
Mackay, J. R. (1997). A Full-Scale Field experiment (1978-1995) on the Growth of Permafrost by Means of lake Drainage, Western Arctic Coast: a Discussion of the Method and Some Results. Can. J. Earth Sci. 34, 17–33. doi:10.1139/e17-002
Mackay, J. R. (2000). Thermally Induced Movements in Ice-Wedge Polygons, Western Arctic Coast: A Long-Term Study. Geographie Physique et Quaternaire 54 (1), 41–68.
Matheus, P., Begét, J., Mason, O., and Gelvin-Reymiller, C. (2003). Late Pliocene to Late Pleistocene Environments Preserved at the Palisades Site, central Yukon River, Alaska. Quat. Res. 60, 33–43. doi:10.1016/s0033-5894(03)00091-7
Meyer, H., Yoshikawa, K., Schirrmeister, L., and Andreev, A. (2008). “The Vault Creek Tunnel (Fairbanks Region, Alaska) – A Late Quaternary Palaeoenvironmental Permafrost Record,” in Proceedings of the Ninth International Conference on Permafrost, Fairbanks, Alaska, June 29 – July 3, 2008. Editors D. L. Kane, and K. M. Hinkel (Fairbanks: Institute of Northern Engineering; University of Alaska Fairbanks) Vol. 2, 1191–1196.
Muhs, D., Ager, T. A., Bettis, E. A., McGeehin, J., Been, J. M., Begét, J. E., et al. (2003). Stratigraphy and Palaeoclimatic Significance of Late Quaternary Loess-Palaeosol Sequences of the Last Interglacial-Glacial Cycle in central Alaska. Quat. Sci. Rev. 22, 1947–1986. doi:10.1016/s0277-3791(03)00167-7
Murton, J. B. (2013). “8.14 Ground Ice and Cryostratigraphy,” in Treatise on Geomorphology Glacial and Periglacial Geomorphology, Schoder, J. F. (editor-in-Chief. Editors R. Giardino, and J. Harboor (San Diego: Academic Press), 8, 173–201.
Newberry, R. J., Bundtzen, T. K., Clautice, K. H., Combellick, R. A., Douglas, T., Laird, G. M., et al. (1996). Preliminary Geologic Map of the Fairbanks Mining District. Alaska: Alaska Division of Geological & Geophysical Surveys Public Data File, 96–16. doi:10.14509/1740
Nossov, D. R., Torre Jorgenson, M., Kielland, K., and Kanevskiy, M. Z. (2013). Edaphic and Microclimatic Controls over Permafrost Response to Fire in interior Alaska. Environ. Res. Lett. 8 (3), 035013. doi:10.1088/1748-9326/8/3/035013
Opel, T., Murton, J. B., Wetterich, S., Meyer, H., Ashastina, K., Günther, F., et al. (2019). Past Climate and Continentality Inferred from Ice Wedges at Batagay Megaslump in the Northern Hemisphere's Most continental Region, Yana Highlands, interior Yakutia. Clim. Past 15 (4), 1443–1461. doi:10.5194/cp-15-1443-2019
Payne, R., Blackford, J., and van der Plicht, J. (2008). Using Cryptotephras to Extend Regional Tephrochronologies: An Example from Southeast Alaska and Implications for Hazard Assessment. Quat. Res. 69, 42–55. doi:10.1016/j.yqres.2007.10.007
Pettibone, H. C. (1973). “Stability of an Underground Room in Frozen Gravel,” in North American Contribution to Permafrost: Second International Conference, Yakutsk, U.S.S.R, 13-28 July 1973 (Washington DC: National Academy of Sciences), 699–706.
Péwé, T. L. (1954). Effect of Permafrost on Cultivated fields, Fairbanks Area, Alaska. Washington DC: US Government Printing Office.
Péwé, T. L. (1955). Origin of the upland silt Near Fairbanks, Alaska. Geol. Soc. America Bull. 66, 699–724. doi:10.1130/0016-7606(1955)66[699:ootusn]2.0.co;2
Péwé, T. L. (1975a). Quaternary Geology of Alaska. U.S. Geological Survey Professional Paper 835. Washington DC: Washington, United States Government Printing Office.
Péwé, T. L. (1975b). Quaternary Stratigraphic Nomenclature in Unglaciated Central Alaska. Geological Survey Professional Paper 862. Washington DC: United States Government Printing Office.
Péwé, T. L., Bell, J. W., Forbes, R. B., and Weber, F. R. (1976). Geologic Map of the Fairbanks D-2 SW Quadrangle, Alaska: U.S. Geological Survey Miscellaneous Investigations Series Map 829-A, 1 Sheet. scale 1, 24000.
Popov, A. I. (1953). Lithogenesis of Alluvial Lowlands in the Cold Climatic Conditions. Izvestiya (Transactions) USSR Acad. Sci. Geogr. 2 (in Russian).
Porter, T. J., Froese, D. G., Feakins, S. J., Bindeman, I. N., Mahony, M. E., Pautler, B. G., et al. (2016). Multiple Water Isotope Proxy Reconstruction of Extremely Low Last Glacial Temperatures in Eastern Beringia (Western Arctic). Quat. Sci. Rev. 137, 113–125. doi:10.1016/j.quascirev.2016.02.006
Porter, T. J., and Opel, T. (2020). Recent Advances in Paleoclimatological Studies of Arctic Wedge‐ and Pore‐ice Stable‐water Isotope Records. Permafrost and Periglac Process 31 (3), 429–441. doi:10.1002/ppp.2052
Pyne-O'Donnell, S. D. F., Hughes, P. D. M., Froese, D. G., Jensen, B. J. L., Kuehn, S. C., Mallon, G., et al. (2012). High-precision Ultra-distal Holocene Tephrochronology in North America. Quat. Sci. Rev. 52, 6–11. doi:10.1016/j.quascirev.2012.07.024
Reimer, P. J., Austin, W. E. N., Bard, E., Bayliss, A., Blackwell, P. G., Bronk Ramsey, C., et al. (2020). The IntCal20 Northern Hemisphere Radiocarbon Age Calibration Curve (0-55 Cal kBP). Radiocarbon 62, 725–757. doi:10.1017/rdc.2020.41
Reyes, A. V., Jensen, B. J. L., Zazula, G. D., Ager, T. A., Kuzmina, S., La Farge, C., et al. (2010a). A Late-Middle Pleistocene (Marine Isotope Stage 6) Vegetated Surface Buried by Old Crow Tephra at the Palisades, interior Alaska. Quat. Sci. Rev. 29, 801–811. doi:10.1016/j.quascirev.2009.12.003
Reyes, A. V., Froese, D. G., and Jensen, B. J. L. (2010b). Permafrost Response to Last Interglacial Warming: Field Evidence from Non-glaciated Yukon and Alaska. Quat. Sci. Rev. 29, 3256–3274. doi:10.1016/j.quascirev.2010.07.013
Reyes, A. V., Zazula, G. D., Kuzmina, S., Ager, T. A., and Froese, D. G. (2011). Identification of Last Interglacial Deposits in Eastern Beringia: a Cautionary Note from the Palisades, interior Alaska. J. Quat. Sci. 26 (3), 345–352. doi:10.1002/jqs.1464
Romanovskii, N. N. (1977). in Formirovanie Poligonal'no-Zhil'nykh Struktur [Formation of Polygonal-Wedge Structures]. Editor K. A. Kondratieva (Novosibirsk: Nauka), 215. (in Russian).
Romanovskii, N., Hubberten, H.-W., Gavrilov, A. V., Tumskoy, V. E., and Kholodov, A. L. (2004). Permafrost of the East Siberian Arctic Shelf and Coastal Lowlands. Quat. Sci. Rev. 23, 1359–1369. doi:10.1016/j.quascirev.2003.12.014
Schirrmeister, L., Meyer, H., Wetterich, S., Siegert, C., Kunitsky, V. V., Grosse, G., et al. (2008). “The Yedoma Suite of the Northeastern Siberian Shelf Region: Characteristics and Concept of Formation,”. Proceedings of the Ninth International Conference on Permafrost. June 29 – July 3, 2008. Fairbanks, Alaska. Editors D. L. Kane, and K. M. Hinkel (Fairbanks: Institute of Northern Engineering; University of Alaska Fairbanks), 2, 1595–1600.
Schirrmeister, L., Kunitsky, V., Grosse, G., Wetterich, S., Meyer, H., Schwamborn, G., et al. (2011). Sedimentary Characteristics and Origin of the Late Pleistocene Ice Complex on North-East Siberian Arctic Coastal Lowlands and Islands - a Review. Quat. Int. 241, 3–25. doi:10.1016/j.quaint.2010.04.004
Schirrmeister, L., Froese, D., Tumskoy, V., Grosse, G., and Wetterich, S. (2013). “PERMAFROST and PERIGLACIAL FEATURES | Yedoma: Late Pleistocene Ice-Rich Syngenetic Permafrost of Beringia,” in Encyclopedia of Quaternary Science. Second Edition, 542–552. doi:10.1016/b978-0-444-53643-3.00106-0
Schirrmeister, L., Meyer, H., Andreev, A., Wetterich, S., Kienast, F., Bobrov, A., et al. (2016). Late Quaternary Paleoenvironmental Records from the Chatanika River valley Near Fairbanks (Alaska). Quat. Sci. Rev. 147, 259–278. doi:10.1016/j.quascirev.2016.02.009
Schirrmeister, L., Dietze, E., Matthes, H., Grosse, G., Strauss, J., Laboor, S., et al. (2020). The Genesis of Yedoma Ice Complex Permafrost - Grain-Size Endmember Modeling Analysis from Siberia and Alaska. E&G Quat. Sci. J. 69, 33–53. doi:10.5194/egqsj-69-33-2020
Schuur, E. A. G., Mcguire, A. D., Schädel, C., Grosse, G., Harden, J. W., Hayes, D. J., et al. (2015). Climate Change and the Permafrost Carbon Feedback. Nature 520, 171–179. doi:10.1038/nature14338
Sellmann, P. V. (1967). Geology of the USA CRREL Permafrost Tunnel, Fairbanks, Alaska. Technical Report 199. Hanover, New Hampshire: U.S. Army Cold Regions Research & Engineering Laboratory.
Sellmann, P. V. (1972). Geology and Properties of Materials Exposed in the USA CRREL Permafrost Tunnel, Fairbanks, Alaska. Hanover, New Hampshire: U.S. Army Cold Regions Research & Engineering Laboratory, Special Report 177, 16.
Sher, A. V. (1997). “A Brief Overview of the Late Cenozoic History of the Western Beringian Lowlands,” in Proceedings of a joint Russian-American Workshop, Fairbanks, Alaska, June 1991. Terrestrial Paleoenvironmental Studies in Beringia. Editors M. E. Edwards, A. V. Sher, and R. D. Guthrie (Fairbanks: Alaska Quaternary Center), 3–7.
Sher, A. V., Kuzmina, S. A., Kuznetsova, T. V., and Sulerzhitsky, L. D. (2005). New Insights into the Weichselian Environment and Climate of the East Siberian Arctic, Derived from Fossil Insects, Plants, and Mammals. Quat. Sci. Rev. 24, 533–569. doi:10.1016/j.quascirev.2004.09.007
Shumskii, P. A. (1959). “Ground (Subsurface) Ice.” in Principles of Geocryology, Part I, General Geocryology (Moscow: Academy of Sciences of the USSR), 274–327. Chapter IX (in Russian) (English translation: C. de Leuchtenberg, 1964, National Research Council of Canada, Ottawa, Technical Translation 1130, 118 pp.).
Shur, Y. L. (1988). “The Upper Horizon of Permafrost Soils,” in Proceedings of the Fifth International Conference on Permafrost, Norway (Trondheim: Tapir Publishers), 867–871.
Shur, Y., and Jorgenson, M. T. (1998). “Cryostructure Development on the Floodplain of Colville River Delta, Northern Alaska,” in Proceedings of 7th International Conference on, Permafrost, Yellowknife, Canada, 993–999.
Shur, Y., French, H. M., Bray, M. T., and Anderson, D. A. (2004). Syngenetic Permafrost Growth: Cryostratigraphic Observations from the CRREL Tunnel Near Fairbanks, Alaska. Permafrost Periglac. Process. 15 (4), 339–347. doi:10.1002/ppp.486
Shur, Y., Jorgenson, M. T., and Kanevskiy, M. Z. (2011). “Permafrost,” in Encyclopedia of Earth Sciences Series, Encyclopedia of Snow, Ice and Glaciers. Editors V. P. Singh, P. Singh, and U. K. Haritashya, 841–848. doi:10.1007/978-90-481-2642-2
Shur, Y., Kanevskiy, M., Jorgenson, T., Dillon, M., Stephani, E., and Bray, M. (2012). “Permafrost Degradation and Thaw Settlement under Lakes in Yedoma Environment,” in Proceedings of the 10th International Conference on Permafrost, Salekhard, Russia, June 25–29, 2012. International Contributions. Editor K. M. Hinkel (Salekhard, Russia: The Northern Publisher), 383–388.
Shur, Y., and Kanevskiy, M. (Dataset: 2015). Mapping, New CRREL Tunnel. Arctic Data Center. doi:10.18739/A2J61K
Shur, Y., Kanevskiy, M., Bigelow, N. H., and Beget, J. (2015). Dataset: Forty-Thousand Years of Yedoma: An Investigation into the Spatial Heterogeneity and Paleo-History of Organic-Rich Permafrost in Alaska. urn:node:ARCTIC. doi:10.18739/A2SP6G
Shur, Y., Jones, B. M., Kanevskiy, M., Jorgenson, T., Jones, M. K. W., Fortier, D., et al. (2021a). Fluvio‐thermal Erosion and Thermal Denudation in the Yedoma Region of Northern Alaska: Revisiting the Itkillik River Exposure. Permafrost and Periglac Process 32, 277–298. doi:10.1002/ppp.2105
Shur, Y., Fortier, D., Jorgenson, T., Kanevskiy, M., Schirrmeister, L., Strauss, J., et al. (2021b). Yedoma Permafrost Genesis: Over 150 Years of Mystery and Controversy. Front. Earth Sci.
Kanevskiy, M., Shur, Y., Jorgenson, M. T., Ping, C.-L., Michaelson, G. J., Fortier, D., et al. (2013). Ground Ice in the Upper Permafrost of the Beaufort Sea Coast of Alaska. Cold Regions Sci. Technology 85, 56–70. doi:10.1016/j.coldregions.2012.08.002
Kanevskiy, M., Jorgenson, T., Shur, Y., O'Donnell, J. A., Harden, J. W., Zhuang, Q., et al. (2014). Cryostratigraphy and Permafrost Evolution in the Lacustrine Lowlands of West-Central Alaska. Permafrost Periglac. Process. 25 (1), 14–34. doi:10.1002/ppp.1800
Kanevskiy, M., Shur, Y., Strauss, J., Jorgenson, T., Fortier, D., Stephani, E., et al. (2016). Patterns and Rates of Riverbank Erosion Involving Ice-Rich Permafrost (Yedoma) in Northern Alaska. Geomorphology 253, 370–384. doi:10.1016/j.geomorph.2015.10.023
Sloat, A. (2014). Modern to Late Pleistocene Stable Isotope Climatology of Alaska. PhD thesis. UNLV Theses/Dissertations Las Vegas: University of Nevada.
Strauss, J., Schirrmeister, L., Grosse, G., Fortier, D., Hugelius, G., Knoblauch, C., et al. (2017). Deep Yedoma Permafrost: A Synthesis of Depositional Characteristics and Carbon Vulnerability. Earth-Science Rev. 172, 75–86. doi:10.1016/j.earscirev.2017.07.007
Strauss, J., Laboor, S., Schirrmeister, L., Fedorov, A. N., Fortier, D., Froese, D., et al. (2021). Circum-Arctic Map of the Yedoma Permafrost Domain. Front. Earth Sci. 9, 758360. doi:10.3389/feart.2021.758360
Swinzow, G. K. (1970). Permafrost Tunneling by a Continuous Mechanical Method. CRREL Technical Report 221. Hanover, NH: Cold Regions Research and Engineering Laboratory.
Thompson, E. G., and Sayles, F. H. (1972). In Situ creep Analysis of Room in Frozen Soil. J. Soil Mech. Found. Div. 9202 (SM9), 899–915. doi:10.1061/jsfeaq.0001780
Tomirdiaro, S. V. (1980). Loess-ice Formation of Eastern Siberia in the Late Pleistocene and Holocene. Moscow: Nauka. (in Russian).
Vasil'chuk, Y. K., and Murton, J. B. (2016). Stable Isotope Geochemistry of Massive Ice. Geogr. Environ. Sustainability 03 (09), 4–23.
Watanabe, O. (1969). On the Structure of Ground Ice in the USA CREEL Permafrost Tunnel, Fairbanks, Alaska. J. Jpn. Soc. Snow Ice 31 (3), 53–62. doi:10.5331/seppyo.31.53
Weerdenburg, P. C., and Morgenstern, N. R. (1983). “Underground Cavities in Ice-Rich Frozen Ground,” in Permafrost: Fourth International Conference Proceedings, Fairbanks, Alaska, July 17–22, 1983 (Washington DC: National Academy Press), 1384–1389.
Wetterich, S., Meyer, H., Fritz, M., Mollenhauer, G., Rethemeyer, J., Kizyakov, A., et al. (2021). Northeast Siberian Permafrost Ice‐Wedge Stable Isotopes Depict Pronounced Last Glacial Maximum Winter Cooling. Geophys. Res. Lett. 48, e2020GL092087. doi:10.1029/2020GL092087
Williams, J. R. (1962). Geologic Reconnaissance of the Yukon Flats District, Alaska. Washington, DC: U.S. Geological Survey Bulletin 111-H, 290–311.
Wooller, M. J., Zazula, G. D., Edwards, M., Froese, D. G., Boone, R. D., Parker, C., et al. (2007). Stable Carbon Isotope Compositions of Eastern Beringian Grasses and Sedges: Investigating Their Potential as Paleoenvironmental Indicators. Arctic, Antarctic, Alpine Res. 39 (2), 318–331. doi:10.1657/1523-0430(2007)39[318:scicoe]2.0.co;2
Wooller, M. J., Zazula, G. D., Blinnikov, M., Gaglioti, B. V., Bigelow, N. H., Sanborn, P., et al. (2011). The Detailed Palaeoecology of a Mid-wisconsinan Interstadial (Ca. 32 000 14 C a BP) Vegetation Surface from interior Alaska. J. Quat. Sci. 26, 746–756. doi:10.1002/jqs.1497
Zaikanov, V. G. (1991). “Formation of Structure and Properties of Floodplain Deposits of Large Rivers of Northern Yakutia,” in The Upper Horizon of Permafrost. Editors P. Melnikov, and Y. Shur (Moscow: Nauka), 31–47. (in Russian).
Zazula, G. D., Froese, D. G., Elias, S. A., Kuzmina, S., and Mathewes, R. W. (2007). Arctic Ground Squirrels of the mammoth-steppe: Paleoecology of Late Pleistocene Middens (∼24000-29450 14C Yr BP), Yukon Territory, Canada. Quat. Sci. Rev. 26, 979–1003. doi:10.1016/j.quascirev.2006.12.006
Zhestkova, T. N., Shvetsov, P. F., and Shur, Y. L. (1982). “Yedoma, Climatic Formation,” in XI Congress of International Union for Quaternary Research. Moscow: Abstracts, Vol. II, 389.
Keywords: ice wedge, thermokarst-cave ice, intermediate layer, cryostructures, thermokarst, thermal erosion, late Pleistocene
Citation: Kanevskiy M, Shur Y, Bigelow NH, Bjella KL, Douglas TA, Fortier D, Jones BM and Jorgenson MT (2022) Yedoma Cryostratigraphy of Recently Excavated Sections of the CRREL Permafrost Tunnel Near Fairbanks, Alaska. Front. Earth Sci. 9:758800. doi: 10.3389/feart.2021.758800
Received: 15 August 2021; Accepted: 07 December 2021;
Published: 03 March 2022.
Edited by:
Duane Froese, University of Alberta, CanadaReviewed by:
Matthew Lachniet, University of Nevada, Las Vegas, United StatesAlberto Reyes, University of Alberta, Canada
Copyright © 2022 Kanevskiy, Shur, Bigelow, Bjella, Douglas, Fortier, Jones and Jorgenson. This is an open-access article distributed under the terms of the Creative Commons Attribution License (CC BY). The use, distribution or reproduction in other forums is permitted, provided the original author(s) and the copyright owner(s) are credited and that the original publication in this journal is cited, in accordance with accepted academic practice. No use, distribution or reproduction is permitted which does not comply with these terms.
*Correspondence: Mikhail Kanevskiy, mkanevskiy@alaska.edu