Growth Model and Tectonic Significance of the Guman Fold Along the Western Kunlun Mountain Front (Xinjiang, China) Derived From Terrace Deformation and Seismic Data
 Jianhong Xu
 Jie Chen1
  J. Ramón Arrowsmith
 Tao Li
- 1State Key Laboratory of Earthquake Dynamics, Institute of Geology, China Earthquake Administration, Beijing, China
- 2The Second Monitoring and Application Center, China Earthquake Administration, Xi’an, China
- 3School of Earth and Space Exploration, Arizona State University, Tempe, AZ, United States
- 4School of Earth Science and Engineering, Sun Yat-Sen University, Guangzhou, China
The activity of blind thrust faults drives fold deformation of overlying strata, leading the folds to be geometrically related to the underlying blind thrust faults. However, it is often challenging to select an appropriate kinematic model for a thrust fault-related fold. To construct the model of the Guman fold in front of the Western Kunlun Mountains in western China, we interpret deformed terrace profiles and a high-resolution seismic reflection profile that crosses the fold. Combining deformation characteristics of the terrace profiles and subsurface structures interpreted from the seismic reflection data, the Guman fold is best explained as a fault-bend fold with lower flat-ramp-upper flat geometry that grows by kink-band migration. Previous studies and the seismic reflection profile show that the blind fault ramp dips 20 ± 4° to the south. Using the fault bend fold model with Monte Carlo probability distributions, the uplifted and dated T1c terrace surface (250 ± 35 ka) and fault geometry indicate a slip rate of 2.6+1.3/−0.4 mm/yr along the underlying fault ramp. The uplift of the pre-growth strata across the underlying fault ramp combined with the fold initiation in the early Pleistocene (2.14–1.8 Ma) indicate a long-term slip rate of 1.7+0.6/−0.2 mm/yr along the underlying fault ramp. For a lower flat-ramp-upper flat fault-bend fold with fault dip of 20°, 13% of the slip along the underlying fault ramp would be absorbed by the fold above the fault ramp, whereas 87% of the slip will be transferred forward along the upper fault flat. Therefore, the shortening accommodated by the Guman anticline is 0.34+0.18/−0.06 mm/yr while the slip rate along the upper fault flat is 2.3+1.1/−0.4 mm/yr since the T1c terrace abandonment. This result explains why the shortening of the Guman Anticline is largely hidden from the relative movement of Global Positioning Stations sites to the north and south of the fold. These findings support the view that most of the crustal shortening of the Western Kunlun Mountain is transferred basinward along the shallow detachment and is likely ultimately absorbed by the Mazatagh Thrust located 200 km away in the hinterland of the Tarim Basin.
Introduction
Blind reverse fault activity often folds the overlying strata. It has long been recognized that certain folds are geometrically related to the underlying blind thrust faults (e.g., Suppe, 1983; Jamison, 1987; Erslev, 1991; Epard and Groshong, 1993). Most thrust fault-related folds are characterized as fault-bend folds, fault-propagation folds, detachment folds (Jamison, 1987) and wedge-thrust folds (Shaw et al., 2004). Growth mechanisms of these folds are broadly assigned to kink-band migration (Suppe, 1983; Medwedeff, 1992; Medwedeff and Suppe, 1997) and limb rotation mechanisms (Erslev, 1991; Hardy and Ford, 1997; Allmendinger, 1998; Allmendinger and Shaw, 2000). Many kinematic models have been developed to establish a quantitative relationship between surface folds and the underlying thrust faults (e.g., Suppe, 1983; Erslev, 1991; Medwedeff, 1992; Epard and Groshong, 1993; Hardy and Ford, 1997; Medwedeff and Suppe, 1997; Allmendinger, 1998; Allmendinger and Shaw, 2000; Lavé and Avouac, 2000; Bernard et al., 2007; Le Béon et al., 2014; Saint-Carlier et al., 2016). However, it is often challenging to differentiate among kinematic models for specific thrust fault-related folds, because the fold geometries are often the same or similar on the surface and in seismic reflection profiles. At the same time, different kinematic models require different slip or slip rate calculation methods and also represent different structural deformation modes.
The growth mechanism and the associated subsurface geometry are requirements for building a kinematic model of an active fold. For example, if a terrace surface is preserved continuously across a fault-propagation fold or a detachment fold, conservation of excess area allows for estimating the cumulative horizontal shortening experienced by this marker, provided that the depth to the detachment fault is known (Epard and Groshong, 1993). This method is also applicable to fault-bend folds with an upper fault flat exposed to the surface (called “type 1 fault-bend fold” in this paper; Figure 1A1; e.g., Lavé and Avouac, 2000). However, if the upper fault flat of a fault-bend fold is not exposed (called “type 2 fault-bend fold” in this paper; Figure 1A2; e.g., Suppe, 1983), the excess-area conservation method is not applicable to the determination of the total shortening experienced by the surface terraces. This is because a majority of the deformation will be accommodated by the upper fault flat and the fold above the fault ramp absorbs only a small portion of the deformation (Figures 1A2,A3; Suppe, 1983; Epard and Groshong, 1993). An alternative approach to calculate horizontal shortening is to divide uplift by the sine of structural dip, given that a fault-bend fold grows by kink-band migration (Figures 1B1,B2; e.g., Suppe, 1983; Lavé and Avouac, 2000).
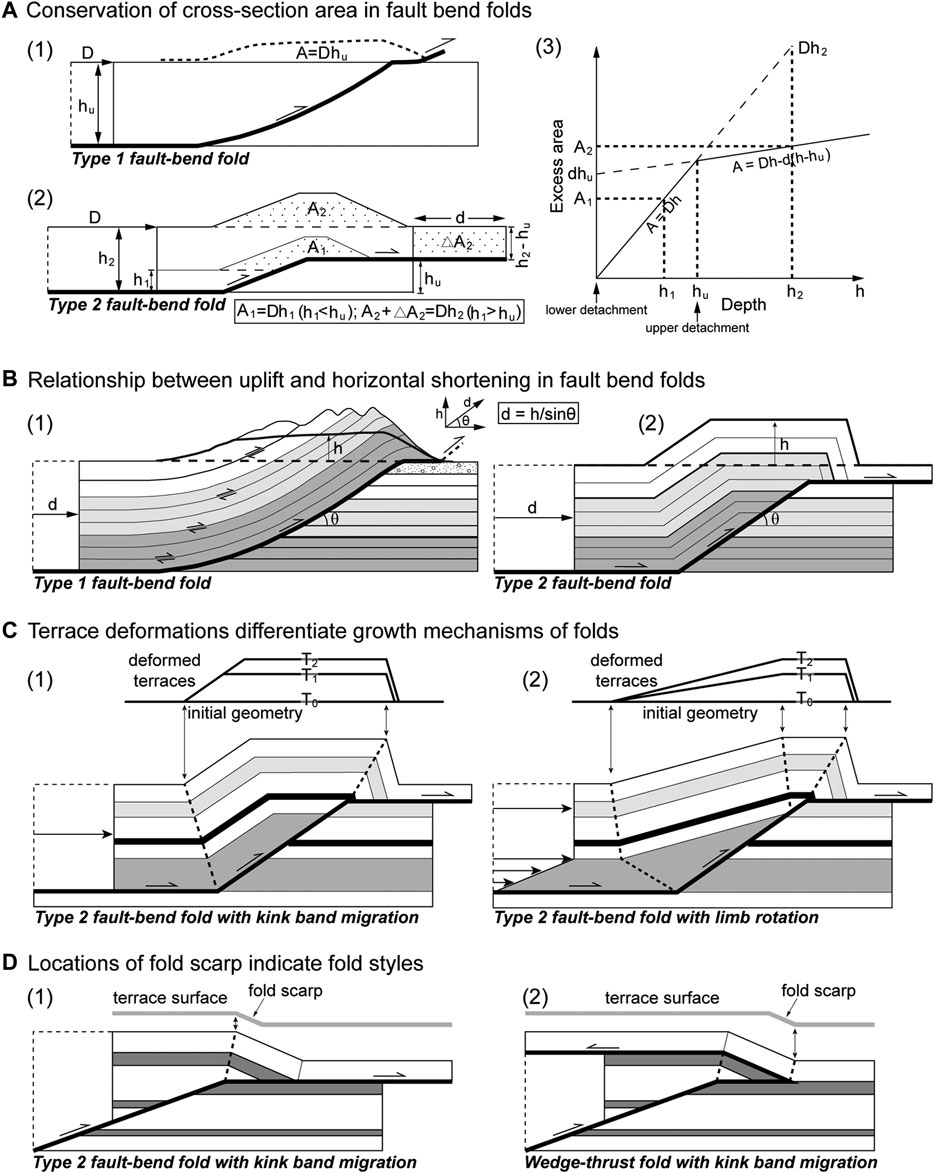
FIGURE 1. Schematic diagrams showing the kinematic link between terrace deformation and the geometry of fault-bend folds. (A1) In type 1 fault-bend folds, the magnitude of the excess area is a product of the displacement on the lower detachment (D) and the depth to the detachment (h) (Lavé and Avouac, 2000). (A2) In type 2 fault-bend folds, the excess-area conservation method is not applicable because some material (△A2) is translated out of the fold for levels above the upper flat (h > hu), whereas all the area involved is expressed as excess area (A1) for levels below the upper flat (h < hu) (Epard and Groshong, 1993). (A3) Excess area vs. depth diagram (Epard and Groshong, 1993). The excess area above and below the upper flat is represented by two line segments which intersect at the stratigraphic level of the upper flat. (B1,B2) In fault-bend folds, if they grow by kink band migration, horizontal shortening is equal to uplift divided by the sine of the underlying ramp dip (e.g., Suppe, 1983; Lavé and Avouac, 2000). (C1) The terrace folds localized across the active axial surfaces are normally indicative of kink band migration. The terraces above the ramp are parallel to each other. (C2) Simple shear fault-bend folds produce two dip panels of different magnitudes. Long distance of tilt deformation occurs across the pre-growth shear interval by limb rotation. The location of active folding of ground surface relative to the geometry of a fold can be used to distinguish between folding styles. Fold scarps that grow at an anticlinal axial surface by kink band migration are often type 2 fault-bend folds (D1). Alternatively, fold scarps that grow at a synclinal axial surface are often indicative of wedge-thrust folds (D2).
River terraces, which are accessible and less challenging to date than growth strata (e.g., Suppe et al., 1992; Shaw and Suppe, 1994), record incremental fold deformation at different time scales (e.g., Rockwell et al., 1988; Lavé and Avouac, 2000; Thompson et al., 2002; Chen et al., 2005; Hubert-Ferrari et al., 2007; Bernard et al., 2007; Daëron et al., 2007; Simoes et al., 2007; Simoes et al., 2014; Stockmeyer et al., 2017; Charreau et al., 2018). Therefore, deformation characteristics of river terrace sequences can be used to distinguish between the growth mechanisms of folds. For fault-bend folds that grow by kink-band migration (Figure 1C1), terraces can be deformed as they pass through the active fold axis (Suppe et al., 1997; Lu et al., 2002; Chen et al., 2005; Scharer et al., 2006; Hubert-Ferrari et al., 2007; Ishiyama et al., 2004; Ishiyama et al., 2007), while far from active axis, these surfaces are not deformed (Suppe et al., 1997; Hubert-Ferrari et al., 2007; Li and Chen, 2014; Stockmeyer et al., 2017). For shear fault-bend folds (Figure 1C2), gradual rotation of fold limbs causes overlying terraces to tilt over a substantial horizontal distance (Rockwell et al., 1988; Chen et al., 2005; Scharer et al., 2006; Hubert-Ferrari et al., 2007). Furthermore, fold scarps can represent the active axis surface of a fold that grows by kink-band migration (Lu et al., 2002; Chen et al., 2005; Chen et al., 2007; Scharer et al., 2006; Hubert-Ferrari et al., 2007; Li and Chen, 2014), so some types of folds can be distinguished by their location relative to the fold’s front limb (Ishiyama et al., 2004; Ishiyama et al., 2007). Fold scarps that grow at the anticlinal axis are related to type 2 fault-bend folds (Figure 1D1), whereas fold scarps located at synclinal axis are often indicative of wedge thrust folds (Figure 1D2) (Medwedeff, 1992; Ishiyama et al., 2004; Ishiyama et al., 2007). Determining which type of fold model is active requires knowledge of the geometry of folds and faults at depth that can be well constrained from high-resolution seismic reflection profiles. Therefore, combining river terrace deformation patterns and high-resolution seismic profiles is an effective strategy to build kinematic fold models (e.g., Ishiyama et al., 2004; Ishiyama et al., 2007; Shaw et al., 2004; Stockmeyer et al., 2017).
The Guman fold is located in front of the Western Kunlun Mountain of northwest China (Figure 2A). This area has been contracting since the Late Cenozoic (Sobel and Dumitru, 1997; Yin et al., 2002; Jiang and Li, 2014). A large number of fault scarps are present along the frontal fold zone (Figure 3B; Pan et al., 2007; Li et al., 2016; Li et al., 2018) where the M6.4 Pishan earthquake occurred on July 3, 2015 (Figures 2A, 3B), indicating a strong activity of the fold. Despite this recent and other geological evidence for active tectonic deformation, the Global Positioning Stations (GPS) sites to the north and south of the fold show a roughly constant northward velocity (Figures 2A,C1,C2, 3B; Li et al., 2016). Therefore, understanding the activity of the Guman fold is important for accessing the tectonics of the Western Kunlun Mountain region and the seismic hazard. However, based on seismic profiles in front of the Western Kunlun Mountain, previous studies have different interpretations of the fold. Li et al. (2016) proposed that the Guman fold is controlled by a structural wedge, indicating that fault slip progressively shifts toward the hinterland along a back thrust (Li et al., 2018). Jiang et al. (2013) interpreted the fold as a fault-propagation fold that absorbs the tectonic deformation in front of the mountain. Other geologists (Liang et al., 2012; Lu et al., 2016; Cheng et al., 2017; Guilbaud et al., 2017; Li et al., 2018) have suggested that the fold is part of a fault-bend fold system where a large amount of the fault slip is transferred along the upper detachment and could reach the Mazatagh fault, about 200 km north of the fold (Figure 2B). These variable results hinder us from choosing an appropriate kinematic fold model to estimate the deformation of Guman fold. Guilbaud et al. (2017) used the excess-area conservation method applied to terraces to estimate that the slip rate along the blind thrust fault of the Guman Fold is 0.5–2.5 mm/yr. However, the estimate must be refined with constraints on fold growth mechanism and subsurface geometry because the excess-area conservation method may not be applicable for terraces, if the Guman fold is a type 2 fault-bend fold in which some material is transferred out of the fold (Figures 1A2,A3; Suppe, 1983; Epard and Groshong, 1993). Based on the seismic profile, Li et al. (2016, 2018) proposed minimum slip rates of ≥0.8 mm/yr or ≥1.2 mm/yr since the initiation of deformation. These results leave a significant gap in our understanding of the late Quaternary shortening rate accommodated by the Guman fold.
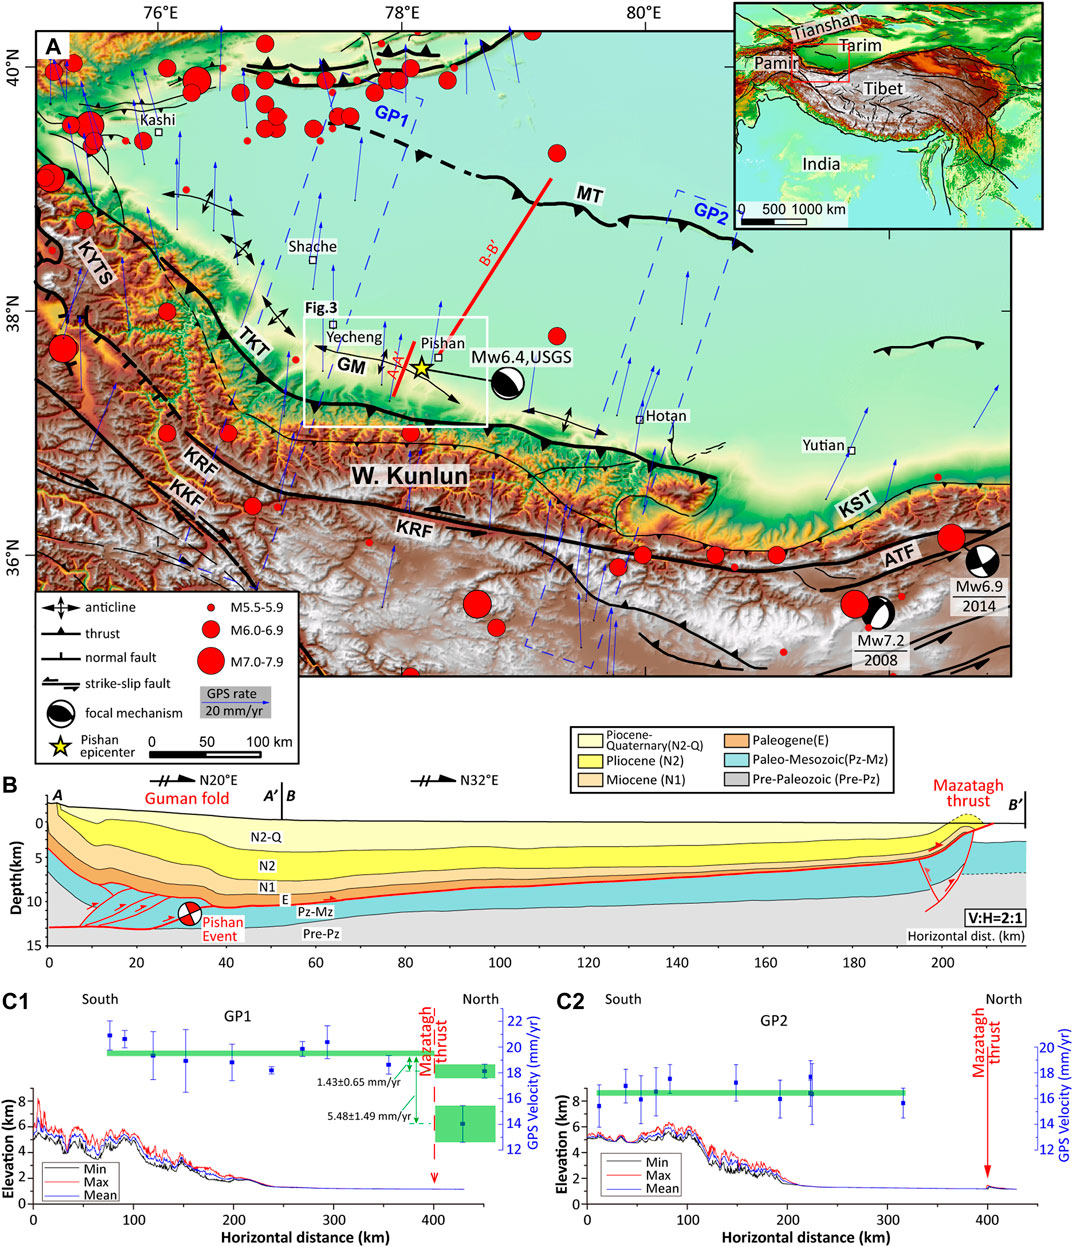
FIGURE 2. (A) Structures and historical earthquakes along the Western Kunlun Mountain. Inset shows the study area. GPS velocities are relative to stable Eurasia from Zheng et al. (2017). Earthquake locations are from the China Earthquake Network Center seismic catalog from 1853 to 2018. ATF, AltynTagh Fault; GM, Guman fold; KKF, Karakoram Fault; KRF, Karakax Fault; KST, Kashitashi Thrust; KYTS, Kashi-Yecheng Transfer System; MT, Mazatagh Thrust; TKT, Tieklik Thrust. Shaded relief map is based on the 30 m SRTM DEM. (B) Geologic section across the Guman fold and the Mazatagh Thrust fault with 2× vertical exaggeration (Li et al., 2016; Lu et al., 2016; Guilbaud et al., 2017). See (A) for the location. (C) Topographic profiles and GPS velocities. Elevation data are from the 30 m SRTM DEM, with 11× vertical exaggeration.
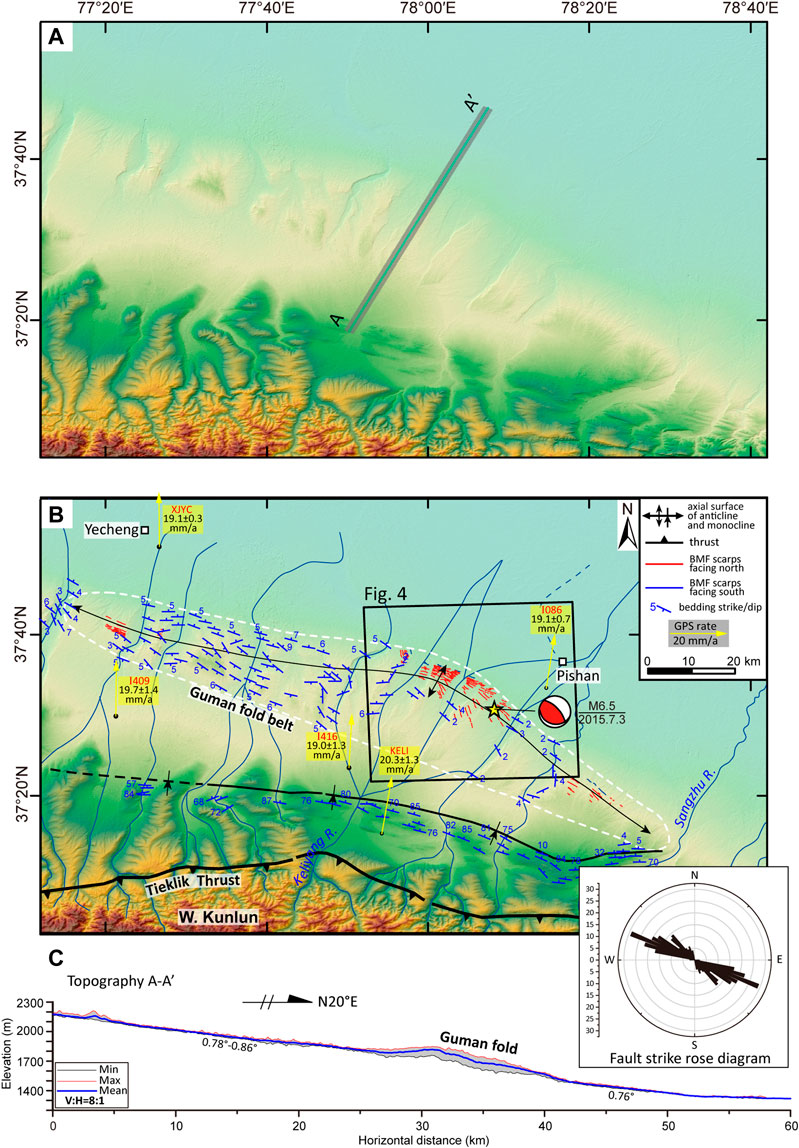
FIGURE 3. (A) Uninterpreted 12.5 m ALOS DEM shaded relief map showing the Guman fold in front of the Western Kunlun Mountains. (B) Guman fold outlined by white dashed lines. Yellow arrows are GPS velocities relative to stable Eurasia (Zheng et al., 2017). Bedding orientations are from Li et al. (2016). Rose diagram based on mapped fault traces. (C) 2 km wide topographic swath profile from the 12.5 m ALOS DEM. See (A) for location.
In this paper, we develop and test a kinematic model for the Guman fold that couples topography data, kinematic modeling, and geodetic velocities. To build the kinematic model for the Guman fold, we first determine the growth mechanism from deformation pattern of terraces that cross the fold. Secondly, based on comprehensive analysis of the terrace deformation and the subsurface geometry of the fold revealed by a high-resolution seismic profile, we build the kinematic fold model using the theory of fault-bend fold. Based on the established kinematic model, the slip and slip rate along the underlying fault ramp is determined from deformed terrace uplift and exposure age. We also estimate the long-term slip rate using pre-growth strata uplift and the age of initiation of deformation of the Guman fold. The Monte Carlo simulation is used in the calculation, incorporating the input parameter uncertainty. Our findings refine the slip rate along the underlying fault ramp and the deformation patterns in front of the Western Kunlun Mountain.
Tectonic Setting of Guman Fold Belt
The Western Kunlun Mountain are located at the northern edge of the Tibetan Plateau and were formed during the late Cenozoic due to the India-Asia collision (Figure 2A; Sobel and Dumitru, 1997; Yin et al., 2002; Jiang and Li, 2014). Three large faults are present in the Western Kunlun orogenic belt: the left-lateral Karakax fault to the southeast, the Kashgar-Yecheng right-lateral transitional fault to the west, and the south-dipping Tieklik thrust fault (Figure 2A). The Tieklik thrust forms the boundary between the Western Kunlun Mountains and the Tarim Basin and accommodates the convergence between the Tibetan plateau and the Tarim Basin (Gao et al., 2000; Kao et al., 2001; Wittlinger et al., 2004). Few fault-related geomorphic features and only rare earthquakes indicate that this fault may have been inactive in recent times (Pan et al., 2007). However, the high topographic relief and up to 12 km thick Cenozoic sediments in the foreland basin indicate strong deformation basinward of the mountain (e.g., Yin et al., 2002; Jiang and Li, 2014). Besides, the Mazatagh thrust in the center of the Tarim Basin (Figure 2A) is 300 km long, oriented parallel the Western Kunlun Mountains front, and may have been active since the late Miocene or middle Pleistocene (Yang et al., 2007; Pan et al., 2010; Si et al., 2011). The minimum shortening rate across the Mazatagh fold-thrust belt since the middle Pleistocene is 0.9 mm/yr (Pan et al., 2010).
Uplift and foreland-ward propagation of the Western Kunlun Mountains have contributed to continued growth of the Tibetan Plateau since ∼25 Ma (e.g., Sobel and Dumitru, 1997; Ritts et al., 2008; Jiang and Li, 2014). Himalayan movement since Pliocene (∼5 Ma) have apparently caused much stronger convergence and folding of the northern Tibetan Plateau (Zheng et al., 2000; Wang et al., 2003; Hu et al., 2008; Jiang and Li, 2014; Liang et al., 2014). The Tarim Basin, located north of the Western Kunlun Mountain, includes two detachments with gypsum layers that localize deformation (Lu et al., 2016). The gypsiferous detachments are in the lower Paleocene and the Middle to Lower Cambrian units (Lu et al., 2016). On the geologic cross-section perpendicular to the orogenic belt (Figure 2B), the deep structure in the piedmont is a duplex with a stack of four thrust slices between the deep Cambrian and the shallow Paleogene detachments (Guilbaud et al., 2017). At the front of this duplex, the blind ramp connects these two detachments (Guilbaud et al., 2017). The Guman fold is above the leading edge of the imbricate blind duplex (Figure 2B).
The Guman fold is located near Yecheng and Pishan cities (Figures 2A, 3B). Previous studies referred to the structure as the Yecheng-Pishan fold (Guilbaud et al., 2017), the Pishan fold (Wu et al., 2019), and the Guman fold. Guman fold is used by most researchers (e.g., Wu et al., 2004; Pan et al., 2007; Cheng et al., 2011; Guan et al., 2013) and geological maps and we use this term. The fold is oriented NW-SE and has a ∼140 km length and a ∼10–30 km width (Figures 3A,B). The Guman fold creates a smooth topographic step, ∼300 m above the Tarim Basin (Figure 3C). The Plio-Pleistocene strata are exposed along major transverse valleys and dip ∼3–5° to the north (Figure 3B). Many bending moment fault scarps, a type of secondary fault related to folding, are present along the fold (Figure 3B; Pan et al., 2007; Li et al., 2016; Li et al., 2018). However, this region remains nearly aseismic, except for seismicity along the AltynTagh-Karakax strike-slip fault. The region did host three earthquakes (Mw 5.5–6) along the mountain front: two in the 1950s and the 2015 Pishan M 6.4 earthquake (Figure 2A; Li et al., 2015; Li et al., 2016; Guilbaud et al., 2017). Recent GPS data show no significant gradients across the mountain front (Figure 2C; Zheng et al., 2017). GPS data to the north and south of the Guman fold shows constant northward velocity (Figure 3B; Zheng et al., 2017). However, Figure 2C1 shows that the average GPS velocity to the south is clearly higher than the two GPS velocities north of the Mazatagh in the center of the Tarim Basin: 1.43 ± 0.65 mm/yr and 5.48 ± 1.49 mm/yr, respectively.
Methods
The topographic profiles of fluvial terraces across a fold are indicative of the fold’s growth mechanism and evolution. From free Google satellite images and 12.5 m ALOS digital elevation model (DEM) data, we mapped river terraces across the fold in the Kuoshtagh River and the Pixina Valley. We used differential GPS to measure topographic profiles along several terraces and the modern riverbed. We extracted the topographic profiles of two terraces from the ALOS DEM. The differential GPS and ALOS DEM show a mean elevation difference of 0.6 ± 1.6 m (Figure 4, inset).
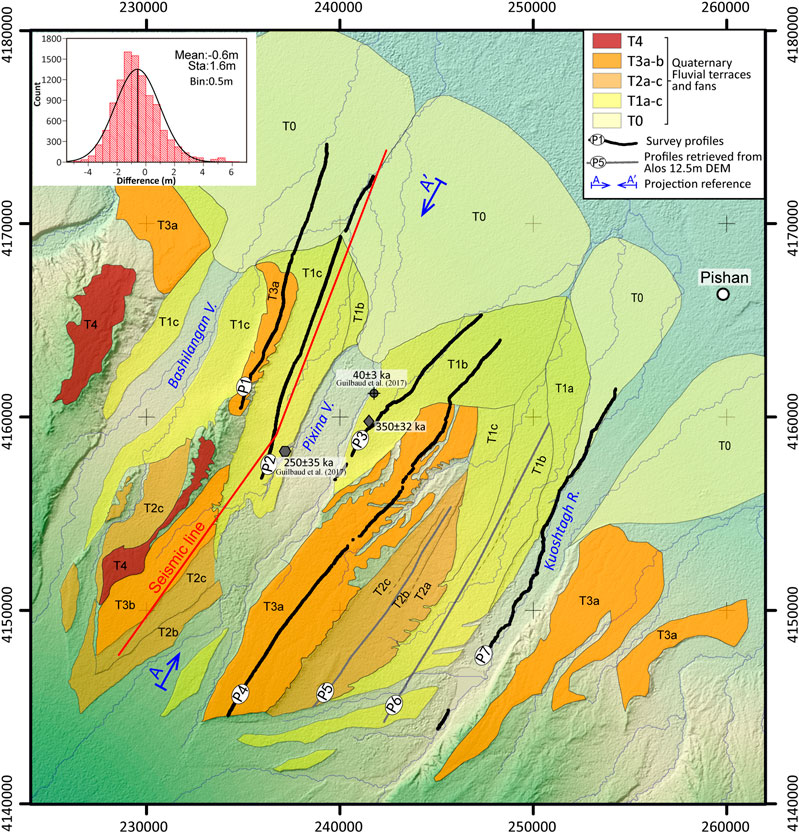
FIGURE 4. Morphological map showing terrace treads and survey lines at the Guman fold in Universal Transverse Mercator (UTM) zone 44. See Figure 3B for the map location. The gray solid pentagon shows a cosmogenic 10Be dating depth profile on the T1c west bank of the Pixina valley collected by Guilbaudet al. (2017). The gray solid diamond shows a surface 10Be sample collected on the T1b east bank of the Pixina valley. Transect A–A′ is the reference line of NE 29°. The red line shows the seismic profile with NE 21.1° and NE 35.6° segments. Shaded relief map is from the 12.5 m ALOS DEM. The inset shows the elevation difference between the differential GPS and the ALOS 12.5 m DEM.
To establish the geometric and kinematic model for the Guman fold from the terrace and the seismic profiles, we projected the terrace elevations and the seismic profile to a reference plane perpendicular to the strike of the fold axis. From the terrace deformation analysis, we constrained the fold’s growth mechanism. Together with the subsurface fold structures and the underlying thrust fault shown in the high-resolution seismic profile, we distinguish between a type 2 fault-bend fold and a wedge-thrust fold. The fault ramp dip under the fold is from previous research and the seismic profile used in this study.
To extract the contribution of structure to terrain from terrace longitudinal sections, it is necessary to correct for the base level, river gradient and sinuosity changes (e.g., Lavé and Avouac, 2000; Simoes et al., 2007; Simoes et al., 2014; Yue et al., 2011; Saint-Carlier et al., 2016). After removing the initial slope from the terrace profiles, the remaining elevation change reflects structural deformation after terrace abandonment. Coupled with terrace exposure ages, we quantify the fold’s shortening rate and the slip rate along the fault ramp. We discuss the tectonic significance of fold’s deformation in front of the Western Kunlun Mountain.
To calculate the deformation rate of the Guman fold, we use a Monte Carlo simulation to generate a synthetic distribution of deformation rates and then determined the most probable value for the deformation rate (e.g., Thompson et al., 2002; Davis et al., 2005; Amos et al., 2007; Rood et al., 2011). In the Monte Carlo simulation, each input parameter is assigned a probability density function (normally distributed or uniform).
River Terraces Division and Ages
The Keliyang River originates in the Western Kunlun Mountains, cuts through the Guman Fold, and forms the Bashlangan and Pixina wind gaps as well as the Kuoshtagh water gap (Figure 4). Along these valleys, ongoing folding has uplifted flights of fluvial terraces above the modern riverbed. It is challenging to confidently correlate these terraces due to their numerous levels and similar geomorphic characteristics. We merged neighboring terraces with little vertical separation and similar geomorphic characteristics into a single level, similar to the scheme used by Li et al. (2018).
Terrace Delineation
We divided geomorphologic surfaces into four major terrace groups (T4–T1) from the highest terrace to the lowest and one fan stage (T0) using field observations, geomorphic mapping and dating (Figure 4). Terraces T3, T2, and T1 can be divided into several sublevels (Figure 4). Table 1 compares our terrace division with previous work (Ainscoe et al., 2017; Guilbaud et al., 2017; Li et al., 2018). We found that the Kuoshtag channel is systematically lower (by up to ∼30–60 m) than the Pixina channel. As proposed by Guilbaud et al. (2017), the Guman fold is likely a relict of a former wide alluvial fan that deposited at the Keliyang River outlet along the mountain front. Therefore, the corresponding terraces have different heights above the river bed in different valleys.
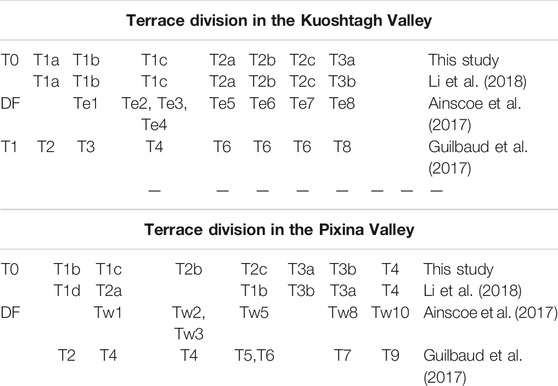
TABLE 1. Comparison of terrace divisions between this study and previous work at the Guman fold.
The T4 terrace is the highest terrace in the study area and locally remains on the west bank of the Pixina and Bashlangan Valley. It is ∼160 m above the Pixina river and ∼210 m above the Kuoshtag river (Supplementary Figure S1).
The T3 terraces are strath terraces, located on both banks of the Pixina Valley with ∼90–110 m above the Pixina river and ∼170 m above the Kuoshtag river (Supplementary Figure S1). The strath is composed of interbedded pebble layers, grayish green coarse sand stone and light yellow fine sandy clay stone and is exposed on the east bank of the Pixina valley (Supplementary Figure S1B). The bending-moment fault scarps on the T3a terrace on both banks of the Pixina valley. Both have heights of 1.1–18.2 m (Li et al., 2018). The T3a terrace on the east bank of the Pixina valley is preserved continuously across the Guman fold (Figure 4).
The T2 terraces are mainly distributed along the west bank of the Kuoshtag valley and locally preserved on southwest bank of the Pixina valley (Supplementary Figure S1). The T2 terrace on the west bank of the Kuoshtagh Valley has three sublevels located ∼80–100 m above the Kuoshtag river (Supplementary Figures S1F,G; T2a, T2b, and T2c). In the south of the Kuoshtagh Valley, the sublevels merge.
The T1 terraces are mainly on the west bank of the Kuoshtagh valley located ∼15–45 m above the Kuoshtag river (Supplementary Figures S1F,G; T1a, T1b, and T1c) and on both banks of the Pixina Valley located ∼35–40 m above the Pixina river (Supplementary Figures S1F,G; T1b and T1c). These terraces can be divided into three sublevels based on minor height variations. The terrace surfaces are relatively broad and continuous. T1’s strath is on the both banks of the Pixina valley (Supplementary Figures S1C,D) and the west bank of the Kuoshtagh river (Supplementary Figure S1E). The strath is composed of lightly-colored Pliocene silt and sand. Numerous fault scarps on the northern section of terrace have heights of ∼0.3–4.8 m (Li et al., 2018). PetroChina’s seismic profile crosses the fold along the T1c terrace west of the Pixina valley (Figure 4). Our topographic survey line crosses the fold along the same terrace and intersects with the seismic profile (Figure 4). The terrace exposure age was determined from 10Be dating (Figure 4; Guilbaud et al., 2017). This age can be used to calculate deformation rates of the fold and along the fault ramp since terrace abandonment.
Alluvial fans (T0) are located at the outlet of each valley on the north side of the Guman fold with typical fan shapes (Figure 4), indicating that sediment carried by the rivers immediately spreads around and accumulates after leaving out of the anticline, and that local river erosion datum is on the north side of the anticline.
Age of Terrace Abandonment
The age of terrace abandonment is critical for calculating the deformation rate. Guilbaud et al. (2017) determined the T1c exposure age on the west bank of the Pixina valley to be 250 ± 35 ka from in sit produced cosmogenic isotopes (10Be) (Figure 4; Guilbaud et al., 2017). For the terrace T1b east bank of Pixina valley, Guilbaud et al. (2017) collected one OSL sample along the terrace edge with a depth of 4.0 m from the terrace surface and yielded an age of 40 ± 3 ka (Figure 4). We collected one surface pebble sample (PST2-0) to update the age. Details of field sampling, preparation, measurement, and age calculation are in the Supplementary Material. Using the CRONUS Earth 3.0 calculator (Balco et al., 2008), we calculate the T1b terrace age on the east bank of Pixina valley to be 350 ± 32 ka (Figure 4; Table 2). This is corrected by the 10Be inheritance determined by Guilbaud et al. (2017). This age is consistent with our terrace division scheme: the two lower levels of both banks of Pixina valley belong to the same terrace group and the 7 m height variation is significantly less than the 30–50 m variation in the major levels (Supplementary Figure S1).
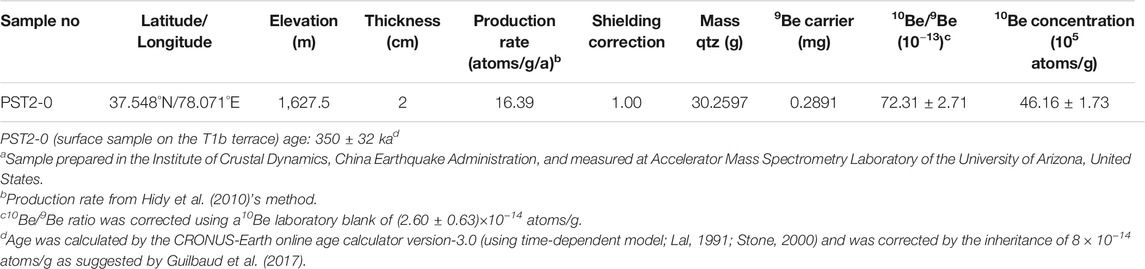
TABLE 2. Cosmogenic 10Be data and ages of the T1b terrace at the Guman fold.a
Construction of Fold Kinematic Model
Terrace surfaces are useful geomorphic markers in analyzing the kinematics of active structures. If their initial state is known, the terraces are indicative of folding and faulting kinematics over tens to hundreds of kilo years, often over several seismic cycles (Lavé and Avouac, 2000).
Terrace Survey
We use two methods to obtain terrace elevation profiles: Field-based differential GPS and extraction from high-resolution DEMs. Survey lines are often in the middle of terraces, kept as straight lines, and avoid modified terrace surfaces (Figure 4). During fieldwork, the river flow was intercepted upstream by a reservoir, so we could directly measure the exposed modern riverbed. We extract elevation profiles of two terraces from the ALOS 12.5 m DEM. To evaluate the DEM accuracy, we put the differential GPS and the ALOS 12.5 m DEM in the same coordinate system. Our reference section (p1) crosses the complex and flat terrain of the high and low terrace, respectively. We calculate the elevation differences between the differential GPS and the ALOS 12.5 m DEM at the same points. The elevation differences form a normal distribution with a −0.6 m mean and a 1.6 m standard deviation (Figure 4, inset). The average difference reflects a change of a datum and does not alter our results.
Deformation Characteristics of Terraces
We project the terrace profiles to a reference line perpendicular to the fold axis (Figure 4). Stress concentration in the folding process leads to numerous bending moment faults in the Guman fold (Li et al., 2018). The strike of bending moment faults above a fold generally represents the direction of fold axis (Philip and Meghraoui, 1983; Li et al., 2018). In the study area, the average strike of the bending moment faults is 299° (Figure 3B, inset). On the north side of the Guman fold, rivers exit the fold zone and the valley suddenly narrow, likely due to fold uplift driving enhanced incision at the anticline axis. Similar patterns are seen in the Bashlangan, Pixina and Kuoshtagh Rivers. The connecting trend of these narrowing positions is ∼302° (Figure 4). These findings support a fold axis of ∼299–302°. We choose 029° (perpendicular to fold axis) as the projection reference line, similar to Guilaud et al. (2017). The reference line begins near the fold’s south side (Figure 4).
From the projected terrace elevation profiles, the deformation pattern of the terraces forms a simple step (Figure 5A). From km 0–18 (see coordinate system in Figure 5A), the terraces have surface slopes of 0.74–0.97°. Among them, the T3a and T2b terraces are deformed slightly from km 5–10, possibly due to minor bending of the underlying fault ramp or secondary faulting of the thrust sheet. After km 18, the surfaces tilt steeply northward, and the degree of tilting increases with terrace age. After km 25, the terraces and modern river beds meet on undeformed alluvial fans (T0) (Figure 5A). The seismic reflection profile shows that up to dozen kilometers of terraces above the fault ramp are parallel with each other (Figures 5A,B), indicating that the Guman fold grows by kink-band migration.
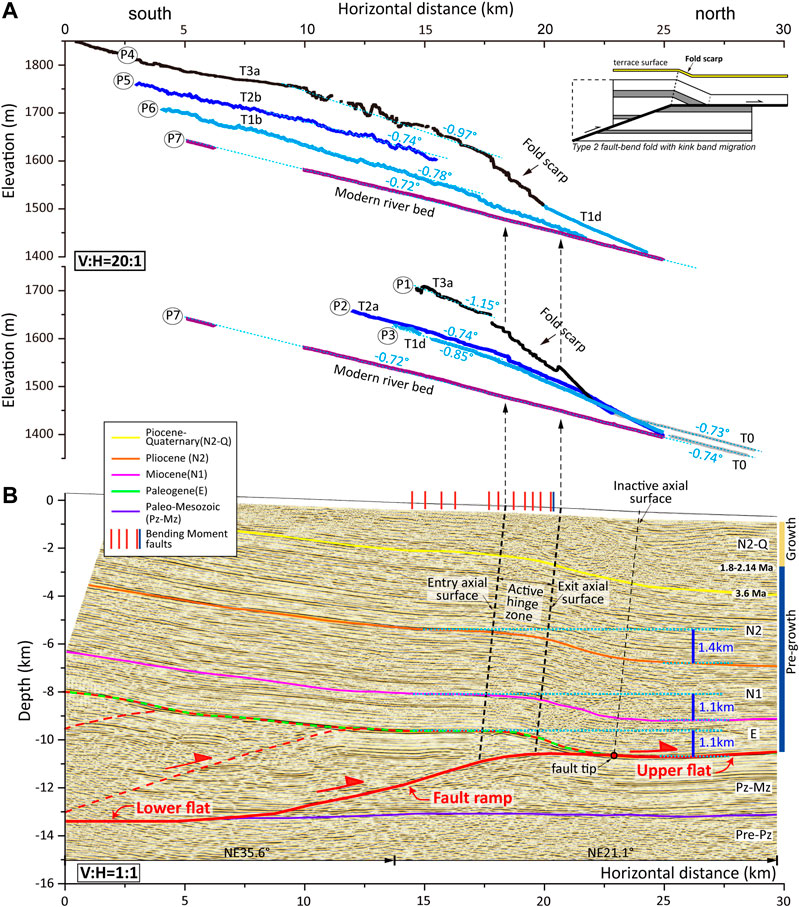
FIGURE 5. (A) Six terrace profiles and the modern Kuoshtagh river profile with 20× vertical exaggeration. All profiles are projected to the NE 29° reference line. The terrace surfaces above the underlying fault ramp are subparallel, consistent with a fault-bend fold that grows by kink-band migration. (B) Interpreted seismic reflection profile based mainly on the results from Lu et al. (2016) and Li et al. (2016). The underlying fault has a lower flat-ramp-upper flat geometry. The axial surface terminology is from Lu et al. (2016). The entry and exit axial surfaces define the hinge zone across the fault bend at the upper end of the fault ramp.
Fold and Fault Structure Inferred From the High Resolution Seismic Profile
Our seismic reflection profile interpretation mainly derives from Lu et al. (2016) and Li et al. (2016). The seismic profile shows that fold has a north-vergent geometry, a steeper (∼12–14°N) and narrow northern limb and a nearly horizontal (∼2–5°S) and broader southern limb (Figure 5B). The blind thrust fault shows a simple step shape. The seismic reflection layers are offset across the fault ramp, and there is no clear decrease of offset along the ramp (Lu et al., 2016; Ainscoe et al., 2017), so we infer that the fold is a fault-bend or wedged-thrust fold but not a fault-propagation fold.
The position of active axial surfaces relative to the geometry of the fold’s front limb can be used to distinguish type 2 fault-bend folds from wedge-thrust folds (e.g., Ishiyama et al., 2004; Ishiyama et al., 2007). We align the seismic profile with the projected terrace survey profiles using the intersection of survey line P2 and the seismic profile (Figure 5). We did not project the seismic profile to the reference section because their angle is 8°, and the projection would ony shorten the seismic profile by ∼170 m. This shortening is small and would not affect our results. The terrace deformation mimics the deformation of the underlying strata (Figure 5). The strongest deformation of the terrace surfaces, the location of fold scarps, is at 18–23 km section, which corresponds to the position on the seismic profile turning from fault ramp to upper flat (Figure 5). The terraces deform at the anticline hinge zone (Figure 5), not at the fault tip. This indicates that the anticlinal axis of fold is active, while the axial surface of fault tip is not. This supports that the Guman fold deformation is related to a type 2 fault-bend fold model (Figure 5, inset).
Constructing a Fold Kinematic Model
Based on the above discussion, the Guman fold is a type 2 fault-bend fold that grows by kink-band migration. However, we have not yet constrained the dip of the underlying fault ramp. For the seismic reflection profile, Li et al. (2016) estimated a ramp dip of 10–14° by assuming a uniform seismic velocity model of 3,000 m/s. Ainscoe et al. (2017) believe that this underestimates the velocity of the Pre-Cenozoic sediments and updated the profile by assuming 3,000 m/s and 5,000 m/s for the Cenozoic and Pre-Cenozoic units, respectively. They update the fault ramp dip to 16–20°. Lu et al. (2016) incorporate drill data and conclude that the fault ramp dips 20°. The Pishan mainshock fault parameters from earthquake catalogs, body wave modeling and a uniform Interferometric Synthetic Aperture Radar (InSAR) slip inversion (He et al., 2016; Wen et al., 2016; Ainscoe et al., 2017) indicate a dip of 20°–24°. Based on these results, we use a fault ramp of 20 ± 4°.
Blind Fault Slip Rate and Guman Fold Shortening Rate
Method
Given that fault-bend folds (Suppe, 1983) grow by kink-band migration, the structural uplift (h) is proportional to the sine of the fault ramp dip angle (θ) and to the horizontal shortening (S) along lower fault flat (Figure 6; Lavé and Avouac, 2000; Yue et al., 2011).
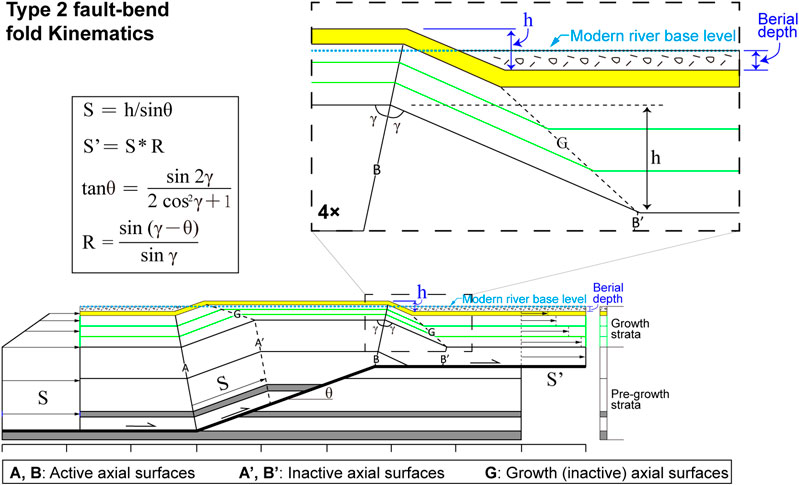
FIGURE 6. Kinematic model of type 2 fault-bend fold that grows by kink-band migration. The back limb dips are parallel to the fault ramp, with a limb length equal to the fault slip S. Slip is not preserved across the fault bend, because the deformation is consumed by the fold (S’ < S). S, slip or slip rate along the lower fault flat or fault ramp; S’, slip or slip rate along the upper fault flat; R, slip ratio; γ, axial angle; θ, fault ramp dip. Numerical relationships are from Suppe (1983).
Pre-growth strata have the same horizontal shortening, while the horizontal shortening of the growth strata (terrace surfaces) decreases with decreasing deposition age (terrace abandonment) (e.g., Suppe et al., 1992; Shaw and Suppe, 1994). If the ages of the growth strata (terrace abandonment) or the initiation age of deformation of a fold are known, the shortening rates can be calculated (e.g., Shaw and Suppe, 1994).
For type 2 fault-bend folds, hanging wall motion is parallel to the adjacent fault segments (Figure 6; Suppe, 1983; Yue et al., 2011). The fault slip (S) along the ramp is the same along the lower fault flat, but the slip along the upper fault flat (S′) decreases because fault slip is consumed by anticlinal folding of the thrust sheets (Figure 6). Simplifying Suppe (1983)’s equations shows the relationship between fault slip on both sides of the anticlinal bend (Figure 6).
The slip ratio is R = sin (γ−θ)/sinγ. The relationship between the axial angle (γ) and the fault ramp dip (θ) is tanθ = sin 2γ/sin (2cos2γ+1). This formula can also be applied to growth strata and terraces (Le Béon et al., 2014).
Terrace Deformation
To compute the slip along the underlying fault ramp, we need to translate river relative incision revealed by terraces into incremental uplift. This needs corrections for base level, river gradient and sinuosity changes and to remove initial topographic gradients (Lavé and Avouac, 2000).
From the terrace morphology, there is no strong evidence for river sinuosity changes during the terrace formation and incision. The terraces remain approximately parallel to present riverbed (aside from the deformed portions; Figure 4). The incision profiles across the fold (Figures 5A, 7) have no strong residual baseline slopes that could indicate river gradient changes. Therefore, we make no corrections for changes in river sinuosity or gradient. It is still necessary to correct for erosion base level changes, due to sedimentation out of the fold, and for our case, north of the anticline. The deposits carried by the river immediately spread and accumulate into alluvial fans to the north of the anticline. The terraces converge and alluvial fans are at similar elevations to the current riverbed, which represents the local erosion base level. There are no previous constraints on the sedimentation rate in this area at the timescale of the uplifted terraces. We calculate the deposition rate from the youngest stratigraphy on the north side of the anticline based on the seismic reflection profile. The unit is 2.5 ± 0.2 km thick and its deposition began 3.6 Ma (Figure 5B; Li et al., 2018). Thus, the deposition rate is 0.69 ± 0.05 mm/yr. This value is consistent with the 0.5–1.0 mm/yr rate from other researchers in the Tarim Basin (Métivier and Gaudemer, 1997; Zheng et al., 2000; Jiang and Li, 2014). However, the rate is larger than 0.4 mm/yr from Guilaud et al. (2017) at the Guman fold. See the discussion for more detail. Further considering the uncertainty of the value, we use a 0.6–0.8 mm/yr deposition rate on the north side of the anticline.
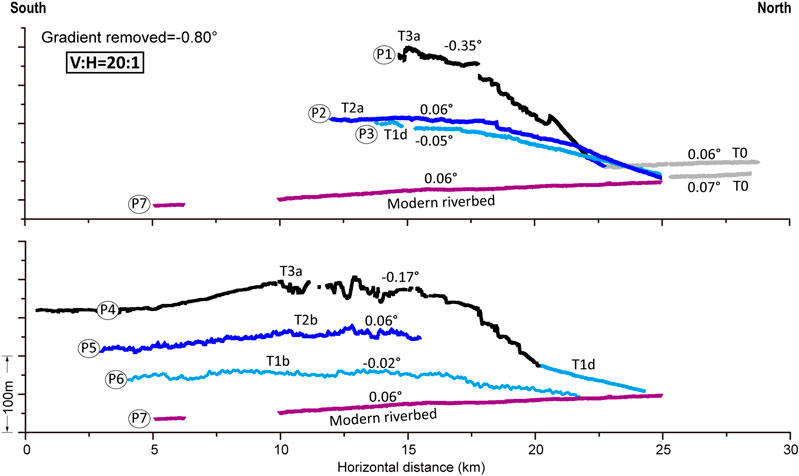
FIGURE 7. Terrace profiles from Figure 5A after removing a 0.8° gradient. The residual slopes are less than 0.07°, suggesting that these profiles can be used to evaluate the tectonic uplift of the terraces.
As mentioned earlier, the terrace slopes are about 0.8 ± 0.1°, roughly consistent with the current riverbed slope (Figure 7), so we think that this slope represents the initial terrace state. This is also consistent with the ∼0.70–0.95° terrace gradient from Ainscoe et al. (2017). After removing this gradient, the residual terrace slopes are less than 0.07° and remaining elevation changes on individual terraces can be used to evaluate tectonic uplift of the terraces (Figure 7).
Fault Slip and Fold Shortening Rate From Terrace Deformation
We use a Monte Carlo simulation to calculate the slip and fold shortening rate (e.g., Thompson et al., 2002; Davis et al., 2005; Amos et al., 2007; Rood et al., 2011). This approach accounts for age, surface roughness, ramp dip, and deposition rate uncertainty. We use Oracle Crystal Ball, a worksheet-based software package designed for predictive modeling.
In the Monte Carlo simulations, each input is assigned a probability density function (PDF) that describes the variable uncertainty (Figure 8B; e.g., Thompson et al., 2002; Davis et al., 2005; Amos et al., 2007; Rood et al., 2011). The offset is estimated using a least-squares linear regression fit to the topographic survey points. The regression assumes a normal distribution. Surface age is given by a normal distribution with an average and standard deviation (250 ± 35 ka). A normal distribution is also used to estimate the error of the fault ramp dip (20 ± 4°). We use a boxcar PDF of the deposition rate of 0.6–0.8 mm/yr. These values define the mode and one standard confidence interval for slip and slip rate with 5,000 trial runs (Figure 8C).
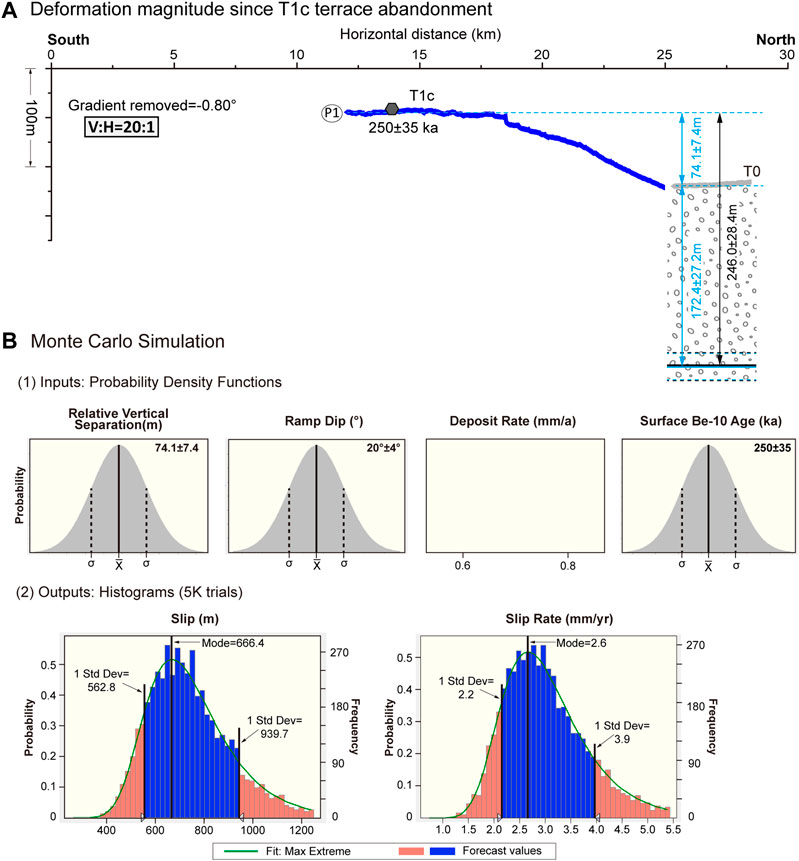
FIGURE 8. Diagram depicting slip magnitude and rate calculations along the blind fault ramp under the Guman fold (A) The P2 survey line on the T1c terrace west of Pixina valley. Tectonic uplift along the underlying fault ramp is equal to the relative uplift measured from the survey after correcting for deposition thickness. The 250 ± 35 ka exposure age was determined by Guilbaud et al. (2017) using cosmogenic 10Be depth profile dating. (B) Relative vertical separation, fault ramp dip, terrace age and deposition are combined in a Monte Carlo simulation to estimate the slip magnitude and rate along the underlying fault ramp.
For the T1c terrace on the west bank of the Pixina River (Figure 8A), the part above the fault ramp is 74.1 m higher than base level. Given the surface roughness, we assign a 10% uncertainty to the elevation difference. Since the abandonment of the surface at 250 ± 35 ka, the deposition thickness on north side of the fold or equivalently the base level rise is 173.1 ± 26.7 m. Using this base level rise to correct for the incision of terrace T1c, the tectonic uplift of terrace T1c above the fault ramp is 246.0 ± 28.4 m (Figure 8A). We calculate a slip of 666.4+273.3/−103.6 m and a slip rate of 2.6+1.3/−0.4 mm/yr along the underlying fault ramp since the terrace abandonment (Figure 8B). For the lower flat-ramp-upper flat fault-bend fold with a 20° fault ramp dip, according to the fault-bend fold theory (Suppe, 1983), 87% of slip continues to pass forward along the upper fault flat and only 13% is absorbed by the fold above the fault ramp. Therefore, the shortening rate of Guman fold is 0.34+0.18/−0.06 mm/yr, while the slip rate along the upper fault flat is 2.3+1.1/−0.4 mm/yr.
Long-Term Fault Slip Rate From Pre-growth Strata
Combining the uplift of pre-growth strata across the underlying fault ramp and the fold’s deformation initiation age yields a long-term slip rate along the fault ramp. We estimate the initiation age of deformation for the Guman fold from the seismic profile and previous researches. At shallow depth, the Plio-Pleistocene strata thin southward from ∼3.0 km north of the fold to 1.5–1.6 km above the fold’s crest (Figure 5B; Lu et al., 2016; Ainscoe et al., 2017). The strata gradually thins to less than 500 m in front of the mountain (Figure 5B; Lu et al., 2016; Lu et al., 2016). The Pliocene and Pre-Pliocene strata have constant thickness across the fold. This suggests that the Plio-Pleistocene strata are growth strata, and that deformation of Guman fold initiated during the Plio-Pleistocene (Figure 5B; Guilbaud et al., 2017; Li et al., 2018). Based on seismic reflection profile, stratigraphic correlation and magnetostratigraphy results (Zheng et al., 2000), previous research suggested that the Guman fold’s deformation initiated at ∼2.14–1.8 Ma (Liu et al., 2004; Wu et al., 2004). This age is younger than the starting depositional age of 3.6 Ma suggested by Li et al. (2016, 2018) for the first unit due to growth strata being in upper half of the unit (Figure 5B; Guilbaud et al., 2017). The initiation age is consistent with that the frontal thrust ramp of the Guman fold initiated by ∼2–3 Ma (Guilbaud et al., 2017). The vertical structural throw is 1.1–1.4 km due to uplift of the pre-growth strata across the underlying anticlinal fault bend (Figure 5B). The slip along the fault ramp is 3.4+1.2/−0.5 km given the fault dip of ∼20°. This is consistent with ∼2.0–4.3 km of slip in previous studies (Li et al., 2016; Li et al., 2018; Lu et al., 2016). Finally, two boxcar PDFs are used to describe the uplift magnitudes and the deformation initiation age in the Monte Carlo simulations which yield a long-term slip rate of 1.7+0.6/−0.2 mm/yr along the fault ramp (Figure 9). This rate is lower than the short-term slip rate from terrace T1c, possibly because some deformation was absorbed by the imbricate structure during the formation of the leading ramp.
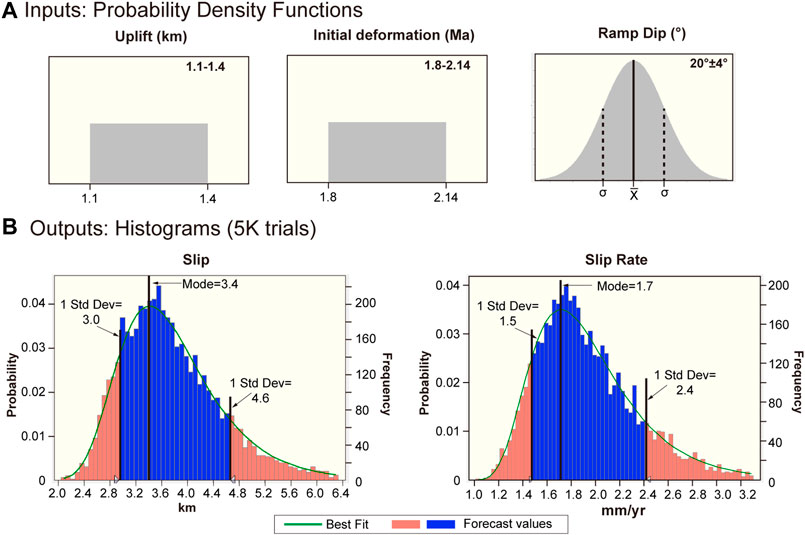
FIGURE 9. Long-term fault slip rate determined from pre-growth strata uplift and the initiation age of deformation of the Guman Fold. Two uniform PDFs were assigned for the uplift and the initiation age. The other parameter and the format of output results are the same as those in Figure 8.
Discussions
Parameter Uncertainty
We used deformed terraces and a high-resolution seismic reflection profile to establish the kinematic model of the Guman fold. Furthermore, the Monte Carlo simulation is used to account for input parameter uncertainty. However, interpretation of the seismic reflection profile, deposition rate and terrace age are still the key points to build kinematic model and calculate slip or slip rates.
Our seismic profile interpretation is based on previous work (Li et al., 2016; Lu et al., 2016; Ainscoe et al., 2017). The stratigraphic boundary was divided at the rough same location, but the profile depth was different due to the assumed velocity models. Li et al. (2016) assumed a 3,000 m/s uniform velocity model that may underestimate the thickness of shallow strata (Ainscoe et al., 2017). Lu et al. (2016) interpreted the seismic reflection profile by incorporating drilling data from adjacent area, and the fault ramp is 10–13 km deep which is in good agreement with that suggested by Ainscoe et al. (2017). The Pishan earthquake depth is 10–20 km from the focal mechanism solution (Lu et al., 2016) and 10–19 km from a joint inversion of P and SH waves (Ainscoe et al., 2017). Therefore, we mainly refer to the seismic reflection profile interpreted by Lu et al. (2016). In addition, the intersection of the seismic reflection profile with the terrace elevation section (P2) ensures alignment accuracy.
Incremental uplift is estimated from terrace deformation across the fold by correcting for sedimentation at the river base level. Guilbaud et al. (2017) found a 0.4 mm/yr deposition rate by assuming a 2 km formation thickness and a 5 Ma initial deposition age of Pliocene-Quaternary unit. Despite a 50% uncertainty assigned to this value, 0.2–0.6 mm/yr deposition rate is still significantly lower than the 0.5–1.0 mm/yr rate from other researchers (Métivier and Gaudemer, 1997; Zheng et al., 2000; Jiang and Li, 2014). Guilbaud et al. (2017) estimated the deposition rate using the seismic reflection profile interpretation from Li et al. (2016) who may underestimate the formation thickness (Ainscoe et al., 2017). In addition, based on stratigraphic correlation in a nearby magnetostratigraphy study, Li et al. (2016, 2018) suggest that the deposition of the Pliocene-Quaternary unit started at ∼3.6 Ma, younger than 5 Ma (Guilbaud et al., 2017). Our 0.6–0.8 mm/yr rate is consistent not only with studies of previous sedimentation rates (Métivier and Gaudemer, 1997; Zheng et al., 2000; Jiang and Li, 2014), but also with the studies of sedimentology (Sun and Liu, 2006; Jiang and Li, 2014). After the late Miocene, the sedimentary environment in front of the Western Kunlun Mountains changed from a relatively calm river and lake to a higher-energy depositional Piedmont alluvial fan environment (Sun and Liu, 2006; Jiang and Li, 2014). According to our deposition rate, 172.4 ± 27.2 m of sediment was deposited since the T1c terrace abandonment (250 ± 35 ka). This correction for sedimentation accounts for 68+17/−11% of the 246.0 ± 28.4 m structural uplift of the terrace. The sedimentation greatly diminishes the impact of tectonic uplift on the fold, so the amplitude of the anticline is less obvious on the ground. Another reason is that the 20° fault ramp dip theoretically can cause only about 1/3 slip to translate into uplift. When using the sedimentation rate of 0.2–0.6 mm/yr proposed by Guilbaud et al. (2017), slip and slip rate would decrease by 1/3 and 1/4, respectively.
Our slip rate also depends on terrace ages which impact the calculated sedimentation and uplift rates. On terrace T1b east of Pixina valley, our exposure age is 350 ± 32 ka. Guilbaud et al. (2017) sampled a 5 m depth profile along the eastern bank of a wide post-depositional channel incising about 10 m into the terrace T1c and indicated an exposure age of 255 ± 35 ka with taking the erosion rate of 1 mm/yr. This age is less than our corresponding age, probably due to gully erosion of the original geomorphologic surface. Erosion is the main limiting factor for exposure ages, especially for an older terrace. Adding 25 cm of erosion to Guilbaud et al. (2017)’s calculation would roughly yield our result. However, when using a terrace age of 350 ± 32 ka, the slip would increase by 30% and the slip rate would only decrease by 5%, because the sediment correction increases with increasing age. The slip rate from the terrace age of 250 ± 35 ka represents the maximum value since terrace abandonment. This value is greatly impacted by the deposition rate and less by the terrace age. Nevertheless, more data are needed to clarify the terrace ages in the study area.
Comparing Our Results to Existing Research Results
Our analysis of terraces and pre-growth strata suggest a slip rate of 2.6+1.3/−0.4 mm/yr since terrace abandonment (250 ± 35 ka) and 1.7+0.6/−0.2 mm/yr since the early Pleistocene (2.14–1.8 Ma). Over a long time scale, our findings are consistent with other studies. Jiang et al. (2013) estimated crustal shortening of 54 and 24.6 km from a balanced cross-section of seismic reflection profile located 60 and 160 km, respectively, east of the study area (Figure 10). Cheng et al. (2017) estimated 34 ± 6 km of crustal shortening using the same seismic reflection profile as Jiang et al. (2013) 160 km east of the study area (Figure 10). Within this, 4 ± 2 and 23 ± 1 km of the shortening was absorbed by the Hotan anticline and Hotan detachment fault, respectively. Seismic reflection, well data, apatite fission track thermochronology, growth strata analysis and balanced cross sections indicate an initiation of thrusting in the Western Kunlun Mountains in the Early Miocene, ca. 23 Ma (Jiang et al., 2013; Jiang and Li, 2014; Cheng et al., 2017). Combined with the above shortenings and the initiation age of the early Miocene, a long-term crustal shortening rate is ∼2.3 mm/yr 60 km east of our study area (Figure 10), similar to our 2.6+1.3/−0.4 mm/yr rate since ca. 250 ka. At 160 km east of our study area, the long-term crustal shortening rate of ∼1.0 mm/yr or ∼1.5 mm/yr is lower than our results (Figure 10). This difference may reflect lateral variation of shortening rate or eastward weakening of tectonic deformation. The ratio of anticline shortening (4 ± 2 km) to slip along the upper fault flat (23 ± 1 km) is ∼1:6, consistent with our findings that only 13% of the slip is absorbed by the Guman fold, and 87% continues to pass forward along upper fault flat. Based on the seismic profile and the initiation age of deformation, Li et al. (2016, 2018) suggested that the minimum average slip rates along the fault ramp is 0.8–1.2 mm/yr (Figure 10). This is consistent with our findings from pre-growth strata, even though on the lower range.
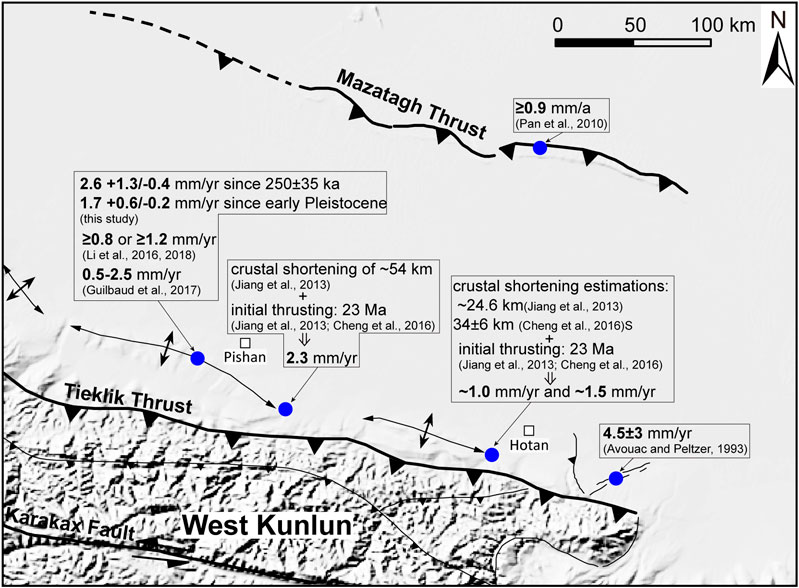
FIGURE 10. Crustal shortening rate and slip rate studies in front of the Western Kunlun Mountain and Mazatagh Thrust.
In this research area, other evaluations of the deformation rates remain somewhat controversial due to interpretive models selection and uncertainties in the subsurface geometry. Guilbaud et al. (2017) extracted terrace elevation data from 20 m resolution SPOT and 30 m resolution SRTM DEMs over the terrace surfaces, and showed a fault ramp slip rate of 0.5–2.5 mm/yr based on excess-area conservation (Figure 10). The slip rate ranges widely and the excess-area conservation method may not be suitable for the Guman fold which is a type 2 fault-bend fold supported by our study and previous studies (Liang et al., 2012; Lu et al., 2016; Cheng et al., 2017; Guilbaud et al., 2017; Li et al., 2018). Avouac and Peltzer (1993) interpreted normal fault throw near Hotan (160 km east of our study area) as representative of the flexural subsidence of the Tarim Basin due to the over thrusting range. They estimated a minimum crustal shortening rate of 4.5 ± 3 mm/yr over the last ∼17 ka across the Western Kunlun (Figure 10). This value is greater than our results but must be considered with caution because Li et al. (2018) showed that the faults are bending-moment faults formed by tension above the anticline.
Based on fault-bend fold theory, the Guman fold shortening rate is 0.34+0.18/−0.06 mm/yr, consistent with the low strain of GPS sites north and south of the fold (Li et al., 2016). Researches show that the decadal geodetic rates based on GPS velocity profiles across faults are consistent with inferred long-term geological rates, because most of the elastic deformation takes place within the near-fault zone associated with locking depth (e.g., Savage and Burford, 1970; Meade and Hager, 2005; Zhang et al., 2007). Therefore, two GPS profiles span distances of at least 150 km on both sides of the Guman fold show no significant gradients, which may reflect structural deformation in the study area. Our result is also in the same order of magnitude as Pan (2008) who estimated the horizontal shortening rate of the Guman fold from area-balance theory (Epard and Groshong, 1993). From topographic profile, the height and width of the fold are 450 m and 20 km, respectively. Using a 14 km detachment depth (Xiao, 1996), the Guman fold has accommodated 300 m of shortening (Pan, 2008). Given initiation in the early Pleistocene (2.14–1.8 Ma; Liu et al., 2004; Wu et al., 2004), Pan (2008) proposed that the minimum shortening rate of Guman Anticline is 0.14–0.17 mm/yr.
Significance of Structural Deformation
Based on interpretation of seismic reflection profiles, three models for tectonic deformation in front of the Western Kunlun Mountains have been developed: structural wedge (Li et al., 2016), fault-propagation (Jiang et al., 2013) and fault-bend fold (Liang et al., 2012; Lu et al., 2016; Cheng et al., 2017; Guilbaud et al., 2017; Li et al., 2018). The comprehensive analysis of terrace deformation and subsurface structure is critical for differentiating between these models (e.g., Ishiyama et al., 2004; Ishiyama et al., 2007; Stockmeyer et al., 2017). We conclude that the growth mechanism of the Guman fold is kink-band migration from terrace deformation. By comparing the fold scarps and the subsurface geometry of the fold, we determine that the Guman fold is a type 2 fault-bend fold. From subsurface geometry of the fold revealed by the seismic profile, the Guman fold is likely in an early development phase. The length of the blind ramp supports that the Guman fold is a wide and shallow anticline on the surface. In this phase, the crest elevates with increasing fault slip and the topographic relief is a response to competition between folding and sedimentation (e.g., Shaw et al., 2004). The fold width continues to narrow before the end of crestal uplift stage (Figure 11).
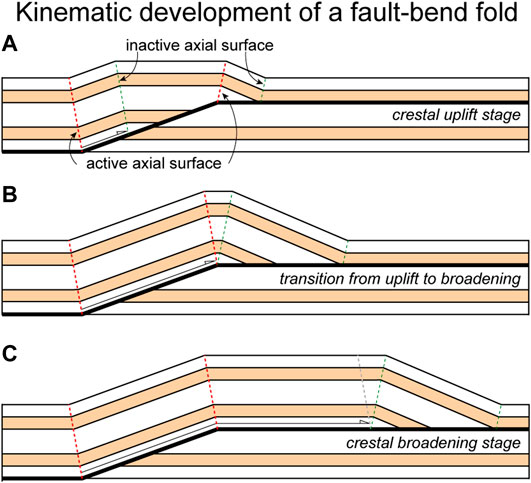
FIGURE 11. Kinematic development of a fault-bend fold (Suppe, 1983; Shaw et al., 2004). (A) The fold is in the crestal uplift stage of growth, as fault slip is less than the ramp width. (B) Transition to crestal broadening stage when uplift stops and widening begins. (C) The fold crest widens with fault slip after the fault slip is greater than ramp width.
For a type 2 fault-bend fold that grows by kink-band migration, most of the slip will continue to pass forward along the upper fault flat. In the front of the Western Kunlun Mountain, we estimate a slip rate of 2.3+1.1/−0.4 mm/yr along the upper fault flat. The interpreted seismic profiles indicate that a detachment fault located at base of the Cenozoic sequence could be linked to the exposed Mazatagh Thrust located 200 km away in the hinterland of the Tarim Basin (Lu et al., 2016; Li et al., 2018). Based on the Pliocene strata and balanced cross sections, Pan et al. (2010) estimate a minimum shortening rate of 0.9 mm/yr for the Mazatagh Thrust. Considering that the distance of more than 200 km could consume part of the shortening rate, we propose that these two rates may be related and support a view that most of the crustal shortening of the Western Kunlun Mountain is transferred basinward and ultimately absorbed by the Mazatagh Thrust. This thrust fault is analogous to the low angle thrust structure in front of the Himalayas (Guilbaud et al., 2017). Although the Western Kunlun’s shortening rate is an order of magnitude lower than the Himalayan’s, large earthquakes are still possible in this area (Guilbaud et al., 2017).
Conclusions
We use terrace deformation and a high-resolution seismic reflection profile to establish a kinematic model of the Guman fold according to fault-bend fold theory. The fold’s deformation is explained as a fault-bend fold with lower flat-ramp-upper flat geometry (called “type 2 fault-bend fold” in this paper) that grows by kink-band migration and the underlying fault ramp dips 20 ± 4° to the south. From the T1c terrace deformation and the age west bank of the Pixina valley, we quantify the slip rate along the underlying fault ramp to be 2.6+1.3/−0.4 mm/yr since 250 ± 35 ka. Based on uplift of pre-growth strata across the fault ramp and the early Pleistocene initiation of deformation (2.14–1.8 Ma), the long-term slip rate along the underlying fault ramp is 1.7 +0.6/−0.2 mm/yr. According to the fault-bend fold theory, fault slip is not conserved across the fault-bend. For a type 2 fault-bend fold with fault dip of 20°, 87% of the slip will continue to pass forward along the upper fault flat and 13% will be absorbed by the fold above the fault ramp. Therefore, the shortening rate accommodated by the Guman fold is 0.34+0.18/−0.06 mm/yr, while the slip rate along the upper fault flat is 2.3+1.1/−0.4 mm/yr since the T1c terrace abandonment. This result explains why the GPS sites across the fold record little strain. The understanding gained in this study tends to support the view that most of crustal shortening of the Western Kunlun Mountains is transferred basinward along a detachment and is ultimately absorbed by the Mazatagh Thrust located 200 km away in the hinterland of the Tarim Basin.
Data Availability Statement
The raw data supporting the conclusions of this article will be made available by the authors, without undue reservation.
Author Contributions
JX and JC initiated the study. JX designed the paper, carried out the rate calculations and interpretations and wrote the manuscript. JA provided helpful discussions and helped to improve the manuscript. Coauthors TL, BZ, ND, and WP helped to carried out filed work.
Funding
This research was supported by the National Natural Science Foundation of China (Grant Numbers: 41772221 and 41802229), the Second Tibetan Plateau Scientific Expedition and Research Program (STEP) (2019QZKK0901) and the State Key Lab. of Earthquake Dynamics of China (LED2016A05).
Conflict of Interest
The authors declare that the research was conducted in the absence of any commercial or financial relationships that could be construed as a potential conflict of interest.
The handling editor declared a past co-authorship with one of the authors [JC].
Acknowledgments
We thank Xiaoli Yang, Qi Liu, and Jun Liu for their help in the field.
Supplementary Material
The Supplementary Material for this article can be found online at: https://www.frontiersin.org/articles/10.3389/feart.2020.590043/full#supplementary-material
References
Ainscoe, E. A., Elliott, J. R., Copley, A., Craig, T. J., Li, T., Parsons, B. E., et al. (2017). Blind thrusting, surface folding, and the development of geological structure in theMw6.3 2015 pishan (China) earthquake. J. Geophys. Res. Solid Earth 122, 9359–9382. doi:10.1002/2017JB014268.
Allmendinger, R. W. (1998). Inverse and forward numerical modeling of trishear fault-propagation folds. Tectonics 17, 640–656. doi:10.1029/98tc01907.
Allmendinger, R. W., and Shaw, J. H. (2000). Estimation of fault propagation distance from fold shape: implications for earthquake hazard assessment. Geology 28, 1099–1102. doi:10.1130/0091-7613(2000)28<1099:EOFPDF>2.0.CO;2.
Amos, C. B., Burbank, D. W., Nobes, D. C., and Read, S. A. L. (2007). Geomorphic constraints on listric thrust faulting: implications for active deformation in the Mackenzie Basin, South Island, New Zealand. J. Geophys. Res. 112, B03S11. doi:10.1029/2006JB004291.
Avouac, J.-P., and Peltzer, G. (1993). Active tectonics in southern Xinjiang, China: analysis of terrace riser and normal fault scarp degradation along the Hotan-Qira fault system. J. Geophys. Res. 98, 21773–21807. doi:10.1029/93jb02172.
Balco, G., Stone, J. O., Lifton, N. A., and Dunai, T. J., (2008). A complete and easily accessible means of calculating surface exposure ages or erosion rates from 10Be and 26Al measurements. Quat. Geochronol. 3, 174–195. doi:10.1016/j.quageo.2007.12.001.
Bernard, S., Avouac, J.-P., Dominguez, S., and Simoes, M. (2007). Kinematics of fault-related folding derived from a sandbox experiment. J. Geophys. Res. 112, B03S12. doi:10.1029/2005JB004149.
Charreau, J., Saint-Carlier, D., Lavé, J., Dominguez, S., Blard, P.-H., Avouac, J.-P., et al. (2018). Late Pleistocene acceleration of deformation across the northern Tianshan piedmont (China) evidenced from the morpho-tectonic evolution of the Dushanzi anticline. Tectonophysics 730, 132–140. doi:10.1016/j.tecto.2018.02.016.
Chen, J., Scharer, K. M., Burbank, D. W., and Wang, C. (2005). Kinematic models of fluvial terraces over active folds: constraints on the growth mechanism and kinematics of the fault-related folds (in Chinese with English abstract). Seismol. Geol. 27, 513–529. doi:10.3969/j.issn.0253-4967.2005.04.001.
Chen, Y.-G., Lai, K.-Y., Lee, Y.-H., Suppe, J., Chen, W.-S., Lin, Y.-N. N., et al. (2007). Coseismic fold scarps and their kinematic behavior in the 1999 Chi-Chi earthquake Taiwan. J. Geophys. Res. 112, B03S02. doi:10. 1029/2006JB00438810.1029/2006jb004388.
Cheng, X., Chen, H., Lin, X., Wu, L., and Gong, J. (2017). Geometry and kinematic evolution of the Hotan-Tiklik segment of the western Kunlun thrust belt: constrained by structural analyses and apatite fission track thermochronology. J. Geol. 125, 65–82. doi:10.1086/689187.
Cheng, X., Lei, G., Chen, H., Du, Z., Liao, L., Luo, J., et al. (2011). Cenozoic structural deformation of the Fusha-Keliyang area in the piedmont of the western Kunlun Mountains and its control on hydrocarbon accumulation (in Chinese with English abstract). Acta Pet. Sin. 32, 83–89.
Daëron, M., Avouac, J.-P., and Charreau, J. (2007). Modeling the shortening history of a fault tip fold using structural and geomorphic records of deformation. J. Geophys. Res. 112, B03S13. doi:10.1029/2006JB004460.
Davis, K., Burbank, D. W., Fisher, D., Wallace, S., and Nobes, D. (2005). Thrust-fault growth and segment linkage in the active Ostler fault zone, New Zealand. J. Struct. Geol. 27, 1528–1546. doi:10.1016/j.jsg.2005.04.011.
Epard, J., and Groshong, R. (1993). Excess area and depth to detachment. Am. Assoc. Petrol. Geol. Bull. 77, 1291–1302. doi:10.1306/BDFF8E66-1718-11D7-8645000102C1865D.
Erslev, E. A. (1991). Trishear fault-propagation folding. Geology 19, 617–620. doi:10.1130/0091-7613(1991)019<0617:tfpf>2.3.co;2.
Gao, R., Huang, D., Lu, D., Qian, G., Li, Y., Kuang, C., et al. (2000). Deep seismic reflection profile across the juncture zone between the Tarim basin and the West Kunlun Mountains (in Chinese with English abstract). Chin. Sci. Bull. 45, 2281–2286, doi: 10.1007/BF02886369.
Guan, S., He, D., Lei, Y., and Chen, Z. (2013). Kinematic classification, structural modeling and prospective fields of the foreland thrust belts in Midwest China. Petrol. Explor. Dev. 40, 69–83. doi:10.1016/S1876-3804(13)60007-5.
Guilbaud, C., Simoes, M., Barrier, L., Laborde, A., Van der Woerd, J., Li, H., et al. (2017). Kinematics of active deformation across the Western Kunlun mountain range (Xinjiang, China), and potential seismic hazards within the southern Tarim basin. J. Geophys. Res. Solid Earth 122, 10398–10426.
Hardy, S., and Ford, M. (1997). Numerical modeling of trishear fault propagation folding, Tectonics 16, 841–854. doi:10.1029/97tc01171.
He, P., Wang, Q., Ding, K., Wang, M., Qiao, X., Li, J., et al. (2016). Source model of the 2015 Mw 6.4 Pishan earthquake constrained by interferometric synthetic aperture radar and GPS: insight into blind rupture in the western Kunlun Shan. Geophys. Res. Lett. 43, 1511–1519. doi:10.1002/2015GL067140.
Hidy, A. J., Gosse, J. C., Pederson, J. L., Mattern, J. P., and Finkel, R. C. (2010). A geologically constrained Monte Carlo approach to modeling exposure ages from profiles of cosmogenic nuclides: an example from Lees Ferry, Arizona. Geochem. Geophys. Geosyst. 11, Q0AA10. doi:10.1029/2010GC003084.
Hu, J. Z., Tan, Y. J., and Zhang, P. (2008). Structural features of Cenozoic thrust-fault belts in the piedmont of southwestern Tarim basin (in Chinese with English abstract). Earth Sci. Front. 15, 222–231. doi:10.3321/j.issn:1005-2321.2008.02.025.
Hubert-Ferrari, A., Suppe, J., Gonzalez-Mieres, R., and Wang, X. (2007). Mechanisms of active folding of the landscape (southern Tian Shan, China). J. Geophys. Res. 112, B03S09. doi:10.1029/2006JB004362.
Ishiyama, T., Mueller, K., Sato, H., and Togo, M. (2007). Coseismic fault-related fold model, growth structure, and the historic multisegment blind thrust earthquake on the basement-involved Yoro thrust, central Japan. J. Geophys. Res. 112, B03S07. doi:10.1029/2006JB004377.
Ishiyama, T., Mueller, K., Togo, M., Okada, A., and Takemura, K. (2004). Geomorphology, kinematic history, and earthquake behavior of the active Kuwana wedge thrust anticline, central Japan. J. Geophys. Res. 109, B12408. doi:10.1029/2003JB002547.
Jamison, W. R. (1987). Geometric analysis of fold development in overthrust terranes. J. Struct. Geol. 9, 207–219. doi:10.1016/0191-8141(87)90026-5.
Jiang, X.-D., and Li, Z.-X. (2014). Seismic reflection data support episodic and simultaneous growth of the Tibetan plateau since 25 Myr. Nat. Commun. 5, 5453. doi:10.1038/ncomms6453.
Jiang, X., Li, Z.-X., and Li, H. (2013). Uplift of the west Kunlun range, northern Tibetan plateau, dominated by brittle thickening of the upper crust. Geology 41, 439–442. doi:10.1130/G33890.1.
Kao, H., Gao, R., Rau, R.-J., Shi, D., Chen, R.-Y., Guan, Y., et al. (2001). Seismic image of the Tarim basin and its collision with Tibet. Geology 29, 575–578. doi:10.1130/0091-7613(2001)029<0575:siottb>2.0.co;2.
Lal, D. (1991). Cosmic ray labeling of erosion surfaces: in situ nuclide production rates and erosion models. Earth Planet Sci. Lett. 104, 424–439. doi:10.1016/0012-821x(91)90220-c.
Lavé, J., and Avouac, J. P. (2000). Active folding of fluvial terraces across the siwaliks hills, himalayas of central Nepal. J. Geophys. Res. 105, 5735–5770. doi:10.1029/1999jb900292.
Le Béon, M., Suppe, J., Jaiswal, M. K., Chen, Y.-G., and Ustaszewski, M. E. (2014). Deciphering cumulative fault slip vectors from fold scarps: relationships between long-term and coseismic deformations in central Western Taiwan. J. Geophys. Res. Solid Earth 119, 5943–5978. doi:10.1002/2013JB010794.
Li, H., Pan, J., Sun, Z., Liu, D., Zhang, J., Li, C., et al. (2015). Seismogenic structure and surface rupture characteristics of the 2014 Ms7.3 Yutian earthquake (in Chinese with English abstract). Acta Geol. Sin. 89, 180–194.
Li, T., Chen, J., Fang, L., Chen, Z., Thompson, J. A., and Jia, C. (2016). The 2015Mw 6.4 pishan earthquake: seismic hazards of an active blind wedge thrust system at the western Kunlun range front, northwest Tibetan plateau. Seismol Res. Lett. 87, 601–608. doi:10.1785/0220150205.
Li, T., Chen, J., Thompson Jobe, J. A., Burbank, D. W., Cheng, X., Xu, J., et al. (2018). Active bending-moment faulting: geomorphic expression, controlling conditions, Accommodation of Fold Deformation. Tectonics 37, 2278–2306. doi:10.1029/2018TC004982.
Li, T., and Chen, J. (2014). Using deformed fluvial terraces to constrain growth mechanism and rates of thrust related fold: methods and recognition (in Chinese with English abstract). Seismol. Geol. 36, 478–488.
Liang, H., Du, Z., Wang, Y., and Wang, Y. (2012). Cenozoic fold and thrust belt in eastern section of the piedmount of west Kunlun and its taper wedge mechanics (in Chinese with English abstract). Chin. J. Geol. 47, 808–823. doi:10.3969/j.issn.0563-5020.2012.03.017.
Liang, H., Wang, X., Chen, W., and Wang, Y. (2014). Cenozoic deformation sequence of hetian-kekeya structural belt in the piedmont of West Kunlun mountains (in Chinese with English abstract). Geotect. Metallogenia 38, 27–37.
Liu, S., Wang, X., Wu, X., and Qiu, B. (2004). Growth strata and the deformation time of the Late Cenozoic along front belts of Pamir-western Kunlun, southwest Tianshan in China (in Chinese with English abstract). Acta Pet. Sin. 25, 24–28. doi:10.3321/j.issn:0253-2697.2004.05.005.
Lu, H., Wang, S., Suppe, J., Hubert-Ferrari, A., Yin, D., Yan, F., et al. (2002). Quaternary folding in the south piedmont of central segment of Tianshan Mountains (in Chinese with English abstract). Chin. Sci. Bull. 47, 1675–1679. doi:10.3321/j.issn:0023-074X.2002.21.015.
Lu, R., Xu, X., He, D., Liu, B., Tan, X., and Wang, X. (2016). Coseismic and blind fault of the 2015 PishanMw6.5 earthquake: implications for the sedimentary-tectonic framework of the western Kunlun Mountains, northern Tibetan Plateau. Tectonics 35, 956–964. doi:10.1002/2015TC004053.
Métivier, F., and Gaudemer, Y. (1997). Mass transfer between eastern Tien Shan and adjacent basins (central Asia): constraints on regional tectonics and topography. Geophys. J. Int. 128, 1–17. doi:10.1111/j.1365-246X.1997.tb04068.x.
Meade, B. J., and Hager, B. H. (2005). Block models of crustal motion in southern California constrained by GPS measurements. J. Geophys. Res. 110, B03403. doi:10.1029/2004JB003209.
Medwedeff, D. A. (1992). “Geometry and kinematics of an active, laterally propagating wedge thrust, Wheeler Ridge, California,” in Structural geology of fold and trust belts, Editors S., Mitra, and G. W., Fisher, Baltimore, MD:Johns Hopkins Univ. Press, 3–28.
Medwedeff, D. A., and Suppe, J. (1997). Multibend fault-bend folding. J. Struct. Geol. 19, 279–292. doi:10.1016/s0191-8141(97)83026-x.
Pan, J., Li, H., Sun, Z., Pei, J., Si, J., Barrier, L., et al. (2010). Deformation features of the Mazartagh fold–thrust belt, south central Tarim basin and its tectonic significances, Dizhi Kexue (in Chinese with English abstract). Chin. J. Geol. 45(4), 1038–1056. doi:10.3969/j.issn.0563-5020.2010.04.009.
Pan, J., Li, H., Van Der Word, J., Sun, Z., Pei, J., Barrier, L., et al. (2007). Late cenozoic morphotectonic features of the thrust belt in the front of the West Kunlun Mountains (in Chinese with English abstract). Geol. Bull. China 26, 1368–1379. doi:10.3969/j.issn.1671-2552.2007.10.014.
Pan, J. (2008). Study on morphotectonic features and uplift in the front of the West Kunlun Mountains. Master’s thesis. Beijing, China:Chinese Academy of Geological Science, 119.
Philip, H., and Meghraoui, M. (1983). Structural analysis and interpretation of the surface deformations of the El Asnam earthquake of October 10, 1980. Tectonics 2, 17–49. doi:10.1029/tc002i001p00017.
Ritts, B. D., Yue, Y., Graham, S. A., Sobel, E. R., Abbink, O. A., and Stockli, D. (2008). From sea level to high elevation in 15 million years:Uplift history of the northern Tibetan Plateau margin in the Altun Shan. Am. J. Sci. 308, 657–678. doi:10.2475/05.2008.01.
Rockwell, T. K., Keller, E. A., and Dembroff, G. R. (1988). Quaternary rate of folding of the Ventura Avenue anticline, western Transverse Ranges, southern California. Geol. Soc. Am. Bull. 100, 850–858. doi:10.1130/0016-7606(1988)100<0850:qrofot>2.3.co;2.
Rood, D. H., Burbank, D. W., and Finkel, R. C. (2011). Spatiotemporal patterns of fault slip rates across the central Sierra Nevada frontal fault zone. Earth Planet Sci. Lett. 301, 457–468. doi:10.1016/j.epsl.2010.11.006.
Saint-Carlier, D., Charreau, J., Lavé, J., Blard, P.-H., Dominguez, S., Avouac, J.-P., et al. (2016). Major temporal variations in shortening rate absorbed along a large active fold of the southeastern Tianshan piedmont (China). Earth Planet Sci. Lett. 434, 333–348. doi:10.1016/j.epsl.2015.11.041.
Savage, J. C., and Burford, R. O. (1970). Accumulation of tectonic strain in California. Bull. Seismol. Soc. Am. 60, 1877–1896.
Scharer, K. M., Burbank, D. W., Chen, J., and Weldon, R. J. (2006). Kinematic models of fluvial terraces over active detachment folds: constraints on the growth mechanism of the Kashi-Atushi fold system, Chinese Tian Shan. Geol. Soc. Am. Bull. 118, 1006–1021. doi:10.1130/B25835.1.
Shaw, J. H., Connors, C., and Suppe, J. (2004). Seismic interpretation of contractional fault-related folds: an AAPG seismic atlas. Tulsa, Okla: American Association of Petroleum Geologists, 156
Shaw, J. H., and Suppe, J. (1994). Active faulting and growth folding in the eastern Santa Barbara Channel, California. Geol. Soc. Am. Bull. 106, 607–626. doi:10.1130/0016-7606(1994)106<0607:afagfi>2.3.co;2.
Si, J., Li, H., Pei, J., Sun, Z., Pan, J., and Qiu, Z. (2011). Sedimentary environment variation and its tectonic significance of Mazar Tagh in the middle Tarim Basin (in Chinese with English abstract). Acta Petrol. Sin. 27, 321–332.
Simoes, M., Avouac, J. P., Chen, Y.-G., Singhvi, A. K., Wang, C.-Y., Jaiswal, M., et al. (2007). Kinematic analysis of the Pakuashan fault tip fold, west central Taiwan: shortening rate and age of folding inception. J. Geophys. Res. 112, B03S14. doi:10.1029/2005JB004198.
Simoes, M., Chen, Y.-G., Shinde, D. P., and Singhvi, A. K. (2014). Lateral variations in the long-term slip rate of the Chelungpu fault, Central Taiwan, from the analysis of deformed fluvial terraces. J. Geophys. Res. Solid Earth 119, 3740–3766. doi:10.1002/2013JB010057.
Sobel, E. R., and Dumitru, T. A. (1997). Thrusting and exhumation around the margins of the western Tarim basin during the India-Asia collision. J. Geophys. Res. 102, 5043–5063. doi:10.1029/96jb03267.
Stockmeyer, J. M., Shaw, J. H., Brown, N. D., Rhodes, E. J., Richardson, P. W., Wang, M., et al. (2017). Active thrust sheet deformation over multiple rupture cycles: a quantitative basis for relating terrace folds to fault slip rates. Geol. Soc. Am. Bull. 129, 1337–1356. doi:10.1130/B31590.1
Stone, J. O. (2000). Air pressure and cosmogenic isotope production. J. Geophys. Res. 105, 23753–23759. doi:10.1029/2000JB900181.
Sun, J., and Liu, T. (2006). The age of the taklimakan desert. Science 312, 1621. doi:10.1126/science.1124616.
Suppe, J., Chou, G. T., and Hook, S. C. (1992). “Rates of folding and faulting determined from growth strata,” in Thrust tectonics, Editor K. R., McClay (London, UK:Chapman & Hall), 105–121.
Suppe, J. (1983). Geometry and kinematics of fault-bend folding. Am. J. Sci. 283, 684–721. doi:10.2475/ajs.283.7.684.
Suppe, J., Sàbat, F., Anton Muñoz, J., Poblet, J., Roca, E., and Vergés, J. (1997). Bed-by-bed fold growth by kink-band migration: sant llorenç de Morunys, eastern Pyrenees. J. Struct. Geol. 19, 443–461. doi:10.1016/s0191-8141(96)00103-4.
Thompson, S. C., Weldon, R. J., Rubin, C. M., Abdrakhmatov, K., Molnar, P., and Berger, G. W. (2002). Late quaternary slip rates across the central Tien Shan, Kyrgyzstan, central Asia. J. Geophys. Res. 107, 2203. doi:10.1029/2001JB000596.
Wang, E., Wan, J., and Liu, J. (2003). Late cenozoic geological evolution of the foreland basin bordering the west Kunlun range in Pulu area: constraints on timing of uplift of northern margin of the Tibetan Plateau. J. Geophys. Res. 108, 2401. doi:10.1029/2002JB001877.
Wen, Y., Xu, C., Liu, Y., and Jiang, G. (2016). Deformation and source parameters of the 2015 Mw 6.5 earthquake in pishan, western China, from sentinel-1a and ALOS-2 data. Rem. Sens. 8, 134. doi:10.3390/rs8020134.
Wittlinger, G., Vergne, J., Tapponnier, P., Farra, V., Poupinet, G., Jiang, M., et al. (2004). Teleseismic imaging of subducting lithosphere and Moho offsets beneath western Tibet. Earth Planet Sci. Lett. 221, 117–130. doi:10.1016/S0012-821X(03)00723-4.
Wu, C., Liu, J., Li, J., Hu, W., Wu, G., Chang, X., et al. (2019). The 2015 Ms 6.5 Pishan earthquake, Northwest Tibetan Plateau: a folding event in the western Kunlun piedmont. Geosphere 15, 935–945. doi:10.1130/GES02063.110.1130/ges02063.1.
Wu, X., Liu, S., Wang, X., Yang, S., and Gu, X. (2004). Analysis on structural sections in the Cenozoic Pamir-western Kunlun foreland fold-and-thrust belt (in Chinese with English abstract). Chin. J. Geol. 39, 260–271. doi:10.3321/j.issn:0563-5020.2004.02.013.
Xiao, A. (1996). Depth of detachment surface in foreland thrust-fold belt of Western Kunlun mountain in southwestern Tarim basin (in Chinese). J. Jianghan Petrol. Inst. 18, 19–23.
Yang, H., Li, Y., Feng, X., Zheng, M., Zhang, C., and Zhao, Y. (2007). Analysis on thrustings of the mazhatage structural belt in Tarim Basin (in Chinese with English abstract). Chin. J. Geol. 42, 506–5l7. doi:10.3321/j.issn:0563-5020.2007.03.008.
Yin, A., Rumelhart, P. E., Butler, R., Cowgill, E., Harrison, T. M., Foster, D. A., et al. (2002). Tectonic history of the Altyn Tagh fault system in northern Tibet inferred from Cenozoic sedimentation. Geol. Soc. Am. Bull. 114, 1257–1295. doi:10.1130/0016-7606(2002)114<1257:thotat>2.0.co;2.
Yue, L., Suppe, J., and Hung, J. (2011). “Two contrasting kinematic styles of active folding above thrust ramps, Western Taiwan,” in Thrust fault-related folding, Editors K., McClay, J., Shaw, and J., Suppe, (Oklahoma, US:Am. Assoc. Pet. Geol.), Vol. 94, 153–186.
Zhang, P.-Z., Molnar, P., and Xu, X. (2007). Late quaternary and present-day rates of slip along the Altyn Tagh Fault, northern margin of the Tibetan plateau. Tectonics, 26, TC5010. doi:10.1029/2006TC002014.
Keywords: fault-bend fold, blind thrust fault, Guman fold, slip rate, Western Kunlun Mountain
Citation: Xu J, Chen J, Arrowsmith JR, Li T, Zhang B, Di N and Pang W (2020) Growth Model and Tectonic Significance of the Guman Fold Along the Western Kunlun Mountain Front (Xinjiang, China) Derived From Terrace Deformation and Seismic Data. Front. Earth Sci. 8:590043. doi:10.3389/feart.2020.590043
Received: 31 July 2020; Accepted: 28 September 2020;
Published: 29 October 2020.
Edited by:
Yosuke Aoki, The University of Tokyo, JapanReviewed by:
Judith Hubbard, Nanyang Technological University, SingaporeAndrey Kozhurin, Institute of Volcanology and Seismology, Russia
Copyright © 2020 Xu, Chen, Arrowsmith, Li, Zhang, Di and Pang. This is an open-access article distributed under the terms of the Creative Commons Attribution License (CC BY). The use, distribution or reproduction in other forums is permitted, provided the original author(s) and the copyright owner(s) are credited and that the original publication in this journal is cited, in accordance with accepted academic practice. No use, distribution or reproduction is permitted which does not comply with these terms.
*Correspondence: Jianhong Xu, Xuxujianhongmailbox@163.com