Selection Cuttings as a Tool to Control Water Table Level in Boreal Drained Peatland Forests
 Kersti Leppä1*
  Hannu Hökkä2
  Raija Laiho1
  Samuli Launiainen1
  Aleksi Lehtonen1
  Raisa Mäkipää1
  Mikko Peltoniemi1
  Markku Saarinen3 Sakari Sarkkola1 Mika Nieminen1
- 1Natural Resources Institute Finland, Helsinki, Finland
- 2Natural Resources Institute Finland, Oulu, Finland
- 3Natural Resources Institute Finland, Tampere, Finland
Continuous cover management on peatland forests has gained interest in recent years, in part because the tree biomass with significant evapotranspiration capacity retained in selection cuttings could be used as a tool to optimize the site water table level (WTL) from both tree growth and environmental perspectives. This study reports WTL responses from six field trials established on fertile Norway spruce–dominated drained peatland forests across Finland. At each site, replicates of different intensity selection cuttings (removing 17–74% of the stand basal area) or clear-cut in parallel with intact control stands were established and monitored for the WTL for 2–5 postharvest years. The observed WTL rose after selection cuttings, and the response increased with harvest intensity and depended on the reference WTL; that is, larger responses were found during dry summers or in more southern location. Selection cuttings removing about 50% of the stand basal area raised the WTL typically by 15–40%. Using a process-based ecohydrological model, tested against data from the field trials, we show that the role of tree stand in controlling the WTL clearly decreases along the latitudinal climate gradient in Finland. This suggests that the potential of controlling WTL using selection cuttings is more prominent in southern than in northern Finland. Predictions with future climate (2070–2099) further indicated a general decrease of the WTL and that the importance of the tree stand in controlling the WTL will increase, especially in northern Finland. The results overall thus suggest that selection cuttings can be used as a tool to control the WTL in boreal drained peatland forests, and the potential is likely to increase in future climate.
Introduction
About 15 Mha of peatlands and wetlands have been drained for forestry purposes in the temperate and boreal zones (Paavilainen and Päivänen, 1995). The water table level (WTL) in peat soil is the key to their environmentally and economically feasible management. Too high WTL is detrimental to tree growth and vitality, making WTL lowering by drainage a necessary forest operation on the majority of peatlands. At the same time, drainage and ditch cleaning are substantial sources of sediments and particulate nutrients to receiving water courses (Joensuu et al., 1999; Nieminen et al., 2010; Stenberg et al., 2015; Nieminen et al., 2017a). In fact, ditch cleaning is currently regarded as the most harmful forestry operation affecting surface water quality in Finland (Finér et al., 2010). Compared with mineral soil forests, maintenance of ditch networks is also a significant extra cost which impacts the overall economic profitability of peatland forestry (Ahtikoski et al., 2008; Ahtikoski et al., 2012). However, Sarkkola et al. (2010), Sarkkola et al. (2012), and Sarkkola et al. (2013) suggest that ditch cleaning is unnecessary in high-volume peatland stands, which has given rise to the idea of growing peatland forests according to the principles of continuous cover forestry (CCF) instead of rotation-based management with clear-cuts (Nieminen et al., 2018a).
CCF, which relies on regular partial harvests, could also address other environmental consequences that rotation-based management on peatlands induces. After clear-cutting, the rise of WTL to near the soil surface results in anoxic redox reactions, enhancing the mobilization and outflow of redox-sensitive compounds, such as phosphate, iron, and dissolved organic nitrogen and carbon (Kaila et al., 2014; Kaila et al., 2015; Nieminen et al., 2015). High WTL after clear-cutting may also increase methane (CH4) emissions, particularly when the WTL rises higher than 30 cm below the soil surface (Ojanen et al., 2010; Ojanen et al., 2013; Korkiakoski et al., 2019). Also, very low WTL, prevailing in densely stocked stands, may be environmentally unfavorable. Ojanen et al. (2010), Ojanen et al. (2013), and Ojanen and Minkkinen (2019) showed high carbon dioxide (CO2) and nitrous oxide (N2O) emissions from drained peatland forests with a low WTL, presumably because of enhanced peat decomposition of deep peat layers. Lowering of the WTL and consequent diffusion of oxygen into deep peat layers are also thought to explain why nitrogen and phosphorus exports have been shown to increase from drained peatland forests across Finland (Nieminen et al., 2017b; Nieminen et al., 2018b).
To summarize, the aim of CCF would be to manage peatland forests in such a way that i) WTL does not rise near the soil surface (reduced tree growth, enhanced CH4 emissions, export of redox-sensitive nutrients, and need for drainage) and ii) WTL does not drop very deep, causing enhanced decomposition of deep peat layers (CO2 and N2O emissions and exports of mineralized nitrogen and phosphorus). According to Nieminen et al. (2018a), this not only would be beneficial from environmental perspectives but could also present economical savings by avoiding ditch cleaning and site preparation. They hypothesize that executing partial harvests, such as selection or gap cuttings, instead of clear-cutting would raise the WTL only marginally. Also, as the average stand volumes maintained in CCF forests would be lower than those in mature forests approaching clear-cut, the WTL would not drop as deep as in rotation-based management.
The feasibility of CCF thus comes down to the relationship between tree stand characteristics and WTL, which are linked through the water balance of the peatland strip. The stand intercepts and evaporates (Ec) part of the incoming precipitation (P), and takes up water from the soil by transpiration (T), while WTL dynamics reflect the changes in soil water storage (dS/dt). Additionally, the water balance is affected by forest floor evaporation (Ef) and runoff (Q):
where
The relationship between mean growing season WTL and stand properties on drained peatland forests is commonly acknowledged (Ahti and Hökkä, 2006; Hökkä et al., 2008b; Sarkkola et al., 2010), but the shape and strength of the relationship vary with climatic conditions, site type, and drainage configuration (Hökkä et al., 2008a; Sarkkola et al., 2010). To date, this relationship has typically been studied by comparing WTLs across sites of varying stand density (e.g., Hökkä et al., 2008a; Sarkkola et al., 2010) and only seldom by implementing harvests of different intensities and monitoring responses to WTL (Heikurainen and Päivänen, 1970; Päivänen, 1982; Päivänen and Sarkkola, 2000). As CCF would rely on such harvests, it is important to study the stand properties to WTL relationship in such setup and to understand how the relationship is affected by varying stand and drainage characteristics across climatic regions. This has been mostly omitted in earlier studies as they were limited to single sites (Heikurainen and Päivänen, 1970; Päivänen and Sarkkola, 2000), with the exception of Päivänen (1982) who studied harvest responses in spruce- and pine-dominated stands, however, in close proximity to each other.
In this work, we quantify and predict the effects of selection cuttings and the role of tree stand on the WTL in drained peatland forests. Specifically, we address the following research questions:
(1) How does growing season WTL respond to selection cuttings?
(2) How does the role of the tree stand vary along the climatic gradient in Finland?
(3) How will climate change affect WTL and its response to stand characteristics?
To find answers to these questions, six field trials were established on fertile Norway spruce-dominated drained peatland forests in Finland. At each site, replicated study plots with different intensity selection cuttings (removing 17–74% of the stand basal area) or clear-cutting in parallel with intact control stands were monitored for WTL for 2–5 postharvest years. The empirical results were complemented with predictions by a process-based ecohydrological model, which we validate against the field observations. The model is further used to generalize the WTL responses of selection cuttings of various intensities over the climate gradient in Finland in current and future climate.
Study Sites
General Descriptions
The six study sites covered a latitude gradient from 61.0 to 66.2°N in Finland (Figure 1; Table 1). The sites represented a range of drained Norway spruce (Picea abies)–dominated peatland forests with varying mixture of downy birch (Betula pubescens) and Scots pine (Pinus sylvestris). Sites S1, S4, and S6 represented the highest fertility level of drained peatland forests, classified as herb-rich type according to Laine (1989). S2 and most of S3 represented the Vaccinium myrtillus type, and part of S3 and S5 the Vaccinium vitis-idaea type. The peat layer was more than 1 m thick in other sites, except S1 and parts of S3. Peat in S2, S4, and S6 was characterized by sedge (Carex) remains, and in other sites, a mixture of Sphagnum mosses and decomposed wood. The sites were drained for forestry in 1940–1960s and managed at least once by ditch network maintenance. At present, the ditch networks are in poor or moderate condition with large variation in depth (Table 1). The stands approached maturity before selection harvestings, and Norway spruce occurred in the understory below the stand canopy. According to the tree diameter distribution, all the stands had structural inequalities and can be regarded as uneven-aged having J-shaped, skewed, or two-storied size distribution before harvesting.
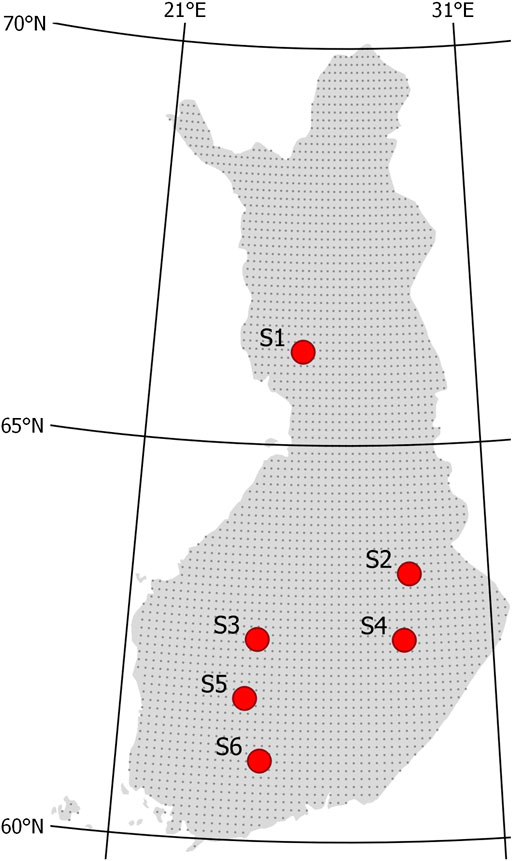
FIGURE 1. Location of study sites S1–S6 in Finland. Gray dots indicate resolution used in generalizing climate simulations (see section Scenario Simulations for Current and Future Climate).
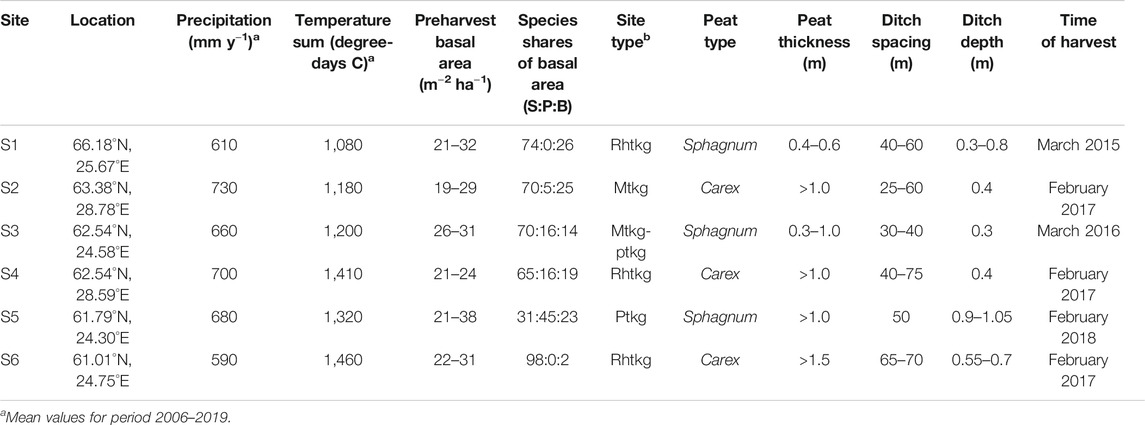
TABLE 1. Site characteristics of the studied experimental stands on drained peatland forests in Finland.
Harvesting Treatments and Field Measurements
Each site had 4–16 permanent sample plots (Figure 2), whose area varied between 970 and 2,000 m2. The plots were treated either with selection cutting or clear-cutting, or left intact as control plots (no harvest) each having two to five replicates. The setup assumes neighboring plots on same strip are independent, that is, that the WTL rise in one plot does not affect that of the neighboring plot. This may not always be true (cf. Koivusalo et al., 2008), but here this concern is addressed by having replicates of each treatments and control plots at each site unlike in earlier studies (Heikurainen and Päivänen, 1970; Päivänen, 1982; Päivänen and Sarkkola, 2000).
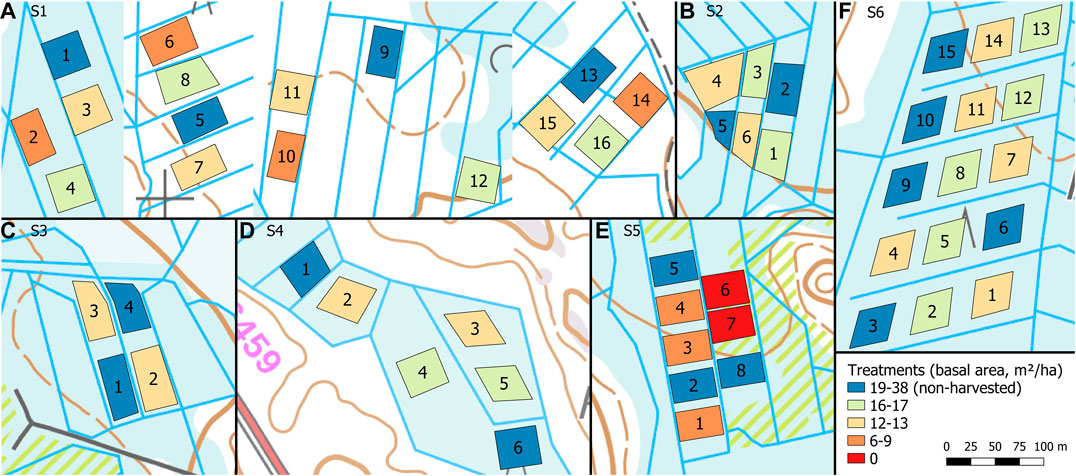
FIGURE 2. Experimental plots in the study sites S1–S6 (A–F) categorized by the postharvest stand basal area. Site S1 (A) was composed of four blocks located 0.2–2.5 km apart. Background map: basic map raster © National Land Survey of Finland March 2020.
Selection cuttings were performed at different intensities with the target postharvest stand basal area varying from 6 to 17 m2 ha−1. The emphasis of the harvest removal was on the upper half of the stand diameter at breast height (DBH) distribution within each plot, retaining the suppressed and understory trees and also some of the largest trees. Harvestings were carried out during winter in 2015–2018 (Table 1). For details of all experimental plots, see Supplementary Table 3.
Before harvest, stand measurements were performed at each experimental plot recording species and DBH of all trees taller than 1.3 m. Additionally, on average, 45 sample trees per plot representing the whole diameter distribution of that plot were measured for tree height and crown base height. Except for site S5, all the trees to be removed were measured and marked before harvesting. At S5, stand measurements were conducted after harvest, and the DBH of harvested trees (d, cm) was derived from stump diameter of felled trees (ds, cm):
WTL (level of the water table relative to the soil surface) was monitored manually from nine ground water tubes (32 mm diameter) installed in each experimental plot in a form of a regular grid (3 × 3). The tubes were perforated (3 mm holes) from the bottom to a height about 10 cm below peat surface and were installed down to 1 m depth or, in thinner peated sites, down to the subsoil below peat. Measurements were taken during growing seasons at 1- to 2-week intervals during 2015–2019, except for site S1 where monitoring started already in September 2014.
Methods
Water Table Level Data Analysis
The nine WTL observations for each plot j of site i at the observation time t were aggregated as median values:
where k stands for the tube number. Occasionally, the number of observations from plot j at time t was less than nine due to dry or frozen tubes. Medians (Eq. 3) were not derived if there were less than four observations at time t.
In order to predict the WTL response to harvest, we applied the paired catchment approach (e.g., Kaila et al., 2014) within each site (subscript i omitted from Eqs 4–6). First, ordinary least square linear regressions were fitted between WTL of each plot (j) and control plots
Second, these linear models were applied to predict reference WTL (corresponding to non-harvested conditions) for each plot for the postharvest period as the arithmetic mean of the predictions based on individual parallel control plots.
Comparing the predicted reference WTL to the observed postharvest WTL gives the WTL response to harvest at plot j:
To analyze the dependence of the WTL response on harvest intensity at each site i, we explored the fit of the following ordinary least square regression model:
where
Yearly (June–October) values for
Modeling Water Table Level
Model Description
In order to simulate WTL dynamics, we combined the aboveground modules from the SpaFHy-model (Launiainen et al., 2019) with a simple hydrological description of the peat profile and lateral ditch drainage. The adopted SpaFHy modules describe rainfall and snow interception by the canopy and a moss/litter layer, snow accumulation and melt, infiltration to soil profile, and ET components. SpaFHy runs on a daily time step applying daily precipitation, air temperature, global radiation, photosynthetically active radiation, mixing ratios of H2O and CO2, and wind speed as meteorological forcing. SpaFHy accounts for leaf area index (LAI) dynamics of deciduous species and their different photosynthetic capacity compared to conifers. Thus, model parameters include LAI (one-sided) separately for conifers and deciduous trees. Further stand characteristics required by the model are canopy closure and dominant tree height.
The only modifications compared to Launiainen et al. (2019) was made to the soil moisture limit on canopy stomatal conductance. We described it following Koivusalo et al. (2008), but excluding the restriction of stomatal conductance during wet conditions:
where
The below ground hydrology is described by a 2-m-deep peat profile that stores infiltrated water and loses water due to transpiration, ditch drainage, and, in case of full saturation, surface runoff. WTL in the profile is computed based on the amount of water stored in the profile assuming hydraulic equilibrium (constant hydraulic head in vertical dimension, Skaggs, 1980). The function between water storage and WTL depends on peat water retention characteristics (van Genuchten) defined for the peat profile (see section Application to Study Sites). The function was obtained from tabulated values of water storage and WTL computed at 1mm intervals prior to simulations. The root zone moisture content (needed in Eq. 8) is computed using the same assumption of hydraulic equilibrium.
Drainage from the peat profile to the ditches follows Hooghoudt (1940) equation, but neglecting drainage from below the ditches which was considered minor:
where
Summary from the free‐air CO2 enrichment (FACE) studies (Ainsworth and Rogers, 2007) and theoretical arguments (Katul et al., 2010; Medlyn et al., 2011) both suggest leaf and canopy stomatal conductance decrease with increasing atmospheric CO2 concentrations, leading to reduced transpiration rates in future climates. We account the effect of CO2 (ppm) concentration on canopy stomatal conductance through a modifier function (unitless):
where 380 ppm is the reference CO2 concentration. Equation 10 is based on predictions of a multilayer ecosystem model, parameterized for boreal coniferous forests (Launiainen et al., 2015; Launiainen et al., 2016), run using various atmospheric CO2 mixing ratios. It results into about 15% reduction in canopy stomatal conductance for 1.5-fold rise in atmospheric CO2 concentration from reference 380 ppm, in line with FACE experiments (Ainsworth and Rogers, 2007).
Application to Study Sites
The model was run for the unharvested and harvested stands of each plot on each site resulting in 55 (non-harvested stands) + 38 (harvested stands) = 93 modeling cases. The simulation period was 2010–2019 to ensure appropriate model spin-up before the monitoring period. Simulated WTL and WTL responses to harvests were evaluated against the observations. We evaluated the model performance using site average mean absolute error (MAE):
where
For forcing data, we used spatially averaged (10 km2 × 10 km2 resolution or 1 km2 × 1 km2 since July 2016) daily meteorological data obtained from the Finnish Meteorological Institute (FMI) weather stations and provided by the FMI (Aalto et al., 2013). Additionally, we checked if there were FMI precipitation stations closer by our sites than the weather stations. That was true for one site (S4), for which we used precipitation data from that station instead of the gridded weather station data. Unavailable forcing variables were defined as follows: photosynthetically active radiation as 45% of global radiation, wind speed as constant 2.0 m s−1, and CO2 mixing ratio as 400 ppm.
Stand parameters for the pre- and postharvest stand of each plot were derived from tree stand measurements (see Supplementary Material). First, species-specific equations for tree height and crown base height were fitted to the sample trees, and then the fitted models were used to predict tree height and crown base height for all measured trees. This allowed us to determine dominant tree height for each plot. Because tree heights and crown base heights from the same site were correlated, we applied nonlinear mixed-effects models to account for the correlation. We assumed that the relationships between diameters and tree heights and crown heights of the same species follow similar functional form and applied model formulation named “Curtis” provided by lmfor R package (Mehtätalo et al., 2015; Mehtätalo, 2019). Application of mixed models by tree species allowed us to use the random part of the model to estimate calibrated heights and crown base heights for each tree by site ensuring more precise estimates for each tree (Lappi, 1991). Second, one-sided LAI was derived separately for conifers and deciduous species based on DBH, crown base height, and tree height using foliage biomass functions (Tupek et al., 2015; Lehtonen et al., 2020) and specific leaf area values (Härkönen et al., 2015). When estimating LAI, we assumed that 50% of needle mass were sunlit leaves and 50% shaded leaves; this assumption was made due to relative high basal area within these stands. Canopy closure was estimated based on the basal area (model fitted to data presented by Korhonen et al. (2007)):
where
For each plot, ditch spacing was determined from maps, and ditch depth was either measured in the field (sites S1, S5, and S6) or estimated from 2 m2 × 2 m2 digital elevation model provided by the National Land Survey of Finland. These as well as the stand parameters for each plot are listed in the Supplementary Table 3.
The water retention characteristics and saturated hydraulic conductivities of the soil profiles were defined based on the peat type at the site (Table 1). Typical profiles for Sphagnum and Carex peat were derived from the datasets collected by Päivänen (1973). Below 0.1 m from the soil surface, the water retention characteristics were based on the fit to all peat type–specific (Carex/Sphagnum) data presented by Päivänen (1973), while the water retention parameters of the topmost 0.1 m were set based on the Carex/Sphagnum sample with the poorest water retention capacity (Figure 3). Saturated hydraulic conductivity for each 0.1 m layer was defined in relation to depth with the peat type–specific functions presented by Päivänen (1973), restricting it to a minimum 0.01 m d−1. Conductivities of the 0–0.1, 0.1–0.2, and 0.2–0.3 m layers from the soil surface were multiplied by 30, 20, and 10, respectively, to represent anisotropy which results in the surface peat having a much larger horizontal conductivity than the deeper peat layer (Koivusalo et al., 2008; Haahti et al., 2016).
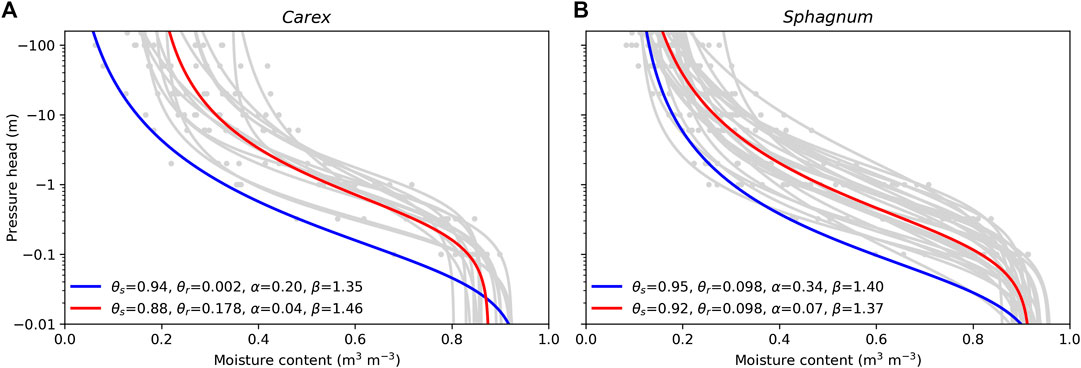
FIGURE 3. Water retention of Carex (A) and Sphagnum (B) samples published by Päivänen (1973): water retention curves for individual samples in gray, for whole data in red, and for sample with poorest water retention capacity in blue. θs = soil porosity; θr = residual water content; α, β = van Genuchten water retention curve parameters.
Scenario Simulations for Current and Future Climate
To explore to the potential of selection cuttings in controlling WTL in current and future climate, we run scenario simulations at a 0.1-grid resolution for entire Finland (Figure 1). As forcing, we used reference period (1981–2010) and future (2070–2099) climate scenario data. The climate scenario dataset consisted of bias-corrected predictions of weather parameters from the five global climate models (CanESM2, CNRM, GFDL, HadGEM2, and MIROC5) (Lehtonen et al., 2016) for three representative concentration pathways RCP2.6 (low emission scenario), RCP4.5 (moderate emission scenario), and RCP8.5 (high emission scenario). Bias correction in the dataset used gridded weather data from the reference period (Aalto et al., 2013), and applied methods are described in Räisänen and Räty (2013) and Räty et al. (2014). The simulations were run both with and without the CO2 effect on canopy stomatal conductance described by Eq. 10.
The scenario simulations were run with the stand basal area varying from 6 to 30 m−2 ha−1 (at 6 m−2 ha−1 intervals, i.e., 5 levels). LAI corresponding to these values was estimated based on the LAI to basal area relationship obtained using a linear regression and the data from the study sites (excluding stands with high share of pines which have low LAI to basal area ratio). This resulted in LAI ranging from 1.4 to 6.7 m2 m−2. Canopy closure was estimated using Eq. 12. Other model parameters were set to the mean values of study sites and peat type as Carex (Table 2).
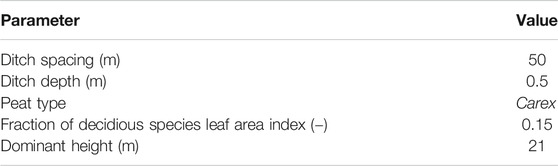
TABLE 2. Parameter values applied in scenario simulations.
Results
Observed Water Table Level Responses at Study Sites
The mean preharvest WTL varied typically by 0.1–0.2 m between parallel plots of the same site, except for site S1 where the difference was up to 0.4 m (Figure 4). Control plot WTL during pre- and postharvest periods further indicates that meteorological conditions of these periods were different. For example, at site S5 (Figure 4E), the mean WTL at the control plots before harvest was about 0.1 m higher than that after harvest during 2018–2019, which were both dry and warm summers. Thus, comparing postharvest WTL of treated plots directly to that of control plots or to the preharvest WTL could be misleading, and therefore we used the paired catchment approach (see section Water Table Level Data Analysis).
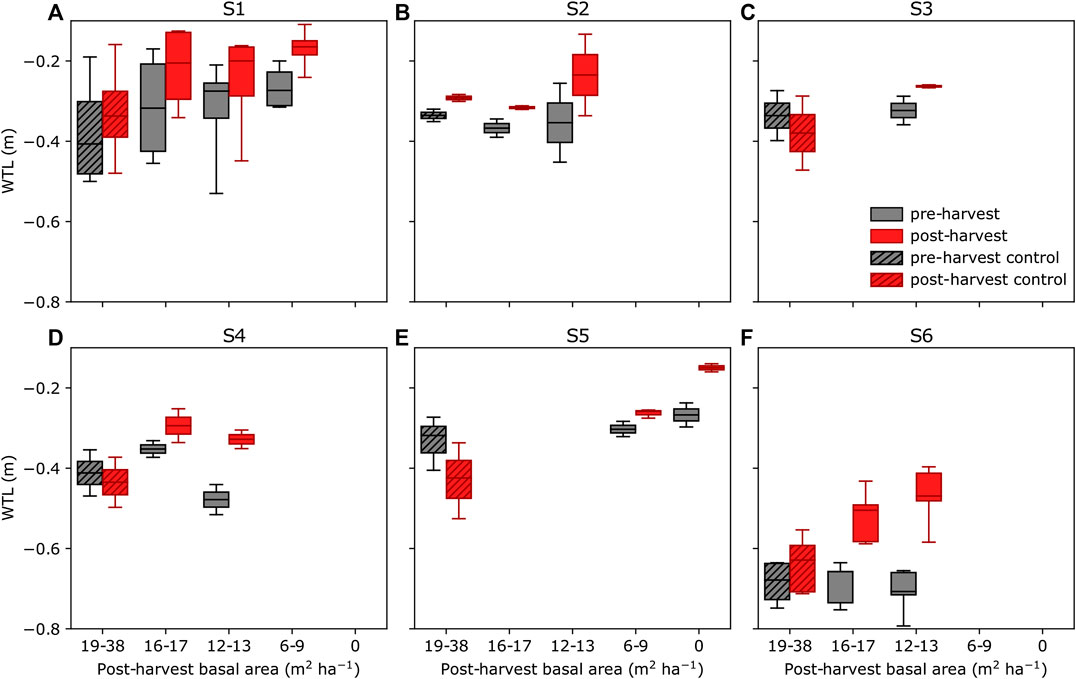
FIGURE 4. Mean water table level (WTL) before harvest (gray) and after harvest (red) at sites S1–S6 (A–F) grouped by treatments (see Figure 2) during June–October. Data from non-harvested control plots are indicated by hatching. The boxplots indicate the median, the 25–75% percentile, and the min–max range.
Generally, WTL of harvested plots rose compared to the reference WTL predicted for each plot based on their parallel control plots (Table 3). At site S1 and for the less intensive harvest at site S2, the responses were less than 0.05 m (Table 3). The response of WTL was the stronger the more intense the harvest and the deeper the reference WTL (Figure 5). This is particularly evident at sites S4 and S6 where Eq. 7 produces a good fit (Figures 5D,F). The explanatory variable describing the influence of harvest intensity (fBA) was significant (p-value < 0.01) for all sites, except S1. Figure 5 also indicates how well WTL at control plots (fBA = 0) was predicted based on their parallel control plots. Especially at site S1, the variability around the 1:1 line is large, which probably was caused by the short monitoring period before harvest, causing uncertainty to the fit of Eq. 4. Consequently, also the reference WTL of the treated plots contains uncertainty. On the other hand, Figure 4A and Table 3 also suggest that there might not be a clear response to WTL caused by harvest at site S1. The coefficients of the fitted regression model for sites S3, S5, and S6 (Figures 5C,E,F) were similar, suggesting that harvesting X% of the basal area would result in a WTL increase of about 0.55X%, where X is between 0 (i.e., no harvest) and 100 (i.e., clear-cut). The WTL responses were more pronounced at site S4, which on average had the smallest preharvest stand basal area (Figure 5D). At site S2, where only the higher intensity harvest showed a clear increase in WTL (Table 3), it is suggested that the response between WTL and stand basal area is not linear as assumed by Eq. 7.
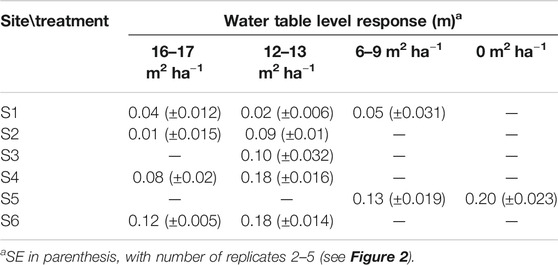
TABLE 3. Mean water table response to harvest (see Eq. 6) at sites S1–S6 grouped by treatments (i.e., postharvest stand basal area, m2 ha−1) during June–October.
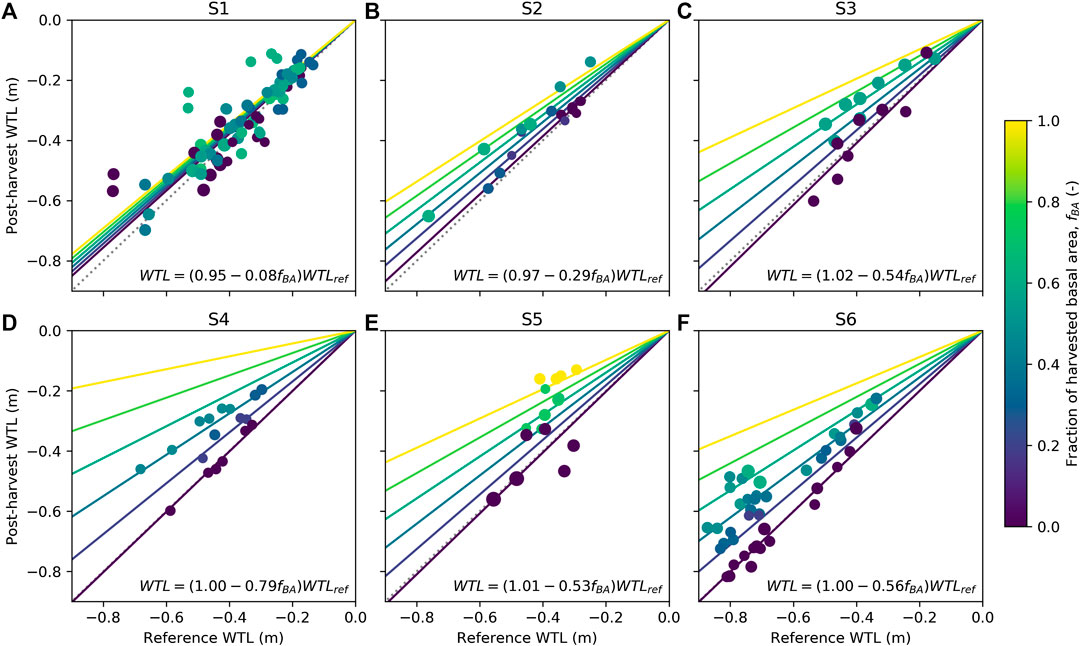
FIGURE 5. Dependency of postharvest water table level (WTL) on reference WTL (see Eqs 4 and 5) for sites S1–S6 (A–F). The colors indicate the harvest intensity and symbol size the preharvest stand basal area. Data are presented as mean yearly values for June–October separately for each plot within a site. WTL predicted by the linear regression model (see Eq. 7) is shown for six different harvest intensities (line colors correspond to harvest intensities) and the 1:1 line is shown as dotted.
Simulating Water Table Level at Study Sites
The years 2018 and 2019, coinciding with the postharvest periods, were dryer and warmer than long-term averages (Pirinen et al., 2012) in many parts of Finland. The annual mean WTL was well reproduced by the model during preharvest at all sites (Figure 6A), but after harvest, WTL was underestimated for the dry years, especially 2018 (Figure 6B). Nevertheless, the site mean WTL responses to harvests (see Eq. 6) do not show systematic bias during the dry years (Figure 6B), excluding S5 where the WTL response was overestimated by about 0.1 m. Figures 6D–F further illustrate how the variability between plots at each site is captured by the model. Before harvest, observations show larger variability between plots of the same site than the model results (Figure 6D). The between-plot variability increases after harvest, which is generally well captured (Figure 6E). Figure 6F indicates that plot-level WTL responses are well reproduced, except for sites S1 and S5. At site S1, the poor correspondence between the model results and the observation was expected based on Figure 5A. For S1, only the site annual mean WTL could be predicted by the model (Figures 6A,B), while the between-plot variability both before and after harvest remained unresolved (Figures 6D,E).
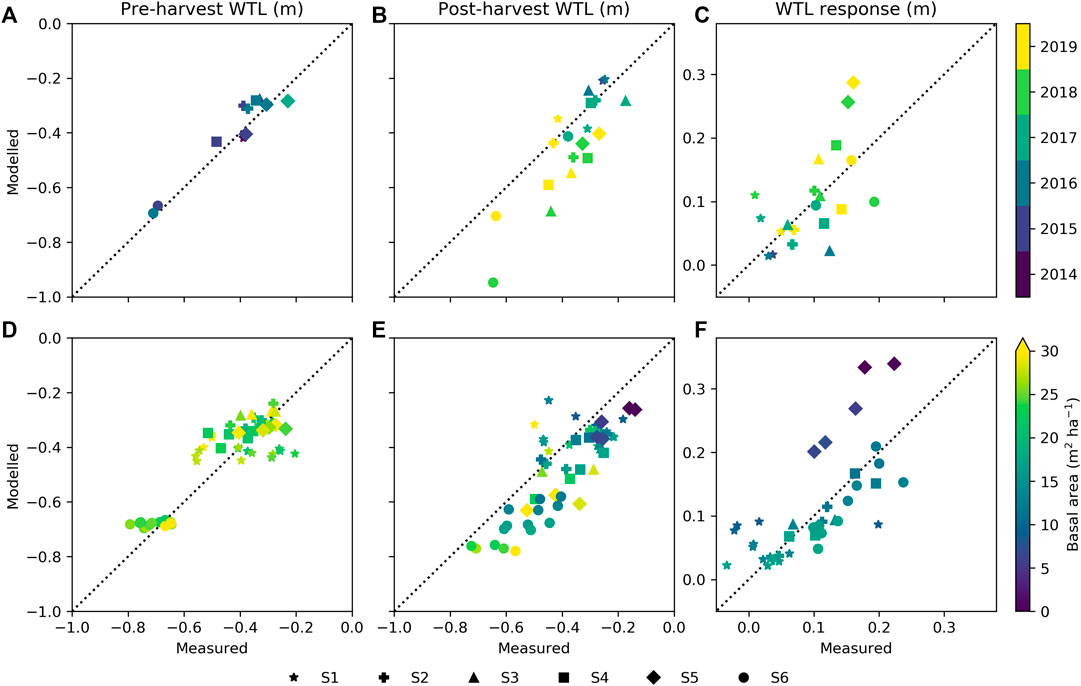
FIGURE 6. Modeled against measured water table level (WTL) for pre- and postharvest periods and WTL response to harvesting as (A–C) yearly site mean, and (D–F) plot mean with colors showing stand basal area and symbols indicating study sites. Data from period June to October are included.
The site average MAE (see Eq. 11) was 0.099 m for WTL and 0.062 m for the WTL response. To assess the impact of site- and plot-specific parameters (ditch spacing, ditch depth, peat type, stand LAI, and fraction of deciduous species LAI) and meteorology on the model performance, we run the simulations by setting each of these constant one by one. The constant value applied for the parameters corresponded to the mean of all sites, whereas the effect of meteorology was tested by setting it to that of S3 for all sites, and the peat type was set in turns to Carex and Sphagnum. The change caused to model performance (MAE for WTL) in each case is visualized in Figure 7. Meteorology had an obvious effect on model performance, increasing the MAE by 60%. Specifying stand LAI for each plot instead of a constant also had a clear impact on model performance, especially at the more southern sites. On the other hand, applying a constant LAI fraction for deciduous trees only marginally decreased model performance. The model runs with a standardized peat type (Carex/Sphagnum) show that sites S2 and S6 differ from the sites characterized by Sphagnum peat, while for S4, the effect of peat type was minor (Figure 7B). Finally, standardizing ditch spacing decreased model performance, while standardizing ditch depth slightly increased the performance (Figure 7A). This was caused especially by the improving effect ditch depth of 0.5 m had on the WTL predictions at site S5, which was characterized by the deepest ditches (see Table 1).
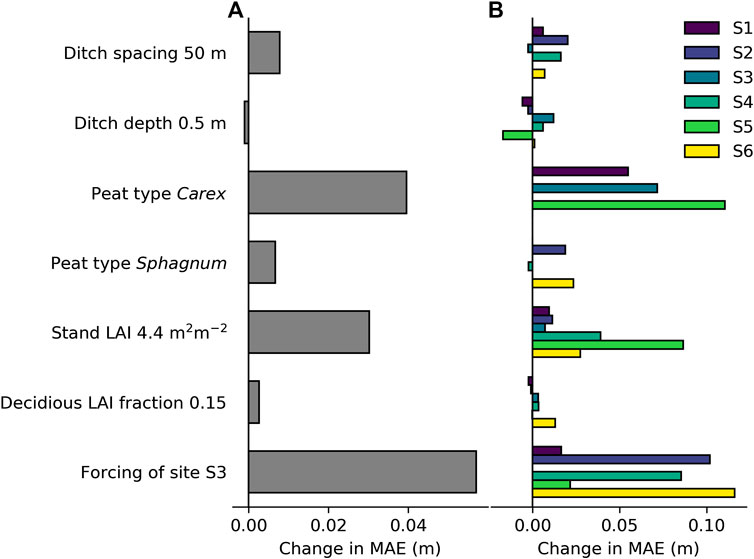
FIGURE 7. Effect of standardizing model parameters and model forcing one by one on model performance in predicted water table level: (A) Effect on site average mean absolute error (MAE; see Eq. 10) and (B) effect on MAE of sites individually. A positive change in MAE indicates impaired model performance compared to model simulations where none of the factors are standardized.
The role of site characteristics and meteorology as controls of WTL depends on the stand LAI (Figure 8). Overall, decreasing stand LAI raises the WTL, as was seen at the study sites (Figures 4, 5), but the effect is nonlinear, with a stronger impact when LAI is less than about 3.5 m2 m−2. Increasing ditch spacing and decreasing ditch depth are predicted to raise WTL independent of stand LAI (Figures 8A,B). Closer inspection showed that WTL variation caused by ditch spacing and depth was slightly stronger at stands with low LAI, suggesting that harvesting on a site with wide ditch spacing or shallow ditches leads to a slightly stronger WTL response than harvesting on a site with narrow ditch spacing or deep ditches. The other factors (Figures 8C–E) showed the opposite behavior as their effect on WTL decreased with decreasing stand LAI. This suggests that WTL responses to harvests would be more pronounced on sites with Carex compared to Sphagnum peat, with higher fraction of deciduous trees, or in southern compared to northern location. In addition to stand LAI, harvest can also alter the fraction of deciduous trees in the stand (Figure 8D). The WTL response to harvest from a stand with deciduous trees accounting for 50% of preharvest LAI may thus be higher or lower than that shown in Figure 8D if deciduous or coniferous trees, respectively, are harvested first.
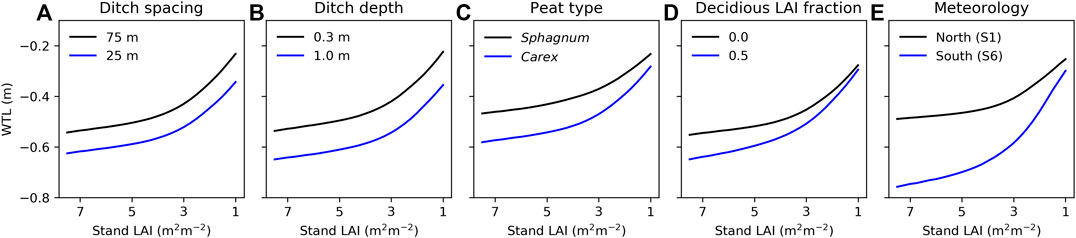
FIGURE 8. Model predicted impact of (A) ditch spacing, (B) ditch depth, (C) peat type, (D) deciduous trees fraction of stand leaf area index (LAI), and (E) meteorology on water table level (WTL) in relation to stand LAI. The ranges of the varied parameters (A–D) are set based on their variability in sites S1–S6, while other parameters correspond to the values presented in Table 2 and forcing is from site S3, except in (E) where forcing is varied from the northernmost to the southernmost site. WTL is the mean value for July–October during 2014–2019. Note that stand LAI decreases along the x-axis, describing increasing cutting intensity.
Water Table Level in Current and Future Climate
Simulations with weather forcing from global climate models for the extent of Finland during 1981–2010 showed a strong influence of latitude on WTL (Figure 9), which is caused by the strong latitudinal gradient in air temperature and global radiation (Figures 10B,C) that drive ET demand. The results further suggest that altering the stand basal area by harvests in southern Finland has larger impacts on growing season WTL than corresponding alterations in northern Finland (Figure 9), as shown also by the two-site comparison in Figure 8E. The same is predicted to hold in future climate; however, the response of WTL to stand basal area is likely to increase and the absolute WTL to decrease, especially with RCP4.5 and RCP8.5 emission scenarios (Figure 11).
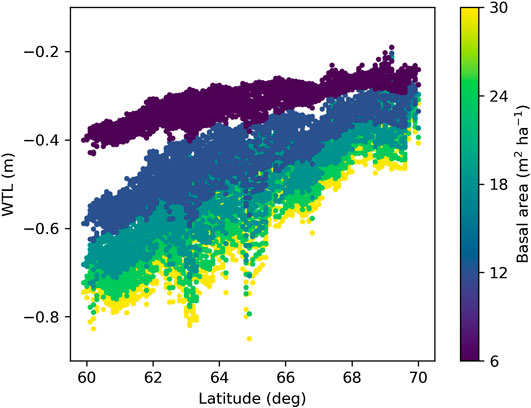
FIGURE 9. Mean June–October water table level (WTL) predicted with weather data produced by climate models for Finland under current climate (1981–2010). WTL was simulated at five different levels of the stand basal area while other parameters were fixed to values in Table 2.
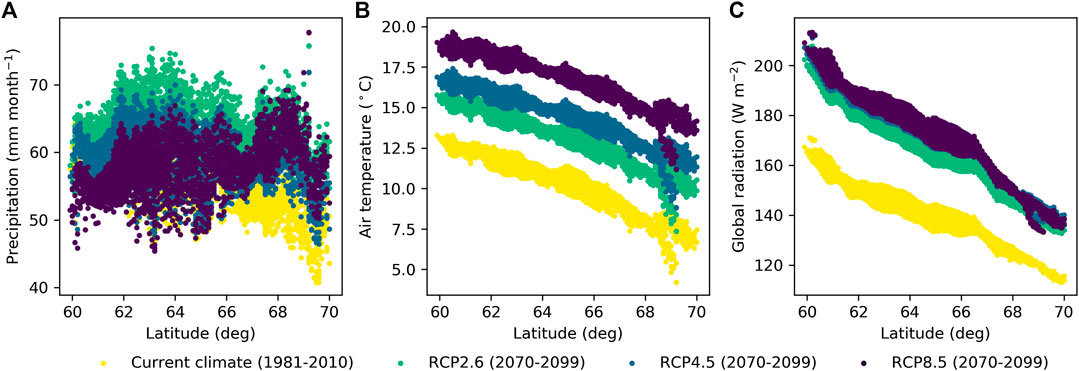
FIGURE 10. Mean June–October (A) precipitation, (B) air temperature, and (C) global radiation along latitudinal gradient in Finland derived from global climate models for current climate and future climate with representative concentration pathways RCP2.6, RCP4.5, and RCP8.5.
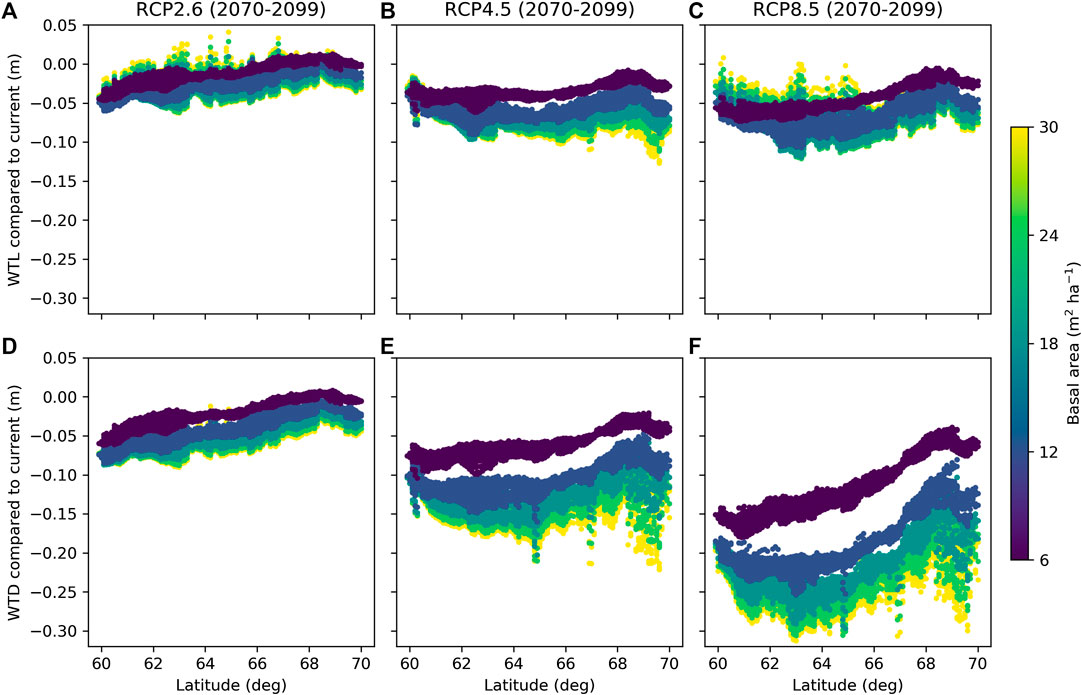
FIGURE 11. Difference between mean June and October water table level (WTL) in future and current climate predicted for RCP2.6 (A,D), RCP4.5 (B,E), and RCP8.5 (C,F), when accounting for the effect of atmospheric CO2 on canopy stomatal conductance (see Eq. 10) (A,B) or when neglecting that effect (C,D). Colors indicate five different levels of the stand basal area, while other parameters were fixed to values in Table 2.
On average, WTL lowered by 0.02 m for RCP2.6 and by 0.06 m for both RCP4.5 and RCP8.5 compared to the current climate (Figures 11A–C). Compared to the current conditions, the ET demand increases in all RCPs (Figures 10B,C) driving WTL lower, while the increase in precipitation (Figure 10A), especially in RCP2.6, counteracts this impact. In fact, Figure 11A suggests that RCP2.6 WTL in some areas, especially in stands with a low basal area, in northern Finland may even rise due to increased precipitation. The change in WTL was generally stronger the higher the stand basal area, especially for RCP4.5 and RCP8.5 at northern latitudes (Figures 11B,C). Compared to the current climate, atmospheric CO2 is predicted to increase by 18, 47, and 120% for RCP2.6, RCP4.5, and RCP8.5 by the end of the century, respectively. Omitting the effect of CO2 effect on canopy stomatal conductance results into larger changes in WTL; it lowered on average by 0.03, 0.10, and 0.19 m for RCP2.6, RCP4.5, and RCP8.5, respectively (Figures 11D–F). Despite the differences in magnitudes, results in both cases indicate that the impact of the stand basal area on mean growing season WTL increases in future climate, especially in northern Finland and for RCP4.5 and RCP8.5.
Figures 9, 11 only consider the WTL produced as average from the simulations, with weather forcing from different climate models. It is worth noting that also climate models, not only different RCPs, caused large variability to the WTL predictions in future climate. The average standard deviation caused by climate models was 0.05 m for RCP2.6 and RCP4.5, while for RCP8.5 it was 0.08 m. In current climate, WTL predictions using data from different climate models had an average standard deviation of 0.02 m. The WTL variability increased with the stand basal area and was generally higher in the south than in the north.
Discussion
Model Performance and Future Use
The model–data comparison (Figure 6) and the analysis of model performance (Figure 7) implied that the model represents the hydrological behavior of drained peatland forests well and showed WTL differences (between sites and plots) are mostly driven by meteorology and stand LAI (or basal area), but that peat type and drainage characteristics also play important roles. Describing peat type either as Carex or Sphagnum peat, which differ in water retention properties and hydraulic conductivity (Päivänen, 1973), was well founded as Carex peat sites S2 and S6 differed from other sites in their behavior (Figure 7). Ditch spacing, which varied from 25 to 75 m, had a clear impact on WTL (Figure 8A) and improved the WTL predictions at the plot and site levels (Figure 7). Increasing ditch depth from 0.3 to 1.0 m was predicted to have a larger effect on WTL than decreasing ditch spacing from 75 to 25 m (Figures 8A,B). However, the effect of ditch depth did not necessarily improve model performance, but this might be caused by the difficulty to define ditch depth in the sense the model requires it. If ditches are poorly designed with not enough slope, or vegetation ingrowth has been excessive, some section may pond water almost constantly and that decreases the gradient between the WTL and ditch water level. Also, part of the ditch depths was measured in the field, while others were extracted from the digital elevation model, and thus likely includes more uncertainties than other plot-specific parameters.
Considering that spatially interpolated instead of onsite measured weather data were used in model simulations, WTL and its response to harvests were well reproduced. Especially summertime precipitation, which can be locally extremely variable, probably caused some of the inconsistencies between modeled and measured WTL during individual years. However, the rather systematic inconsistency in the estimation of WTL during dry summers (especially 2018, see Figure 6B) was most likely caused by model structure. At most of the sites, May of 2018 was exceptionally warm and dry with high radiation intensity. The model predicted high stand transpiration rates for this period, but in reality, transpiration may have been more limited by, for example, spring recovery or soil frost. Also, the model assumption that water in the peat profile instantaneously sets to hydraulic equilibrium is likely violated during long dry periods when the capillary rise to the root zone may be cut off.
The correspondence between modeled and measured WTL of individual sites may also be affected by their special characteristics, which were not accounted for in the model, for example, thin peat layers (S1 and S3), sloping area (S1), ponding effects caused by shallow bedrock (S3), or possible inflow from surrounding areas (S5). However, such special characteristics were not our focus as we aimed to keep the model simple and easily applicable with the purpose of using it for regional analysis and as a decision support tool in practical forestry in the future. In this respect, the results were satisfactory and suggest the model can produce WTL in different meteorological locations and account for the effect of harvests, ditching parameters, and peat type with reasonable accuracy. For Finland, the parameters needed by the model can be derived from open data, such as multisource National Forest Inventory of Finland (Mäkisara et al., 2016), and map products of the National Land Survey of Finland. Future model work will aim to improve the estimation of country-level greenhouse gas fluxes from peatlands by accounting for WTL (Ojanen et al., 2010) and to estimate the potential CCF in controlling WTL and greenhouse gas exchange of these soils on the country level.
Water Table Level Responses to Harvests and Practical Implications
The study showed that selection cuttings on peatland forest sites generally decreased WTL and that the responses were larger the more intense the harvests, as shown earlier by Päivänen (1982), Heikurainen and Päivänen (1970). No harvest responses could be detected at the northernmost site S1, and only the most intensive harvest affected WTL at S2. At site S1, the short preharvest monitoring period, the thin peat layer, and the slope of some of the plots may have masked the effect of harvest on WTL. However, also according to the model, WTL responses were expected to be small at this site due to low ET demand in northern climate. The magnitude of harvest response at the more southern sites (S3–S6) was similar to Päivänen (1982), who reported an about 15, 30, and 60% increase in WTL in response to harvesting 20, 35, and 100% of the basal area, respectively, on a spruce-dominated site in southern Finland. Heikurainen and Päivänen (1970), on the other hand, showed weaker responses in a pine-dominated forest in southern Finland: harvesting 60% of stand volume resulted in a 15% rise of WTL, while removing 20% or 40% both led to an about 5% rise. In line with this, Päivänen and Sarkkola (2000) concluded that thinnings of up to 28% caused an ecologically insignificant rise in the WTL at their studied pine stand in southern Finland.
The model results showed that the relationship between tree stand and WTL is nonlinear, which has also been proposed by empirical studies (Hökkä et al., 2008b; Sarkkola et al., 2010). This is caused by the nonlinear response of ET to LAI, and is predominantly attributed to light limitations of transpiration in dense canopies (Launiainen et al., 2016). This nonlinearity may explain some of the phenomena seen at the study sites. At site S2, the less intense harvest, which had almost no effect on WTL, decreased tree stand LAI from 4.9 to 3.7 m2 m−2, which is in the LAI range where responses to WTL are much smaller than when LAI decreases below 3.5 m2 m−2, especially in the north (Figure 8E). On the other hand, at site S4, where harvest led to largest WTL responses (Figure 5D), the preharvest LAI was 3.9–4.3 m2 m−2 and after harvest 2.3–3.4 m2 m−2, that is, within the range where WTL responses to LAI are the most pronounced (Figure 8E). Thus, not only the amount of removed basal area dictate the WTL response but also the size of the preharvest stand. Additionally, the LAI to basal area ratio varies strongly between species, which implicates that conducting similar basal area–based harvests in pure pine stands would lead to different responses compared to spruce-dominated stands. However, this cannot be concluded based on our data.
In line with earlier harvest studies (Heikurainen and Päivänen, 1970; Päivänen, 1982; Päivänen and Sarkkola, 2000), we show that the WTL response to harvest is the greater the deeper the reference WTL (Figure 5), meaning that during wet summers, the effect of the tree stand is less significant than during dry summers (cf. Sarkkola et al., 2010). This effect is analogous with the changes in WTL to LAI responses in south vs. north (Figures 8E, 9A). During wet summers or in northern locations, the effect of the stand on WTL is smaller because of lower ET demand and the increased role of runoff as WTL more commonly increases close to the soil surface (Sarkkola et al., 2013). Our results suggest that in southern Finland, selection cuttings could limit WTL from dropping too deep and enhancing peat decomposition, while in the northern Finland, keeping large stands would be less concerning from climatic perspectives. Then again regarding high WTL, smaller stands are required in the south than in the north, which is in line with Sarkkola et al. (2010) and Sarkkola et al. (2013).
Model simulations with scenarios for future climate (RCP2.6, RCP4.5, and RCP8.5, 2070–2099) indicated that the atmospheric ET demand will increase and, in most cases, lead to a WTL decrease despite the predicted increase in precipitation. The WTL decrease was, however, constrained to about half (Figure 11) when the effect of increasing atmospheric CO2 concentration was accounted for (Eq. 10). Although the magnitude of the CO2 effect on leaf, plant, and stand-scale water use is still under debate (Katul et al., 2012; Keenan et al., 2013; Hasper et al., 2016; Jaramillo et al., 2018), our results indicate that this uncertainty does not affect our conclusion that growing season WTL will become deeper and the role of tree stand in controlling WTL more pronounced in future climates, especially in northern Finland and for RCP4.5 and RCP8.5. This implies that the potential of using selection cutting to control WTL will become stronger in the future also in northern Finland. Managing stand density could also provide means to avoid drought stress in trees (Bréda et al., 1995), which may become more topical in the boreal region in future climate.
Conclusions
This study quantified the effect of selection cuttings and the role of tree stand on growing season WTL in drained peatland forests. Such information is important for the proposed transition toward CCF that aims to optimize WTL for multiple ecosystem services on drained peatlands. To this end, WTL responses to various intensity harvests were monitored at six fertile Norway spruce–dominated drained peatland forests across Finland for 1–3 pretreatment and 2–5 postharvest years. The data analysis was accompanied with WTL predictions by a process-based ecohydrological model, which is proposed suitable for predicting WTL in different meteorological locations and based on relatively easily available parameters. This is beneficial for assessing the potential of CCF as tool for WTL regulation and, for example, improving estimates of country-level greenhouse gas fluxes from peatlands. Regarding the three research questions framed in the introduction, our conclusions are as follows:
(1) WTL increased after harvests at most of the studied plots. The WTL response increased with harvest intensity and depended on the meteorological conditions (wet vs. dry summer, north vs. south). Generally, selection cuttings removing about 50% of the stand basal area raised WTL by 15–40%. The nonlinear relationship between tree stand and WTL explained differences between sites, emphasizing the role of the preharvest stand basal area (or LAI).
(2) Because of lower ET in northern compared to southern Finland, the role of tree stand on WTL decreases with latitude. An identical harvest in the south compared to the north can result to an even two times larger WTL rise. This suggests the potential of CCF in avoiding high and low WTL using selection cuttings is currently more prominent in southern Finland.
(3) WTL was predicted to decrease in future climate (2070–2099) with representative concentration pathways RCP2.6, RCP4.5, and RCP8.5. The magnitude of the WTL decrease was sensitive to the way atmospheric CO2 rise is described to affect tree stomatal conductance. Especially in northern Finland and for RCP4.5 and RCP8.5, the role of tree stand on WTL was predicted to increase, which implicates that the potential for CCF is likely to increase in future climate.
Data Availability Statement
The datasets generated for this study and the model source code are available on request from the corresponding author.
Author Contributions
SS, HH, MS, RL, RM, and MN designed, established and were responsible of monitoring the harvesting experiments on the study sites. KL analyzed the WTL data and performed the modeling with assistance from SL. AL generated the stand parameters from the tree stand measurements. MP provided the weather data for the study sites and the scenario simulations. All authors participated in conceptualizing the study, analyzing the results, and writing the manuscript in the lead of KL.
Funding
This work was supported by the Academy of Finland projects CCFPeat (no. 310203), CLIMOSS (no. 296116), and SOMPA, which was funded by the Strategic Research Council at the Academy of Finland (no. 312912).
Conflict of Interest
The authors declare that the research was conducted in the absence of any commercial or financial relationships that could be construed as a potential conflict of interest.
Acknowledgments
The authors wish to acknowledge CSC—IT Center for Science, Finland, for computational resources. The Finnish Meteorological Institute is acknowledged for the meteorological data.
Supplementary Material
The Supplementary Material for this article can be found online at: https://www.frontiersin.org/articles/10.3389/feart.2020.576510/full#supplementary–material
References
Aalto, J., Pirinen, P., Heikkinen, J., and Venäläinen, A. (2013). Spatial interpolation of monthly climate data for Finland: comparing the performance of kriging and generalized additive models. Theor. Appl. Climatol. 112, 99–111. doi:10.1007/s00704-012-0716-9
Ahti, E., and Hökkä, H. (2006). “Effects of the growth and volume of Scots pine stands on the level of the water table on peat in central Finland,” in Proceedings of an international conference of hydrology and management of forested wetlands, New Bern, NC, April 8–12, 2006. (American Society of Agricultural and Biological Engineers), 37.
Ahtikoski, A., Kojola, S., Hökkä, H., and Penttilä, T. (2008). Ditch network maintenance in peatland forest as a private investment: short- and long-term effects on financial performance at stand level. Mires Peat. 3, 1–11.
Ahtikoski, A., Salminen, H., Hökkä, H., Kojola, S., and Penttilä, T. (2012). Optimising stand management on peatlands: the case of northern Finland. Can. J. For. Res. 42, 247–259. doi:10.1139/x11-174
Ainsworth, E. A., and Rogers, A. (2007). The response of photosynthesis and stomatal conductance to rising [CO2]: mechanisms and environmental interactions. Plant Cell Environ. 30, 258–270. doi:10.1111/j.1365-3040.2007.01641.x
Boczoń, A., Dudzińska, M., and Kowalska, A. (2016). Effect of thinning on evaporation of Scots pine forest. Appl. Ecol. Environ. Res. 14, 367–379. doi:10.15666/aeer/1402_367379
Bréda, N., Granier, A., and Aussenac, G. (1995). Effects of thinning on soil and tree water relations, transpiration and growth in an oak forest (Quercus petraea (Matt.) Liebl.). Tree Physiol. 15, 295–306. doi:10.1093/treephys/15.5.295
Finér, L., Mattsson, T., Joensuu, S., Koivusalo, H., Laurén, A., Makkonen, T., et al. (2010). A method for calculating nitrogen, phosphorus and sediment load from forest catchments. Helsinki, Finland: Finnish Environmental Institute. Available at: http://hdl.handle.net/10138/37973 (Accessed June 1, 2020).
Haahti, K., Marttila, H., Warsta, L., Kokkonen, T., Finér, L., and Koivusalo, H. (2016). Modeling sediment transport after ditch network maintenance of a forested peatland. Water Resour. Res. 52, 9001–9019. doi:10.1002/2016WR019442
Härkönen, S., Lehtonen, A., Manninen, T., Tuominen, S., and Peltoniemi, M. (2015). Estimating forest leaf area index using satellite images: comparison of k-NN based Landsat-NFI LAI with MODIS-RSR based LAI product for Finland. Boreal Environ. Res. 20, 181–195.
Hasper, T. B., Wallin, G., Lamba, S., Hall, M., Jaramillo, F., Laudon, H., et al. (2016). Water use by Swedish boreal forests in a changing climate. Funct. Ecol. 30, 690–699. doi:10.1111/1365-2435.12546
Heikurainen, L., and Päivänen, J. (1970). The effect of thinning, clear cutting, and fertilization on the hydrology of peatland drained for forestry. Acta For. Fenn. 104, 1–24. doi:10.14214/aff.7538
Hökkä, H., Koivusalo, H., Ahti, E., Nieminen, M., Laine, J., Saarinen, M., et al. (2008a). “Effects of tree stand transpiration and interception on site water balance in drained peatlands: experimental design and measurements.” in After wise use - the future of peatlands. Editors C. Farrell and J. Feehan (Tullamore, Ireland: International Peat Society), 169–171.
Hökkä, H., Repola, J., and Laine, J. (2008b). Quantifying the interrelationship between tree stand growth rate and water table level in drained peatland sites within Central Finland. Can. J. For. Res. 38, 1775–1783. doi:10.1139/X08-028
Hooghoudt, S. B. (1940). “General consideration of the problem of field drainage by parallel drains, ditches, watercourses, and channels,” in Publication No.7 in the series contribution to the knowledge of some physical parameters of the soil. Groningen, Netherlands: Bodemkundig Insitituut.
Jaramillo, F., Cory, N., Arheimer, B., Laudon, H., van der Velde, Y., Hasper, T. B., et al. (2018). Dominant effect of increasing forest biomass on evapotranspiration: interpretations of movement in Budyko space. Hydrol. Earth Syst. Sci. 22, 567–580. doi:10.5194/hess-22-567-2018
Joensuu, S., Ahti, E., and Vuollekoski, M. (1999). The effects of peatland forest ditch maintenance on suspended solids in runoff. Boreal Environ. Res. 4: 343–355.
Kaila, A., Laurén, A., Sarkkola, S., Koivusalo, H., Ukonmaanaho, L., O’Driscoll, C., et al. (2015). Effect of clear-felling and harvest residue removal on nitrogen and phosphorus export from drained Norway spruce mires in southern Finland. Boreal Environ. Res. 20: 693–706.
Kaila, A., Sarkkola, S., Laurén, A., Ukonmaanaho, L., Koivusalo, H., Xiao, L., et al. (2014). Phosphorus export from drained Scots pine mires after clear-felling and bioenergy harvesting. For. Ecol. Manag. 325, 99–107. doi:10.1016/j.foreco.2014.03.025
Katul, G. G., Oren, R., Manzoni, S., Higgins, C., and Parlange, M. B. (2012). Evapotranspiration: a process driving mass transport and energy exchange in the soil-plant-atmosphere-climate system. Rev. Geophys. 50, RG3002. doi:10.1029/2011RG000366
Katul, G., Manzoni, S., Palmroth, S., and Oren, R. (2010). A stomatal optimization theory to describe the effects of atmospheric CO2 on leaf photosynthesis and transpiration. Ann. Bot. 105, 431–442. doi:10.1093/aob/mcp292
Keenan, T. F., Hollinger, D. Y., Bohrer, G., Dragoni, D., Munger, J. W., Schmid, H. P., et al. (2013). Increase in forest water-use efficiency as atmospheric carbon dioxide concentrations rise. Nature 499, 324–327. doi:10.1038/nature12291
Koivusalo, H., Ahti, E., Laurén, A., Kokkonen, T., Karvonen, T., Nevalainen, R., et al. (2008). Impacts of ditch cleaning on hydrological processes in a drained peatland forest. Hydrol. Earth Syst. Sci. 12, 1211–1227. doi:10.5194/hess-12-1211-2008
Korhonen, L., Korhonen, K. T., Stenberg, P., Maltamo, M., and Rautiainen, M. (2007). Local models for forest canopy cover with beta regression. Silva Fenn. 41, 671–685. doi:10.14214/sf.275
Korkiakoski, M., Tuovinen, J.-P., Penttilä, T., Sarkkola, S., Ojanen, P., Minkkinen, K., et al. (2019). Greenhouse gas and energy fluxes in a boreal peatland forest after clear-cutting. Biogeosciences 16, 3703–3723. doi:10.5194/bg-16-3703-2019
Lagergren, F., and Lindroth, A. (2004). Variation in sapflow and stem growth in relation to tree size, competition and thinning in a mixed forest of pine and spruce in Sweden. For. Ecol. Manag. 188, 51–63. doi:10.1016/j.foreco.2003.07.018
Lappi, J. (1991). Calibration of height and volume equations with random parameters. For. Sci. 37, 781–801. doi:10.1093/forestscience/37.3.781
Launiainen, S., Guan, M., Salmivaara, A., and Kieloaho, A.-J. (2019). Modeling boreal forest evapotranspiration and water balance at stand and catchment scales: a spatial approach. Hydrol. Earth Syst. Sci. 23, 3457–3480. doi:10.5194/hess-23-3457-2019
Launiainen, S., Katul, G. G., Kolari, P., Lindroth, A., Lohila, A., Aurela, M., et al. (2016). Do the energy fluxes and surface conductance of boreal coniferous forests in Europe scale with leaf area? Global Change Biol. 22, 4096–4113. doi:10.1111/gcb.13497
Launiainen, S., Katul, G. G., Lauren, A., and Kolari, P. (2015). Coupling boreal forest CO2, H2O and energy flows by a vertically structured forest canopy - soil model with separate bryophyte layer. Ecol. Model. 312, 385–405. doi:10.1016/j.ecolmodel.2015.06.007
Lehtonen, A., Heikkinen, J., Petersson, H., Ťupek, B., Liski, E., and Mäkelä, A. (2020). Scots pine and Norway spruce foliage biomass in Finland and Sweden - testing traditional models vs. the pipe model theory. Can. J. For. Res. 50, 146–154. doi:10.1139/cjfr-2019-0211
Lehtonen, I., Kämäräinen, M., Gregow, H., Venäläinen, A., and Peltola, H. (2016). Heavy snow loads in Finnish forests respond regionally asymmetrically to projected climate change. Nat. Hazards Earth Syst. Sci. 16, 2259–2271. doi:10.5194/nhess-16-2259-2016
Mäkisara, K., Katila, M., Peräsaari, J., and Tomppo, E. (2016). The multi-source national forest inventory of Finland – methods and results 2013. Luke, Finland: Natural Resources Institute Finland. Available at: http://urn.fi/URN (Accessed June 24, 2020).
Mazza, G., Amorini, E., Cutini, A., and Manetti, M. C. (2011). The influence of thinning on rainfall interception by Pinus pinea L. in Mediterranean coastal stands (Castel Fusano-Rome). Ann. For. Sci. 68, 1323–1332. doi:10.1007/s13595-011-0142-7
Medlyn, B. E., Duursma, R. A., Eamus, D., Ellsworth, D. S., Prentice, I. C., Barton, C. V. M., et al. (2011). Reconciling the optimal and empirical approaches to modelling stomatal conductance. Global Change Biol. 17, 2134–2144. doi:10.1111/j.1365-2486.2010.02375.x
Mehtätalo, L., de-Miguel, S., and Gregoire, T. G. (2015). Modeling height-diameter curves for prediction. Can. J. For. Res. 45, 826–837. doi:10.1139/cjfr-2015-0054
Mehtätalo, L. (2019). Lmfor: functions for forest biometrics. Available at: https://CRAN.R-project.org/package=lmfor (Accessed November 1, 2019).
Nieminen, M., Ahti, E., Koivusalo, H., Mattsson, T., Sarkkola, S., and Laurén, A. (2010). Export of suspended solids and dissolved elements from peatland areas after ditch network maintenance in south-central Finland. Silva Fenn. 44, 39–49. doi:10.14214/sf.161
Nieminen, M., Hökkä, H., Laiho, R., Juutinen, A., Ahtikoski, A., Pearson, M., et al. (2018a). Could continuous cover forestry be an economically and environmentally feasible management option on drained boreal peatlands? For. Ecol. Manag. 424, 78–84. doi:10.1016/j.foreco.2018.04.046
Nieminen, M., Koskinen, M., Sarkkola, S., Laurén, A., Kaila, A., Kiikkilä, O., et al. (2015). Dissolved organic carbon export from harvested peatland forests with differing site characteristics. Water Air Soil Pollut. 226, 181. doi:10.1007/s11270-015-2444-0
Nieminen, M., Palviainen, M., Sarkkola, S., Laurén, A., Marttila, H., and Finér, L. (2017a). A synthesis of the impacts of ditch network maintenance on the quantity and quality of runoff from drained boreal peatland forests. Ambio 47, 523–534. doi:10.1007/s13280-017-0966-y
Nieminen, M., Sallantaus, T., Ukonmaanaho, L., Nieminen, T. M., and Sarkkola, S. (2017b). Nitrogen and phosphorus concentrations in discharge from drained peatland forests are increasing. Sci. Total Environ. 609, 974–981. doi:10.1016/j.scitotenv.2017.07.210
Nieminen, M., Sarkkola, S., Hellsten, S., Marttila, H., Piirainen, S., Sallantaus, T., et al. (2018b). Increasing and decreasing nitrogen and phosphorus trends in runoff from drained peatland forests-is there a legacy effect of drainage or not? Water Air Soil Pollut. 229, 286. doi:10.1007/s11270-018-3945-4
Ojanen, P., Minkkinen, K., Alm, J., and Penttilä, T. (2010). Soil-atmosphere CO2, CH4 and N2O fluxes in boreal forestry-drained peatlands. For. Ecol. Manag. 260, 411–421. doi:10.1016/j.foreco.2010.04.036
Ojanen, P., Minkkinen, K., and Penttilä, T. (2013). The current greenhouse gas impact of forestry-drained boreal peatlands. For. Ecol. Manag. 289, 201–208. doi:10.1016/j.foreco.2012.10.008
Ojanen, P., and Minkkinen, K. (2019). The dependence of net soil CO2 emissions on water table depth in boreal peatlands drained for forestry. Mires Peat. 24, 1–8. doi:10.19189/MaP.2019.OMB.StA.1751
Paavilainen, E., and Päivänen, J. (1995). Peatland forestry: ecology and principles. Berlin, Germany: Springer.
Päivänen, J. (1973). Hydraulic conductivity and water retention in peat soils. Acta For. Fenn. 129, 1–70. doi:10.14214/aff.7563
Päivänen, J., and Sarkkola, S. (2000). The effect of thinning and ditch network maintenance on the water table level in a Scots pine stand on peat soil. Suo 51, 131–138.
Päivänen, J. (1982). The effect of cutting and fertilization on the hydrology of an old forest drainage area (in Finnish). Folia For. 516, 1–19.
Pirinen, P., Simola, H., Aalto, J., Kaukoranta, J.-P., Karlsson, P., and Ruuhela, R. (2012). Tilastoja Suomen ilmastosta 1981–2010 (climatological statistics of Finland 1981–2010). Helsinki, Finland: Finnish Meteorological Institute. Available at: http://hdl.handle.net/10138/35880 (Accessed May 24, 2020).
Räisänen, J., and Räty, O. (2013). Projections of daily mean temperature variability in the future: cross-validation tests with ENSEMBLES regional climate simulations. Clim. Dynam. 41, 1553–1568. doi:10.1007/s00382-012-1515-9
Räty, O., Räisänen, J., and Ylhäisi, J. S. (2014). Evaluation of delta change and bias correction methods for future daily precipitation: intermodel cross-validation using ENSEMBLES simulations. Clim. Dynam. 42, 2287–2303. doi:10.1007/s00382-014-2130-8
Sarkkola, S., Hökkä, H., Ahti, E., Koivusalo, H., and Nieminen, M. (2012). Depth of water table prior to ditch network maintenance is a key factor for tree growth response. Scand. J. For. Res. 27, 649–658. doi:10.1080/02827581.2012.689004
Sarkkola, S., Hökkä, H., Koivusalo, H., Nieminen, M., Ahti, E., Päivänen, J., et al. (2010). Role of tree stand evapotranspiration in maintaining satisfactory drainage conditions in drained peatlands. Can. J. For. Res. 40, 1485–1496. doi:10.1139/X10-084
Sarkkola, S., Nieminen, M., Koivusalo, H., Laurén, A., Ahti, E., Launiainen, S., et al. (2013). Domination of growing-season evapotranspiration over runoff makes ditch network maintenance in mature peatland forests questionable. Mires Peat. 11, 1–11.
Skaggs, R. W. (1980). “A water management model for artificially drained soils,” in Technical bulletin. Raleigh, NC: North Carolina Agricultural Research Service, 54.
Stenberg, L., Tuukkanen, T., Finér, L., Marttila, H., Piirainen, S., Kløve, B., et al. (2015). Ditch erosion processes and sediment transport in a drained peatland forest. Ecol. Eng. 75, 421–433. doi:10.1016/j.ecoleng.2014.11.046
Keywords: continuous cover forestry, drainage, hydrology, partial harvesting, peatland forestry, selection cutting, water table level
Citation: Leppä K, Hökkä H, Laiho R, Launiainen S, Lehtonen A, Mäkipää R, Peltoniemi M, Saarinen M, Sarkkola S and Nieminen M (2020) Selection Cuttings as a Tool to Control Water Table Level in Boreal Drained Peatland Forests. Front. Earth Sci. 8:576510. doi:10.3389/feart.2020.576510
Received: 29 June 2020; Accepted: 04 September 2020;
Published: 09 October 2020.
Edited by:
Matthias Peichl, Swedish University of Agricultural Sciences, SwedenReviewed by:
Zhenming Ge, East China Normal University, ChinaHongkai Gao, East China Normal University, China
Copyright © 2020 Haahti, Hökkä, Laiho, Launiainen, Lehtonen, Mäkipää, Peltoniemi, Saarinen, Sarkkola and Nieminen. This is an open-access article distributed under the terms of the Creative Commons Attribution License (CC BY). The use, distribution or reproduction in other forums is permitted, provided the original author(s) and the copyright owner(s) are credited and that the original publication in this journal is cited, in accordance with accepted academic practice. No use, distribution or reproduction is permitted which does not comply with these terms.
*Correspondence: Kersti Leppä, kersti.leppa@luke.fi