Using Environmental DNA to Detect Whales and Dolphins in the New York Bight
 S. Elizabeth Alter1,2*
  Carissa D. King3 Emily Chou3
  Sam Chew Chin2
  Melinda Rekdahl3 Howard C. Rosenbaum3,4*
- 1Department of Biology and Chemistry, California State University Monterey Bay, Seaside, CA, United States
- 2The Graduate Center, City University of New York, New York, NY, United States
- 3The Wildlife Conservation Society, Ocean Giants Program, Bronx, NY, United States
- 4Ecology, Evolution, and Environmental Biology Department, Columbia University, New York, NY, United States
Determining how cetaceans and other threatened marine animals use coastal habitats is critical to the effective conservation of these species. Environmental DNA (eDNA) is an emerging tool that can potentially be used to detect cetaceans over broad spatial and temporal scales. In particular, eDNA may present a useful complementary method for monitoring their presence during visual surveys in nearshore areas, and for co-detecting prey. In conjunction with ongoing visual surveys, we tested the ability of eDNA metabarcoding to detect the presence and identity of cetaceans in the New York Bight (NYB), and to identify fish species (potential prey) present in the area. In almost all cases in which humpback whales and dolphins were visually observed, DNA from these species was also detected in water samples. To assess eDNA degradation over time, we took samples in the same location 15 and 30 min after a sighting in seven instances, and found that eDNA often, but not always, dropped to low levels after 30 min. Atlantic menhaden were detected in all samples and comprised the majority of fish sequences in most samples, in agreement with observations of large aggregations of this important prey species in the NYB. While additional data are needed to better understand how factors such as behavior and oceanographic conditions contribute to the longevity of eDNA signals, these results add to a growing body of work indicating that eDNA is a promising tool to complement visual and acoustic surveys of marine megafauna.
Introduction
Effective conservation and management of cetaceans and other wide-ranging marine species depends on knowledge of when, where and how species use habitats, which can be challenging to assess across large temporal and spatial scales (e.g., Sequeira et al., 2019). Meeting this challenge will require a combination of observational tools to better understand how human activities such as shipping and fishing affect cetacean habitat use and ocean ecosystem health across these scales. Standard methods for assessing cetacean distribution and movement include boat-based surveys, aerial surveys, satellite-tracked tags, and passive acoustic monitoring (PAM) (e.g., Van Parijs et al., 2009; Clark et al., 2010; Kaschner et al., 2012; Kanaji et al., 2017; Fiedler et al., 2018; Frasier et al., 2021; King et al., 2021). Combining these methods with novel techniques that permit detection of non-vocalizing, non-visible individuals may offer the most effective means of surveying large areas for these highly mobile species.
Environmental DNA (eDNA) analysis is an emerging tool that allows detection of species using environmental (e.g., water) samples alone. Though the precise spatial scale over which eDNA signals are integrated in marine environments remains uncertain, most studies suggest that eDNA degrades quickly in seawater and is thus a reasonable indicator of recent presence (hours–days) (Thomsen et al., 2012; Port et al., 2016; Collins et al., 2018; Murakami et al., 2019). eDNA analyses have now been applied to a variety of marine megafauna (Lafferty et al., 2018; Harper et al., 2020) including cetaceans such as harbor porpoise (Phocoena phocoena) (Foote et al., 2012; Parsons et al., 2018), killer whales (Orcinus orca) (Baker et al., 2018; Pinfield et al., 2019), and bowhead whales (Székely et al., 2021). If eDNA can be optimized to detect baleen whales and odontocetes successfully, this approach could potentially be combined with other survey methods to better inform area-based management, detect prey and other species interactions, and to identify specific individuals.
In this study, we sought to test the utility of eDNA to detect cetaceans and co-occurring fish species in the New York Bight (NYB), as part of ongoing cetacean survey work conducted by the Wildlife Conservation Society (King et al., 2021). The NYB leads into the heavily trafficked Port of New York and New Jersey. This region lies within the mid-Atlantic migratory corridor for several species, including humpback whales (Megaptera novaeangliae), and has seen increased observations of whales over the last decade (Brown et al., 2018; King et al., 2021). The need for adequate survey data in areas such as the NYB has taken on increased urgency as population ranges shift due to changing oceanographic and climatic conditions (MacLeod, 2009; Lambert et al., 2011; Tulloch et al., 2019). The objectives of this study were to: (1) determine whether eDNA can be used to detect cetacean species that were observed visually; (2) assess the period over which the eDNA signal, as assessed by metabarcoding methods, falls after the individual is no longer visually observed; (3) investigate whether eDNA can also be used to identify co-occurring fish (potential prey) species.
Methods
Sample Collection
We sampled water from the surface during boat-based visual surveys for cetaceans in the NYB during 2018–2019 (Figure 1). Surveys were carried out with a vessel speed of between 13 and 17 knots and Beaufort 3 or less, two to four observers, 360° coverage and scanning to the horizon, generally without use of binoculars (additional details in King et al., 2021). Upon sighting, we recorded information on the GPS location, approximate distance to individual(s), species, approximate number in group, and behavior (feeding, traveling, diving, resting, etc.). Water samples were obtained by filling a sterile 1L Nalgene polypropylene bottle with seawater off the side of the vessel closest to the individual at the air-surface interface. Where feasible, water was collected directly in the fluke print, a distinctive ripple on the water surface created immediately after a dive. We used sterile gloves during water collection, and placed samples into sterile Ziplocs, to prevent cross-sample contamination. Field controls (empty 1L bottles opened to the air in the field, treated in the same manner as other samples) were also collected on three different occasions.
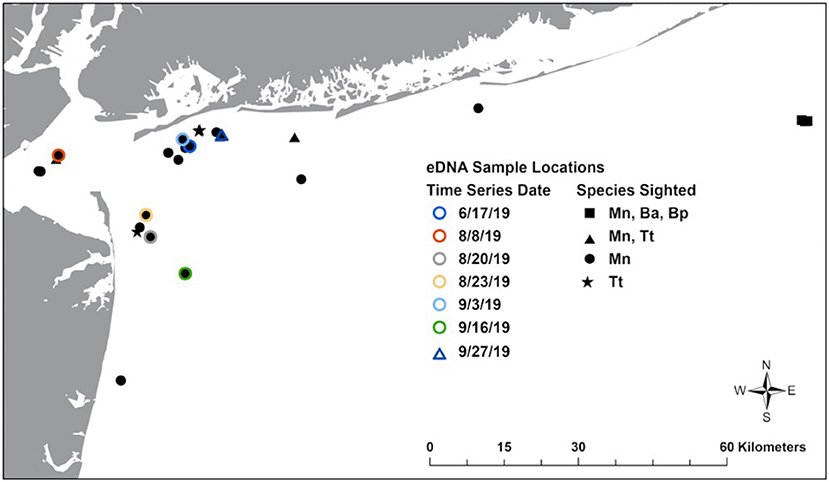
Figure 1. Map of New York Bight showing locations where eDNA samples were collected in association with sightings. Mn, humpback whale; Ba, common minke whale; Bp, fin whale; Tt, bottlenose dolphin.
To assess the length of time that eDNA remains detectable at a given location, where possible we also collected a series of samples in the sighting location at three time points: immediately after sighting, 15 min post-sighting, and 30 min post-sighting. GPS positions were used to mark a waypoint and return to each location at the time intervals.
Sample Processing
Water samples were filtered immediately upon return (<10 h after collection) or frozen at −80°C until processing. Field control bottles were filled with Milli-Q water and filtered and processed along with samples. Samples were filtered using 0.45 μm glass filters (Millipore, USA). DNA extractions were performed in a PCR-free lab in a dedicated hood with UV treatment. Pipettors and tips were sterilized via UV and surfaces were cleaned between extractions with a 10% bleach solution. Total DNA was extracted from filters using PowerWater kit (Qiagen, USA) and genomic DNA concentrations assessed using a Qubit 4 Fluorometer (using the dsDNA HS Kit) (Thermo Fisher, USA). A fragment of the mitochondrial 12S gene was amplified from extracted DNA using primers from Riaz et al. (2011) and successful amplifications were used to prepare libraries for sequencing on an Illumina HiSeq platform at Genewiz, Inc (Plainfield NJ) (details in Supplementary Materials). A subset of samples collected early in the project in 2018 from multi-species aggregations were amplified using the same primers, but sequenced at lower coverage using the Amp-EZ (Genewiz) library preparation and sequencing protocol. Please see SI for additional details.
Data Analysis
Data cleaning, demultiplexing and filtering were performed using the OBITools pipeline (Boyer et al., 2016; Valentini et al., 2016). Sequences <20 bp and those with <10 occurrences were removed. Within each sample, we used OBIUNIQ to cluster identical samples and the ECOTAG program to assign taxonomy to remaining sequences, using the NCBI Reference Sequence Release 233. We set the following thresholds for discarding sequences: sequences with frequency <0.002 per taxon and library, sequences with frequency <0.0001 per taxon, and non-target obvious contaminants (e.g., humans, ungulates) (De Barba et al., 2014). Molecular operational taxonomic units (MOTUs) were identified to species (99–100% match), genus (90–98%), or family (80–90%).
Though metabarcoding is primarily used to obtain occurrence data and is less well-suited for assessing abundance due to potential PCR bias (e.g., Nichols et al., 2018), metabarcoding data have been shown in some cases to reflect coarse patterns in abundance (Di Muri et al., 2020; Stoeckle et al., 2021), suggesting it may be possible to infer relative information on the starting number of molecules in a sample. To normalize read counts across samples taken at the same location across different time points, we converted read counts to proportions on filtered datasets using the calc_obs_props function in the R package metacoder (Foster et al., 2017).
Results
We collected and processed a total of 70 samples taken on 11 days across summer and fall surveys in 2018 and 2019 (Table 1 and Supplementary Table 1), yielding an average of 2.176 million reads per sample. Most samples were taken near sightings of humpback whales, and in all these cases, humpback DNA was also detected in at least one of the three samples taken in the time series (Table 1). For bottlenose dolphins (Tursiops truncatus), eDNA was detected in six of seven series in which sightings of that species occurred, as well as in four samples in which dolphins were not observed visually. Additional cetaceans detected infrequently using eDNA included fin and minke whales (which were also visually sighted during a mixed-species feeding aggregation on July 30 2018) as well as the porpoise family Phocoenidae. While the latter MOTU was only identifiable to family and no corresponding individual was sighted, we infer that it represents harbor porpoise (Phocoena phocoena) based on acoustic detections in the same area (M. Rekdahl, personal communication) and the fact that it is the only member of this family found in the North Atlantic. Overall, the percentage of cetacean sequences in each sample ranged between 0 and 97.2% (mean across all samples = 16%) with the remaining sequences identified as other marine vertebrates (fishes, see below).
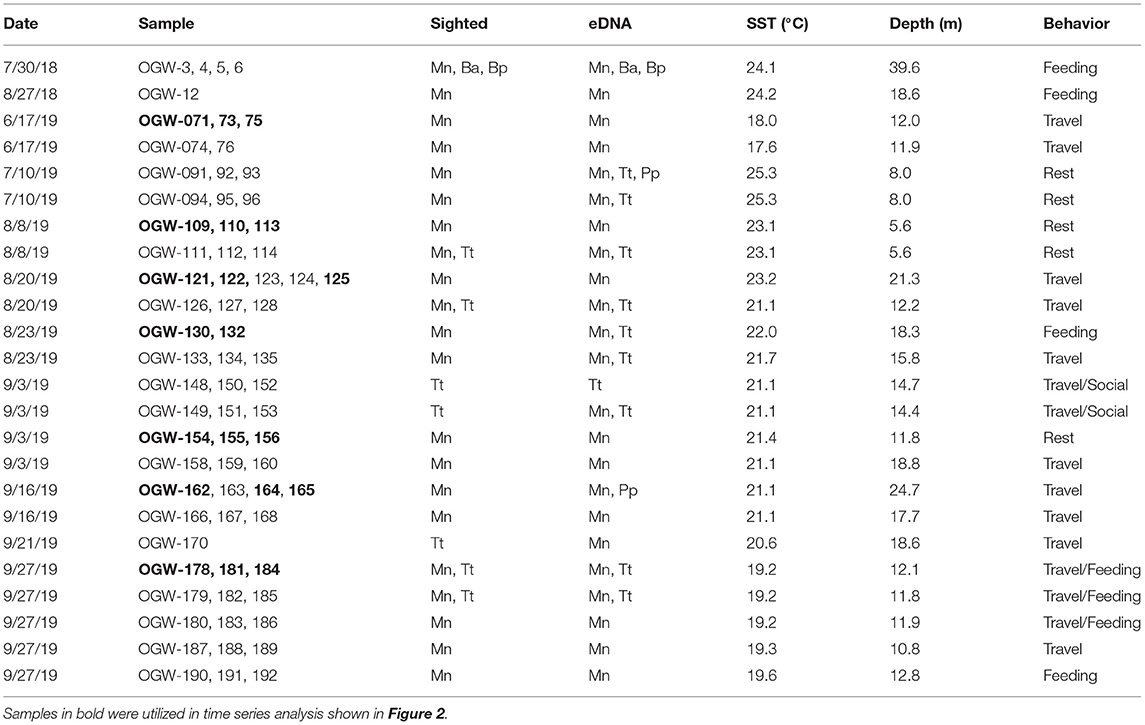
Table 1. Positive detections comparing eDNA detected from marine mammals with visual sightings (Mn, humpback whale; Ba, common minke whale; Bp, fin whale; Tt, bottlenose dolphin; Pp, harbor porpoise) SST, Sea surface temperature.
For humpback whales, we analyzed data from seven independent time series, with each series taken on a different day, in which samples were obtained at 0, 15 and 30-min intervals at the same georeferenced location following a whale sighting, by comparing the proportion of reads assigned to humpback whale across the three time points (transformed to percentages, Figure 2). Four of the time series showed a decline in humpback whale eDNA to negligible levels by the 15- or 30-min intervals (Figure 2), and two had overall low levels of humpback DNA across all time points. In one series (16-Sept 2019), the proportion of reads increased from 0.04 (0 min) to 0.99 (15 min). In this case, the whale was observed defecating immediately after the initial sample was collected. A smaller increase in proportion of reads between 15 and 30 min (from 0.007 to 0.16) in the samples taken on 20-Aug 2019 may likewise have resulted from dissipation of feces (unobserved in this case), or alternatively could have resulted from stochastic effects during PCR.
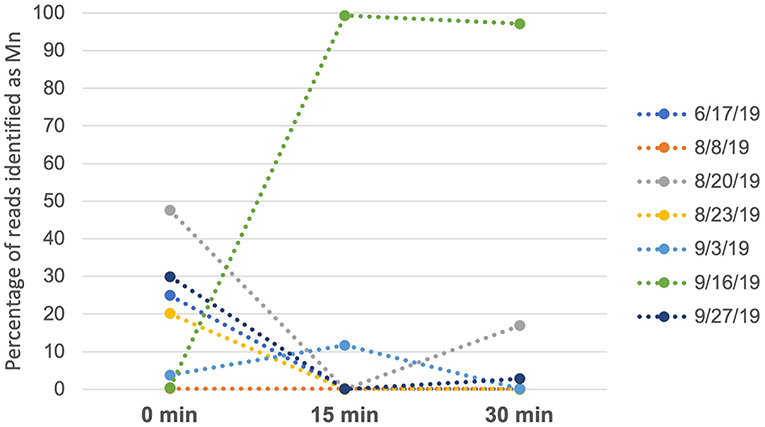
Figure 2. Percentage of reads identified as humpback whale across sampling events on each of 7 days. Samples were taken at 0 min (initial sighting), 15 min and 30 min. On 9/16/19, 15- and 30-min samples were taken immediately after the individual whale defecated.
We also detected non-mammalian vertebrates including 28 fish taxa, with 20 identifiable to species (Figure 3). Fishes comprised between 2.8 and 100% of sequences after removing contaminants. For each of two genera (hake, Urophycis and sand lance, Ammodytes), 12S sequences are unable to distinguish between two species within the genus and so both are listed as possibilities in Figure 3. Atlantic menhaden (Brevoortia tyrannus) dominated nearly every sample by percentage: considering fish reads only, menhaden occurred across 100% of samples and averaged 94% (range 5–99%). eDNA from additional potential prey species included bay anchovy (Anchoa mitchilli), sand lance (Ammodytes spp), hake (Urophycis regia), and striped searobin (Prionotus evolans).
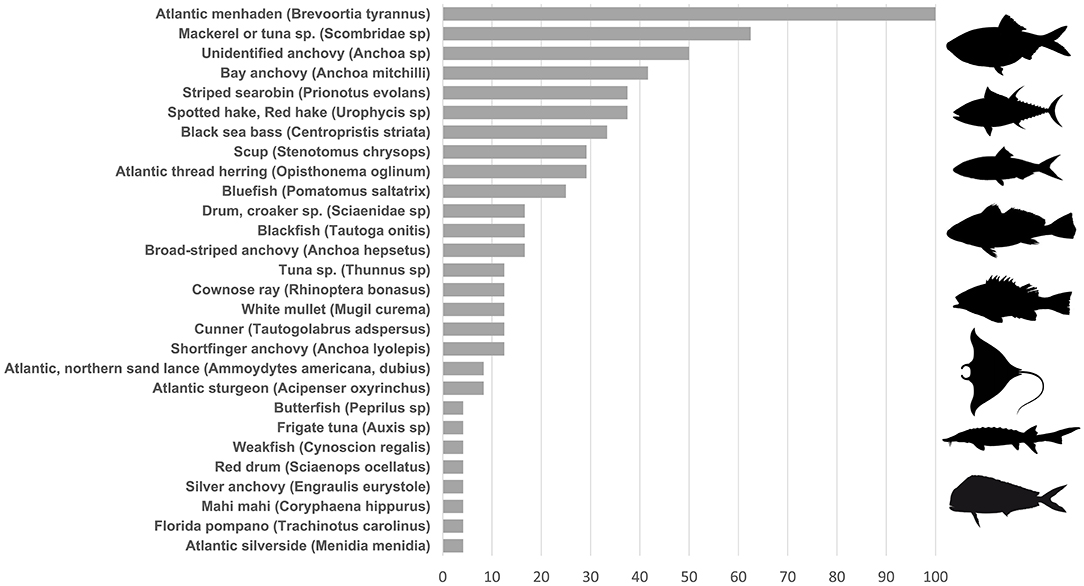
Figure 3. Percent of samples from which eDNA from each fish taxon was recovered.
Discussion
The NYB is considered one of the world's most human-influenced coastal habitats. However, while increasing information is emerging about how cetaceans use this habitat (e.g., King et al., 2021; Zoidis et al., 2021), a better understanding is still needed as to how distributions might change in the future under continuing oceanographic and climatic shifts, as well as forthcoming renewable energy development. In this study, we tested the utility of eDNA to detect cetaceans, as well as co-occurring fish species, in the NYB. Successful detections paired with visual sightings suggest that this technology represents a useful complement to ongoing cetacean survey techniques, including potentially PAM surveys. With the efforts to establish index sites along the U.S. Eastern Seaboard in advance of renewable energy development, suites of observational tools will be needed. For those surveys that include an on-water component (e.g., vessel-based surveys), implementing water collection for eDNA analysis may offer promising results. eDNA datasets could also be readily contrasted with PAM and other survey techniques with the appropriate study design.
Though eDNA has increasingly been used as a tool to survey marine biodiversity (Closek et al., 2019; Djurhuus et al., 2020; Stoeckle et al., 2021), including opportunistic detections of whales and dolphins, relatively few studies have tested the utility of this method to detect cetaceans when paired with other survey methods. Our results are consistent with previous studies generally showing successful retrieval of cetacean eDNA when samples are collected at close range to individuals (Foote et al., 2012; Baker et al., 2018; Székely et al., 2021). To date, one study has reported false negatives at close range (Pinfield et al., 2019). We found strong eDNA signals in fluke prints of humpback whales, even though we used a less sensitive method (metabarcoding) than previous studies (qPCR/ddPCR). These findings suggest that eDNA has good potential for detecting cetaceans, but more sensitive methods may be required for detection of some species and under certain oceanographic conditions.
Persistence of eDNA
Quantifying the longevity of an eDNA signal is critical to determining the utility of this method for different management purposes (Barnes et al., 2014; Ruppert et al., 2019), but this quantification is complex due to the interplay of factors affecting the decay and movement of eDNA including hydrology, temperature, salinity, microbes, and turbidity (Harrison et al., 2019). In turbulent marine environments, it is difficult to disentangle the effects of time (degradation of biomolecules) and space (dispersion due to water movement) on detection rate over time. Previous studies on cetacean eDNA have yielded variable results regarding eDNA longevity. Whereas, Foote et al. (2012) did not find harbor porpoise DNA >10 m from a captive pen, suggesting rapid dispersal/degradation, Baker et al. (2018) recovered eDNA from killer whales up to 2 h after encounters. Székely et al. (2021) found that the amount of bowhead whale DNA dropped by ~4.5-fold 10 min after a dive. Our results generally showed a decline in eDNA over the 15- and 30-min intervals, with eDNA very low in four of seven cases after 15 min. This fast rate of dissipation is expected in dynamic coastal waters of the open ocean, where even a sluggish current of 0.05 m/s could potentially move a particle up to 45 m over 15 min. However, it is possible we might have detected more humpback DNA at 15 and 30 min using more sensitive methods such as qPCR rather than metabarcoding. In addition, the primers used in this study are designed to amplify vertebrates and therefore amplified fish DNA as well, potentially reducing the amount of marine mammal DNA captured; use of specialized primers for mammals such as MiMammal (Ushio et al., 2017) could be beneficial for added sensitivity to marine mammals.
Influence of Species and Behavior on eDNA Shedding
Our findings align with previous studies indicating that some cetacean species, and potentially some behaviors, may yield more eDNA than others. Baleen whales are likely shedding more DNA than smaller cetaceans, especially when breaching, feeding, socializing, or diving. With regard to behaviors, we obtained the largest and longest-persisting eDNA signal from an individual that was observed defecating immediately after the sample was collected, which is in line with previous studies suggesting feces may be an important source of eDNA (Klymus et al., 2015; Baker et al., 2018). We found resting, socializing, feeding and traveling animals also generated detectable levels of eDNA.
Fish Diversity and Mixed-Species Aggregations
The overwhelming dominance of Atlantic menhaden in the metabarcoding results across most samples is consistent with the large biomass of this species in summer and fall months in the NYB (Lucca and Warren, 2019), and may be linked to the increasing number of observations of humpback whales in this region (Brown et al., 2018; King et al., 2021). We directly observed Atlantic menhaden in at least seven of our cetacean sightings, in line with findings by Brown et al. (2018) who observed menhaden in ~20% of humpback whale sightings in New York waters, and King et al. (2021) who observed menhaden as the primary prey type in nearly two-thirds of foraging encounters in nearshore waters of the NYB. Our eDNA results from a mixed-species feeding aggregation also indicated the presence of numerous cetacean and fish species that were visually observed (including fin and minke whales, tuna, and shearwaters) and other predators. These results highlight the potential for using eDNA to co-localize whales and dolphins with prey species, which could aid understanding of the prey base targeted by cetaceans and other predators.
Conclusions
Because impacts to cetaceans and other marine life from human activities occur across a wide range of geographic and temporal scales, survey methods are needed that allow us to monitor trends frequently and widely. Overall, the results presented here indicate that eDNA has good potential as a complementary tool for cetacean surveys, especially for detecting large whales and assessing prey or co-distributed species of interest. In addition, the possibility of collecting population genetic data and identifying particular individuals using this non-invasive method would have particular utility for threatened species (Székely et al., 2021).
While this study adds to the literature on cetacean eDNA, more data are needed to better understand the relationships between eDNA retrieval and factors including species identity, behavior, and environment. To this end, we encourage the cetacean research community to develop a research agenda that takes advantage of ongoing visual and acoustic survey work around the world, targeting a diversity of species and conditions. While there are still important challenges to be addressed regarding how to implement eDNA surveys for marine mammals across very large geographic regions, possible solutions include sampling from commercial vessels (e.g., ferries; Valsecchi et al., 2021), as part of large-scale marine biodiversity surveys (Closek et al., 2019) or using autonomous underwater vehicles or stationary monitoring devices (Yamahara et al., 2019; Hansen et al., 2020). Given the scale of renewable energy development on both coasts of the US, eDNA could contribute to a range of monitoring efforts. By generating eDNA data in parallel with survey data, it will be possible to gain a clearer understanding of the utility and limitations of eDNA and how it can be used in management and conservation contexts to monitor species of conservation concern over large marine ecosystems.
Data Availability Statement
The data found in this article will be made available without undue reservation, and is deposited in the NCBI/BioProject repository, accession number PRJNA797106.
Ethics Statement
Ethical review and approval was not required for the animal study because water samples were collected as part of ongoing marine mammal survey work permitted under NMFS Federal Research Permits Nos. 14809, 18786-03, and 18786-04 (see King et al., 2021). DNA from vertebrate animals was obtained from water samples only. No contact with animals occurred as part of this study.
Author Contributions
SEA and HR conceived the study and drafted the manuscript. CK, EC, MR, SC, HR, and SEA performed sample collection and filtration. SEA and SC performed lab analyses and data analysis. All authors revised, edited the manuscript, contributed to the article, and approved the submitted version.
Funding
This research was primarily funded by a grant from the Richard Lounsbery Foundation to HR, SEA, and MR. We would like to acknowledge additional financial support from the Hudson River Foundation (Grant Number: 001/17E).
Conflict of Interest
The authors declare that the research was conducted in the absence of any commercial or financial relationships that could be construed as a potential conflict of interest.
Publisher's Note
All claims expressed in this article are solely those of the authors and do not necessarily represent those of their affiliated organizations, or those of the publisher, the editors and the reviewers. Any product that may be evaluated in this article, or claim that may be made by its manufacturer, is not guaranteed or endorsed by the publisher.
Acknowledgments
We gratefully acknowledge valuable assistance from the following individuals who helped make this project a success: Dennis Suszkowski, Jim Lodge, Rob Pirani, Clay Hiles, Helena Andreyko, the New York Seascape Team, Jim Miller, Joe DePalma, John McMurray, and Dana Tricarico. We also thank those that joined us on survey days where water samples were collected including Sarah Trabue, Carl LoBue, Danielle Brown, Kristi Collom, and Gabriella Cavarjal.
Supplementary Material
The Supplementary Material for this article can be found online at: https://www.frontiersin.org/articles/10.3389/fcosc.2022.820377/full#supplementary-material
References
Baker, C. S., Steel, D., Nieukirk, S., and Klinck, H. (2018). Environmental DNA (eDNA) from the wake of the whales: droplet digital PCR for detection and species identification. Front. Mar. Sci. 5:133. doi: 10.3389/fmars.2018.00133
Barnes, M. A., Turner, C. R., Jerde, C. L., Renshaw, M. A., Chadderton, W. L., and Lodge, D. M. (2014). Environmental conditions influence eDNA persistence in aquatic systems. Environ. Sci. Technol. 48, 1819–1827. doi: 10.1021/es404734p
Boyer, F., Mercier, C., Bonin, A., Le Bras, Y., Taberlet, P., and Coissac, E. (2016). obitools: A unix-inspired software package for DNA metabarcoding. Mol. Ecol. Resour. 16, 176–182. doi: 10.1111/1755-0998.12428
Brown, D. M., Robbins, J., Sieswerda, P. L., Schoelkopf, R., and Parsons, E. C. M. (2018). Humpback whale (Megaptera novaeangliae) sightings in the New York-New Jersey Harbor Estuary. Mar. Mamm. Sci. 34, 250–257. doi: 10.1111/mms.12450
Clark, C. W., Brown, M. W., and Corkeron, P. (2010). Visual and acoustic surveys for North Atlantic right whales, Eubalaena glacialis, in Cape Cod Bay, Massachusetts, 2001-2005: Management implications. Mar. Mamm. Sci. 26, 837–854. doi: 10.1111/j.1748-7692.2010.00376.x
Closek, C. J., Santora, J. A., Starks, H. A., Schroeder, I. D., Andruszkiewicz, E. A., Sakuma, K. M., et al. (2019). Marine vertebrate biodiversity and distribution within the central California Current using environmental DNA (eDNA) metabarcoding and ecosystem surveys. Front. Mar. Sci. 6:732. doi: 10.3389/fmars.2019.00732
Collins, R. A., Wangensteen, O. S., O'Gorman, E. J., Mariani, S., Sims, D. W., and Genner, M. J. (2018). Persistence of environmental DNA in marine systems. Commun. Biol. 1:185. doi: 10.1038/s42003-018-0192-6
De Barba, M., Miquel, C., Boyer, F., Mercier, C., Rioux, D., Coissac, E., et al. (2014). DNA metabarcoding multiplexing and validation of data accuracy for diet assessment: Application to omnivorous diet. Mol. Ecol. Resour. 14, 306–323. doi: 10.1111/1755-0998.12188
Di Muri, C., Lawson Handley, L., Bean, C. W., Li, J., Peirson, G., Sellers, G. S., et al. (2020). Read counts from environmental DNA (eDNA) metabarcoding reflect fish abundance and biomass in drained ponds. Metabarcoding Metagenomics 4, 97–112. doi: 10.3897/mbmg.4.56959
Djurhuus, A., Closek, C. J., Kelly, R. P., Pitz, K. J., Michisaki, R. P., Starks, H. A., et al. (2020). Environmental DNA reveals seasonal shifts and potential interactions in a marine community. Nat. Commun. 11, −9. doi: 10.1038/s41467-019-14105-1
Fiedler, P. C., Redfern, J. V., Forney, K. A., Palacios, D. M., Sheredy, C., Rasmussen, K., et al. (2018). Prediction of large whale distributions: a comparison of presence-absence and presence-only modeling techniques. Front. Mar. Sci. 5:419. doi: 10.3389/fmars.2018.00419
Foote, A. D., Thomsen, P. F., Sveegaard, S., Wahlberg, M., Kielgast, J., Kyhn, L. A., et al. (2012). Investigating the potential use of environmental DNA (eDNA) for genetic monitoring of marine mammals. PLoS ONE 7:e41781. doi: 10.1371/journal.pone.0041781
Foster, Z. S. L., Sharpton, T. J., and Grünwald, N. J. (2017). Metacoder: An R package for visualization and manipulation of community taxonomic diversity data. PLOS Comput. Biol. 13:e1005404. doi: 10.1371/journal.pcbi.1005404
Frasier, K. E., Garrison, L. P., Soldevilla, M. S., Wiggins, S. M., and Hildebrand, J. A. (2021). Cetacean distribution models based on visual and passive acoustic data. Sci. Rep. 11, 1–16. doi: 10.1038/s41598-021-87577-1
Hansen, B. K., Jacobsen, M. W., Middelboe, A. L., Preston, C. M., Marin, R., Bekkevold, D., et al. (2020). Remote, autonomous real-time monitoring of environmental DNA from commercial fish. Sci. Rep. 10, 1–8. doi: 10.1038/s41598-020-70206-8
Harper, K. J., Goodwin, K. D., Harper, L. R., LaCasella, E. L., Frey, A., and Dutton, P. H. (2020). Finding crush: environmental DNA analysis as a tool for tracking the green sea turtle Chelonia mydas in a marine estuary. Front. Mar. Sci. 6:810. doi: 10.3389/fmars.2019.00810
Harrison, J. B., Sunday, J. M., and Rogers, S. M. (2019). Predicting the fate of eDNA in the environment and implications for studying biodiversity. Proc. R. Soc. B 286:20191409. doi: 10.1098/rspb.2019.1409
Kanaji, Y., Okazaki, M., and Miyashita, T. (2017). Spatial patterns of distribution, abundance, and species diversity of small odontocetes estimated using density surface modeling with line transect sampling. Deep Sea Res. Part II: Top. Stud. Oceanography 140, 151–162. doi: 10.1016/j.dsr2.2016.05.014
Kaschner, K., Quick, N. J., Jewell, R., Williams, R., and Harris, C. M. (2012). Global coverage of cetacean line-transect surveys: status quo, data gaps and future challenges. PLoS ONE 7:e44075. doi: 10.1371/journal.pone.0044075
King, C. D., Chou, E., Rekdahl, M. L., Trabue, S. G., and Rosenbaum, H. C. (2021). Baleen whale distribution, behaviour and overlap with anthropogenic activity in coastal regions of the New York Bight. Marine Biol. Res. 17, 380–400. doi: 10.1080/17451000.2021.1967993
Klymus, K. E., Richter, C. A., Chapman, D. C., and Paukert, C. (2015). Quantification of eDNA shedding rates from invasive bighead carp Hypophthalmichthys nobilis and silver carp Hypophthalmichthys molitrix. Biol. Conserv. 183, 77–84. doi: 10.1016/j.biocon.2014.11.020
Lafferty, K. D., Benesh, K. C., Mahon, A. R., Jerde, C. L., and Lowe, C. G. (2018). Detecting southern California's white sharks with environmental DNA. Front. Mar. Sci. 5:355. doi: 10.3389/fmars.2018.00355
Lambert, E., MacLeod, C. D., Hall, K., Brereton, T., Dunn, T. E., Wall, D., et al. (2011). Quantifying likely cetacean range shifts in response to global climatic change: implications for conservation strategies in a changing world. Endanger. Species Res. 15, 205–222. doi: 10.3354/esr00376
Lucca, B. M., and Warren, J. D. (2019). Fishery-independent observations of Atlantic menhaden abundance in the coastal waters south of New York. Fish. Res. 218, 229–236. doi: 10.1016/j.fishres.2019.05.016
MacLeod, C. D. (2009). Global climate change, range changes and potential implications for the conservation of marine cetaceans: a review and synthesis. Endanger. Species Res. 7, 125–136. doi: 10.3354/esr00197
Murakami, H., Yoon, S., Kasai, A., Minamoto, T., Yamamoto, S., Sakata, M. K., et al. (2019). Dispersion and degradation of environmental DNA from caged fish in a marine environment. Fisher. Sci. 85, 327–337. doi: 10.1007/s12562-018-1282-6
Nichols, R. V., Vollmers, C., Newsom, L. A., Wang, Y., Heintzman, P. D., Leighton, M., et al. (2018). Minimizing polymerase biases in metabarcoding. Mol. Ecol. Resour. 18, 927–939. doi: 10.1111/1755-0998.12895
Parsons, K. M., Everett, M., Dahlheim, M., and Park, L. (2018). Water, water everywhere: Environmental DNA can unlock population structure in elusive marine species. R. Soc. Open Sci. 5:180537. doi: 10.1098/rsos.180537
Pinfield, R., Dillane, E., Runge, A. K. W., Evans, A., Mirimin, L., Niemann, J., et al. (2019). False-negative detections from environmental DNA collected in the presence of large numbers of killer whales (Orcinus orca). Environ. DNA 1, 316–328. doi: 10.1002/edn3.32
Port, J. A., O'Donnell, J. L., Romero-Maraccini, O. C., Leary, P. R., Litvin, S. Y., Nickols, K. J., et al. (2016). Assessing vertebrate biodiversity in a kelp forest ecosystem using environmental DNA. Mol. Ecol. 25, 527–541. doi: 10.1111/mec.13481
Riaz, T., Shehzad, W., Viari, A., Pompanon, F., Taberlet, P., and Coissac, E. (2011). ecoPrimers: inference of new DNA barcode markers from whole genome sequence analysis. Nucleic Acids Res. 39:e145. doi: 10.1093/nar/gkr732
Ruppert, K. M., Kline, R. J., and Rahman, M. S. (2019). Past, present, and future perspectives of environmental DNA (eDNA) metabarcoding: A systematic review in methods, monitoring, and applications of global eDNA. Global Ecol. Conserv. 17:e00547. doi: 10.1016/j.gecco.2019.e00547
Sequeira, A. M. M., Hays, G. C., Sims, D. W., Eguíluz, V. M., Rodríguez, J. P., Heupel, M. R., et al. (2019). Overhauling ocean spatial planning to improve marine megafauna conservation. Front. Mar. Sci. 6:639. doi: 10.3389/fmars.2019.00639
Stoeckle, M. Y., Adolf, J., Charlop-Powers, Z., Dunton, K. J., Hinks, G., and VanMorter, S. M. (2021). Trawl and eDNA assessment of marine fish diversity, seasonality, and relative abundance in coastal New Jersey, USA. ICES J. Marine Sci. 78, 293–304. doi: 10.1093/icesjms/fsaa225
Székely, D., Corfixen, N. L., Mørch, L. L., Knudsen, S. W., McCarthy, M. L., Teilmann, J., et al. (2021). Environmental DNA captures the genetic diversity of bowhead whales (Balaena mysticetus) in West Greenland. Environ. DNA 3, 643–654. doi: 10.1002/edn3.176
Thomsen, P. F., Kielgast, J., Iversen, L. L., Møller, P. R., Rasmussen, M., and Willerslev, E. (2012). Detection of a diverse marine fish fauna using environmental DNA from seawater samples. PLoS ONE 7:e41732. doi: 10.1371/journal.pone.0041732
Tulloch, V. J., Plagányi, É. E., Brown, C., Richardson, A. J., and Matear, R. (2019). Future recovery of baleen whales is imperiled by climate change. Glob. Chang. Biol. 25, 1263–1281. doi: 10.1111/gcb.14573
Ushio, M., Fukuda, H., Inoue, T., Makoto, K., Kishida, O., Sato, K., et al. (2017). Environmental DNA enables detection of terrestrial mammals from forest pond water. Mol. Ecol. Resourc. 17, e63–e75. doi: 10.1111/1755-0998.12690
Valentini, A., Taberlet, P., Miaud, C., Civade, R., Herder, J., Thomsen, P. F., et al. (2016). Next-generation monitoring of aquatic biodiversity using environmental DNA metabarcoding. Mol. Ecol. 25, 929–942. doi: 10.1111/mec.13428
Valsecchi, E., Arcangeli, A., Lombardi, R., Boyse, E., Carr, I. M., Galli, P., et al. (2021). Ferries and environmental DNA: underway sampling from commercial vessels provides new opportunities for systematic genetic surveys of marine biodiversity. Front. Mar. Sci. 8:1–17. doi: 10.3389/fmars.2021.704786
Van Parijs, S. M., Clark, C. W., Sousa-Lima, R. S., Parks, S. E., Rankin, S., Risch, D., et al. (2009). Management and research applications of real-time and archival passive acoustic sensors over varying temporal and spatial scales. Mar. Ecol. Prog. Ser. 395, 21–36. doi: 10.3354/meps08123
Yamahara, K. M., Preston, C. M., Birch, J., Walz, K., and Marin, I. I. I. (2019). In situ autonomous acquisition and preservation of marine environmental DNA using an autonomous underwater vehicle. Front. Mar. Sci. 6:373. doi: 10.3389/fmars.2019.00373
Keywords: eDNA, metabarcoding, biodiversity, distribution, cetacean, marine megafauna
Citation: Alter SE, King CD, Chou E, Chin SC, Rekdahl M and Rosenbaum HC (2022) Using Environmental DNA to Detect Whales and Dolphins in the New York Bight. Front. Conserv. Sci. 3:820377. doi: 10.3389/fcosc.2022.820377
Received: 23 November 2021; Accepted: 10 January 2022;
Published: 11 February 2022.
Edited by:
Om Rajora, University of New Brunswick Fredericton, CanadaReviewed by:
Allan D. McDevitt, University of Salford, United KingdomBelma Kalamujic Stroil, University of Sarajevo-Institute for Genetic Engineering and Biotechnology, Bosnia and Herzegovina
Copyright © 2022 Alter, King, Chou, Chin, Rekdahl and Rosenbaum. This is an open-access article distributed under the terms of the Creative Commons Attribution License (CC BY). The use, distribution or reproduction in other forums is permitted, provided the original author(s) and the copyright owner(s) are credited and that the original publication in this journal is cited, in accordance with accepted academic practice. No use, distribution or reproduction is permitted which does not comply with these terms.
*Correspondence: S. Elizabeth Alter, ealter@csumb.edu; Howard C. Rosenbaum, hrosenbaum@wcs.org